Integrative Single-Plaque Analysis Reveals Signature Aβ and Lipid Profiles in the Alzheimer's Brain
- PMID: 38830618
- PMCID: PMC11190877
- DOI: 10.1021/acs.analchem.3c05557
Integrative Single-Plaque Analysis Reveals Signature Aβ and Lipid Profiles in the Alzheimer's Brain
Abstract
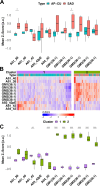
Cerebral accumulation of amyloid-β (Aβ) initiates molecular and cellular cascades that lead to Alzheimer's disease (AD). However, amyloid deposition does not invariably lead to dementia. Amyloid-positive but cognitively unaffected (AP-CU) individuals present widespread amyloid pathology, suggesting that molecular signatures more complex than the total amyloid burden are required to better differentiate AD from AP-CU cases. Motivated by the essential role of Aβ and the key lipid involvement in AD pathogenesis, we applied multimodal mass spectrometry imaging (MSI) and machine learning (ML) to investigate amyloid plaque heterogeneity, regarding Aβ and lipid composition, in AP-CU versus AD brain samples at the single-plaque level. Instead of focusing on a population mean, our analytical approach allowed the investigation of large populations of plaques at the single-plaque level. We found that different (sub)populations of amyloid plaques, differing in Aβ and lipid composition, coexist in the brain samples studied. The integration of MSI data with ML-based feature extraction further revealed that plaque-associated gangliosides GM2 and GM1, as well as Aβ1-38, but not Aβ1-42, are relevant differentiators between the investigated pathologies. The pinpointed differences may guide further fundamental research investigating the role of amyloid plaque heterogeneity in AD pathogenesis/progression and may provide molecular clues for further development of emerging immunotherapies to effectively target toxic amyloid assemblies in AD therapy. Our study exemplifies how an integrative analytical strategy facilitates the unraveling of complex biochemical phenomena, advancing our understanding of AD from an analytical perspective and offering potential avenues for the refinement of diagnostic tools.
Conflict of interest statement
The authors declare no competing financial interest.
Figures


Similar articles
-
Pyroglutamation of amyloid-βx-42 (Aβx-42) followed by Aβ1-40 deposition underlies plaque polymorphism in progressing Alzheimer's disease pathology.J Biol Chem. 2019 Apr 26;294(17):6719-6732. doi: 10.1074/jbc.RA118.006604. Epub 2019 Feb 27. J Biol Chem. 2019. PMID: 30814252 Free PMC article.
-
Tetramodal Chemical Imaging Delineates the Lipid-Amyloid Peptide Interplay at Single Plaques in Transgenic Alzheimer's Disease Models.Anal Chem. 2023 Mar 14;95(10):4692-4702. doi: 10.1021/acs.analchem.2c05302. Epub 2023 Mar 1. Anal Chem. 2023. PMID: 36856542 Free PMC article.
-
Structural amyloid plaque polymorphism is associated with distinct lipid accumulations revealed by trapped ion mobility mass spectrometry imaging.J Neurochem. 2022 Feb;160(4):482-498. doi: 10.1111/jnc.15557. Epub 2021 Dec 26. J Neurochem. 2022. PMID: 34882796
-
β-Amyloid peptides and amyloid plaques in Alzheimer's disease.Neurotherapeutics. 2015 Jan;12(1):3-11. doi: 10.1007/s13311-014-0313-y. Neurotherapeutics. 2015. PMID: 25371168 Free PMC article. Review.
-
Alzheimer's disease.Subcell Biochem. 2012;65:329-52. doi: 10.1007/978-94-007-5416-4_14. Subcell Biochem. 2012. PMID: 23225010 Review.
Cited by
-
Lipid trajectories improve risk models for Alzheimer's disease and mild cognitive impairment.J Lipid Res. 2025 Jan;66(1):100714. doi: 10.1016/j.jlr.2024.100714. Epub 2024 Nov 23. J Lipid Res. 2025. PMID: 39586400 Free PMC article.
-
Endocytic Pathways Unveil the Role of Syndecans in the Seeding and Spreading of Pathological Protein Aggregates: Insights into Neurodegenerative Disorders.Int J Mol Sci. 2025 Apr 24;26(9):4037. doi: 10.3390/ijms26094037. Int J Mol Sci. 2025. PMID: 40362276 Free PMC article. Review.
-
The impact of GABA and GABAergic pathway in polycystic ovary syndrome: a systematic review.Obstet Gynecol Sci. 2025 Mar;68(2):93-108. doi: 10.5468/ogs.24255. Epub 2025 Feb 11. Obstet Gynecol Sci. 2025. PMID: 39935052 Free PMC article.
-
Exploring the Aβ Plaque Microenvironment in Alzheimer's Disease Model Mice by Multimodal Lipid-Protein-Histology Imaging on a Benchtop Mass Spectrometer.Pharmaceuticals (Basel). 2025 Feb 13;18(2):252. doi: 10.3390/ph18020252. Pharmaceuticals (Basel). 2025. PMID: 40006065 Free PMC article.
-
Unsaturated Fatty Acids Are Decreased in Aβ Plaques in Alzheimer's Disease.J Neurochem. 2025 Jan;169(1):e16306. doi: 10.1111/jnc.16306. J Neurochem. 2025. PMID: 39825731 Free PMC article.
References
-
- Patterson C. (2018). World Alzheimer Report 2018 - The state of the art of dementia research: New frontiers Alzheimer’s Disease International.
-
- Villemagne V. L.; Burnham S.; Bourgeat P.; Brown B.; Ellis K. A.; Salvado O.; Szoeke C.; Macaulay S. L.; Martins R.; Maruff P.; et al. Amyloid β deposition, neurodegeneration, and cognitive decline in sporadic Alzheimer’s disease: A prospective cohort study. Lancet Neurol. 2013, 12, 357–367. 10.1016/S1474-4422(13)70044-9. - DOI - PubMed
-
- Gordon B. A.; Blazey T. M.; Su Y.; Hari-Raj A.; Dincer A.; Flores S.; Christensen J.; McDade E.; Wang G.; Xiong C.; et al. Spatial patterns of neuroimaging biomarker change in individuals from families with autosomal dominant Alzheimer’s disease: a longitudinal study. Lancet Neurol. 2018, 17, 241–250. 10.1016/S1474-4422(18)30028-0. - DOI - PMC - PubMed
-
- Vermunt L.; Sikkes S. A. M.; van den Hout A.; Handels R.; Bos I.; van der Flier W. M.; Kern S.; Ousset P.; Maruff P.; Skoog I.; et al. Duration of preclinical, prodromal, and dementia stages of Alzheimer’s disease in relation to age, sex, and APOE genotype. Alzheimers Dementia 2019, 15, 888–898. 10.1016/j.jalz.2019.04.001. - DOI - PMC - PubMed
Publication types
MeSH terms
Substances
LinkOut - more resources
Full Text Sources
Medical

