. 2024 Jun 18;18(24):15452-15467.
doi: 10.1021/acsnano.3c09206. Epub 2024 Jun 3.

Acidic Nanoparticles Restore Lysosomal Acidification and Rescue Metabolic Dysfunction in Pancreatic β-Cells under Lipotoxic Conditions

Affiliations

Acidic Nanoparticles Restore Lysosomal Acidification and Rescue Metabolic Dysfunction in Pancreatic β-Cells under Lipotoxic Conditions

Chih Hung Lo et al. ACS Nano. .

Abstract

Type 2 diabetes (T2D), a prevalent metabolic disorder lacking effective treatments, is associated with lysosomal acidification dysfunction, as well as autophagic and mitochondrial impairments. Here, we report a series of biodegradable poly(butylene tetrafluorosuccinate-co-succinate) polyesters, comprising a 1,4-butanediol linker and varying ratios of tetrafluorosuccinic acid (TFSA) and succinic acid as components, to engineer lysosome-acidifying nanoparticles (NPs). The synthesized NPs are spherical with diameters of ≈100 nm and have low polydispersity and good stability. Notably, TFSA NPs, which are composed entirely of TFSA, exhibit the strongest degradation capability and superior acidifying properties. We further reveal significant downregulation of lysosomal vacuolar (H+)-ATPase subunits, which are responsible for maintaining lysosomal acidification, in human T2D pancreatic islets, INS-1 β-cells under chronic lipotoxic conditions, and pancreatic tissues of high-fat-diet (HFD) mice. Treatment with TFSA NPs restores lysosomal acidification, autophagic function, and mitochondrial activity, thereby improving the pancreatic function in INS-1 cells and HFD mice with lipid overload. Importantly, the administration of TFSA NPs to HFD mice reduces insulin resistance and improves glucose clearance. These findings highlight the therapeutic potential of lysosome-acidifying TFSA NPs for T2D.

Keywords: Type 2 diabetes (T2D); V-ATPase; acidic nanoparticles; autophagic degradation; insulin secretion; lysosomal acidification; mitochondrial function.


Conflict of interest statement

The authors declare the following competing financial interest(s): M.W.G., O.S.S., and J.Z. have jointly invented and hold a patent (Patent number: US10925975B2) registered with the United States Patent and Trademark Office. This patent focuses on the utilization of acidic nanoparticles as a therapeutic approach for diseases characterized by compromised lysosomal acidity. O.S.S. and M.W.G. are also co-founders of Enspire Bio/Capacity Bio, which are testing the application of these acidic nanoparticles. The remaining authors declare no additional competing interests.

Figures

Figure 1
Figure 1
Schematic representation of fatty-acid-induced lipotoxicity in β-cells and functional recovery of lysosomal and cellular functions on treatment with TFSA NPs. (A) Under lipotoxic conditions or lipid accumulation, such as palmitic acid treatment, the lysosomal pH is elevated, and lysosomal functions are impaired. This causes a reduction in the autophagic turnover of damaged mitochondria and a decrease in the clearance of lipid droplets. The accumulation of impaired mitochondria that have decreased function leads to a lower ATP level, resulting in intracellular accumulation of insulin vesicles and a decrease in insulin release upon glucose stimulation. (B) Treatment of TFSA NPs reacidifies the impaired lysosomes and promotes their functions in β-cells under lipotoxic conditions, which leads to an improved autophagic turnover of damaged mitochondria and increased clearance of lipid droplets. This results in increased mitochondrial function, which produces more ATP and increases insulin release upon glucose stimulation. This schematic is created with BioRender.com.
Figure 2
Figure 2
Engineering of TFSA nanoparticles (NPs) consisting of 100% PBFSU polyester that have strong degradation capability and superior acidifying properties. (A) Scheme for the synthesis of poly(butylene tetrafluorosuccinate-co-succinate) (PBSU or 25–100% PBFSU) polyesters from tetrafluorosuccinic acid (TFSA) and succinic acid (SA) as well as a 1,4-butanediol linker. Various types of NPs were engineered based on different component acids through the nanoprecipitation method. TTIP: titanium(IV) isopropoxide; cat: catalyst. (B) Characterization of particle size, polydispersity (PDI), and zeta potential of the different types of NPs. (C) Scanning electron microscopy images to characterize the shape and morphology of the different types of NPs. NPs consisting of 100% PBFSU were termed TFSA NPs. (D) Gel permeation chromatography analysis to determine the degradation rate of the different types of NPs with TFSA NPs (red line) shows the strongest degradation capability. (E) Determination of the extent of buffer acidification by the different types of NPs where TFSA NPs (red line) demonstrates superior acidifying properties under mildly acidic conditions of pH 6.0. (F) Cell cytotoxicity assay illustrating that all types of NPs, including TFSA NPs (red line), are nontoxic to INS-1 β-cells. Data are means ± SD of N = 3 independent experiments.
Figure 3
Figure 3
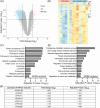
Data mining of the microarray transcriptome data set from GSE25724 containing the mRNA expression of human T2D and nondiabetic islets. (A) Volcano plot illustrating the differentially expressed genes from the GSE25724 data set based on the mRNA expression of the T2D (6 samples) and nondiabetic (7 samples) islets with a cutoff of adjusted P < 0.05 and log2(fold change)>|1|. (B) Heatmap illustrating the mRNA profiles of T2D (6 samples) and nondiabetic (7 samples) islets from the GSE25724 data set. (C) Kyoto Encyclopedia of Genes and Genomes (KEGG) analysis showing the enriched pathways associated with DEGs. (D) Gene Ontology Biological Process (GOBP) analysis showing the enriched biological processes associated with DEGs. (E) Specific lysosomal V-ATPase subunits that are identified to be downregulated in T2D islets. All analyses were performed with adjusted P < 0.05.
Figure 4
Figure 4
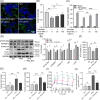
TFSA NPs restore lysosomal acidification and autophagic function in INS-1 β-cells under lipotoxic conditions with palmitate treatment. (A, B) Western blotting characterization and quantification showing reduced lysosomal V-ATPase subunits in INS-1 β-cells under lipotoxic conditions with palmitate treatment. (C, D) Immunofluorescence and quantification illustrating an elevated lysosomal pH in palmitate-treated (palm) INS-1 β-cells; the addition of TFSA NPs lowers lysosomal pH and restores luminal acidification in these cells. (E) TFSA NPs restore lysosomal cathepsin L function in palmitate-treated INS-1 β-cells. (F) Western blotting characterization and (G–H) quantification demonstrating autophagic function impairment as characterized by the accumulation of p62 and LC3II in palmitate-treated INS-1 β-cells; TFSA NPs promote autophagic degradation under lipotoxic conditions. Data presented are relative to the control without palmitate and TFSA NPs. Data are means ± SD of N = 4 independent experiments. *P < 0.05, **P < 0.01, ***P < 0.001, ****P < 0.0001, and ns indicates nonsignificance by unpaired Student’s t-test (between two samples) and one-way ANOVA with post hoc Tukey’s test (multiple comparisons).
Figure 5
Figure 5
TFSA NPs improve the mitochondrial turnover and functions in INS-1 β-cells under lipotoxic conditions with palmitate treatment. (A–B) Confocal microscopy images and quantification of INS-1 β-cells transfected with the mCherry-GFP-FIS1 mitophagy reporter plasmid followed by treatment with (i) BSA (control), (ii) palmitate, and palmitate with (iii) 50 and (iv) 100 μg/mL TFSA NPs. (C, D) Confocal images of INS-1 β-cells stained with MitoTracker Deep Red and quantification of the mitochondrial footprint and network branches using MiNA analysis for samples treated with BSA (control), palmitate (palm), and palmitate with 50 and 100 μg/mL TFSA NPs. (E–G) Measurement of (E) mitochondrial membrane potential as indicated by TMRE intensity, (F) reactive oxygen species generation as characterized by the MitoSOX assay, and (G) cellular ATP content under respective treatment conditions in INS-1 β-cells. Data presented are relative to the control without palmitate and TFSA NPs. Data are means ± SD of N = 4 independent experiments. *P < 0.05, **P < 0.01, ***P < 0.001, and ****P < 0.0001 by one-way ANOVA with post hoc Tukey’s test (multiple comparisons).
Figure 6
Figure 6
TFSA NPs promote insulin secretion in palmitate-treated INS-1 β-cells and improve the metabolic function in the HFD mouse model of T2D. (A–B) Immunofluorescence and quantification demonstrate a decrease in intracellular insulin granules in INS-1 β-cells under lipotoxic conditions with palmitate (palm) treatment, and TFSA NPs increase the presence of these intracellular insulin granules. Data presented are relative to the control without palmitate and TFSA NPs. (C) Insulin secretion is decreased in palmitate-treated INS-1 β-cells and treatment with TFSA NPs increases glucose-stimulated insulin secretion. There is no statistical difference in basal insulin secretion levels among all treatment conditions. (D, E) Western blotting characterization and quantification demonstrating lysosomal acidification defects (decreased levels of V-ATPase subunits ATP6V1B2, ATP6AP2, and ATP6V1A) and autophagic dysfunction (accumulation of p62 and LC3II), indicative of impaired pancreatic function in pancreatic tissues isolated from HFD mice as compared to the control (ctrl) mice. Treatment with TFSA NPs restores lysosomal acidification and autophagic activity and increases pancreatic function in HFD mice. (F) TFSA NPs elevate the ATP content in pancreatic tissues of HFD mice. (G, H) Measurement of (G) fasting blood insulin levels and (H) fasting blood glucose levels in control mice without treatment and under treatment with TFSA NPs as well as in HFD mice without treatment and under treatment with TFSA NPs. (I, J) Assessment of glucose tolerance by measuring the (I) glucose tolerance response and (J) total glucose excursion in control mice without treatment and under treatment with TFSA NPs as well as in HFD mice without treatment and under treatment with TFSA NPs. Data are means ± SD of N = 4 independent cell experiments, and N = 8 mice per treatment group. *P < 0.05, **P < 0.01, ***P < 0.001, ****P < 0.0001, and ns indicates nonsignificance by one-way ANOVA with post hoc Tukey’s test (multiple comparisons).

References

    1. Reed J.; Bain S.; Kanamarlapudi V. A Review of Current Trends with Type 2 Diabetes Epidemiology, Aetiology, Pathogenesis, Treatments and Future Perspectives. Diabetes Metab Syndr Obes 2021, Volume 14, 3567–3602. 10.2147/DMSO.S319895. - DOI - PMC - PubMed
    1. International Diabetes Federation, IDF Diabetes Atlas, 2021.
    1. Shahabi N.; Fakhri Y.; Aghamolaei T.; Hosseini Z.; Homayuni A. Socio-personal factors affecting adherence to treatment in patients with type 2 diabetes: A systematic review and meta-analysis. Primary Care Diabetes 2023, 17 (3), 205–220. 10.1016/j.pcd.2023.03.005. - DOI - PubMed
    1. Klein S.; Gastaldelli A.; Yki-Järvinen H.; Scherer P. E. Why does obesity cause diabetes?. Cell Metab. 2022, 34 (1), 11–20. 10.1016/j.cmet.2021.12.012. - DOI - PMC - PubMed
    1. Leitner D. R.; Frühbeck G.; Yumuk V.; Schindler K.; Micic D.; Woodward E.; Toplak H. Obesity and Type 2 Diabetes: Two Diseases with a Need for Combined Treatment Strategies - EASO Can Lead the Way. Obes. Facts 2017, 10 (5), 483–492. 10.1159/000480525. - DOI - PMC - PubMed

Publication types

LinkOut - more resources