. 2024 Jun 24;64(12):4727-4738.
doi: 10.1021/acs.jcim.4c00360. Epub 2024 Jun 3.

Anisotropic Network Analysis of Open/Closed HCN4 Channel Advocates Asymmetric Subunit Cooperativity in cAMP Modulation of Gating

Affiliations

Anisotropic Network Analysis of Open/Closed HCN4 Channel Advocates Asymmetric Subunit Cooperativity in cAMP Modulation of Gating

Patrick Kunzmann et al. J Chem Inf Model. .

Abstract

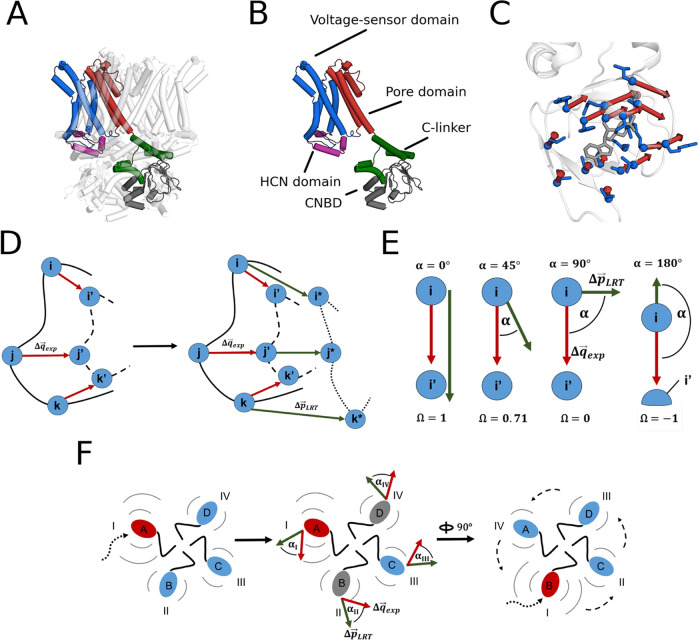
Hyperpolarization-activated cyclic nucleotide-modulated (HCN) channels are opened in an allosteric manner by membrane hyperpolarization and cyclic nucleotides such as cAMP. Because of conflicting reports from experimental studies on whether cAMP binding to the four available binding sites in the channel tetramer operates cooperatively in gating, we employ here a computational approach as a promising route to examine ligand-induced conformational changes after binding to individual sites. By combining an elastic network model (ENM) with linear response theory (LRT) for modeling the apo-holo transition of the cyclic nucleotide-binding domain (CNBD) in HCN channels, we observe a distinct pattern of cooperativity matching the "positive-negative-positive" cooperativity reported from functional studies. This cooperativity pattern is highly conserved among HCN subtypes (HCN4, HCN1), but only to a lesser extent visible in structurally related channels, which are only gated by voltage (KAT1) or cyclic nucleotides (TAX4). This suggests an inherent cooperativity between subunits in HCN channels as part of a ligand-triggered gating mechanism in these channels.


Conflict of interest statement

The authors declare no competing financial interest.

Figures

Figure 1
Figure 1
Structures of the HNC channel and representation of ligand-induced CNBD displacements with a schematic representation of the LRT procedure and computation of overlaps for LRT-induced displacements. Structural overview of the apo HCN4 channel in the open state (7NP3), with colored functional subunits in the tetrameric channel (A) and for a single monomer (B): The N-terminal HCN domain is illustrated in violet, the voltage sensor containing domains in blue, pore domains in red, the C-linker in green and the CNBD in dark gray. cAMP-induced displacements in the CNBD of HCN4 (C). The CNBD of the apo structure is shown in the cartoon representation, with red arrows as displacement vectors, pointing toward the location of the ligand-binding residues (blue) in the holo structure. The ligand (gray, stick-representation) is shown in its bound position in the holo state. A schematic overview is depicted in (D): LRT forces are applied along displacement vectors (red arrows, Δq⃗exp) on one subunit, pointing from the residue’s initial apo to their holo position (i and i′ respectively). As a consequence of all interactions in the ANM model, the perturbation yields a predicted LRT-induced displacement vector (green arrow, Δp⃗LRT), pointing from the apo to the LRT-induced displacement position (i and i*, respectively). The alignment of experimental apo-holo displacements and those induced by LRT on one subunit is evaluated using the overlap Ω, which is the Cosine of the angle α between both vectors (E). The whole procedure is depicted in (F) in an overview of the homotetramer: Single subunits are acutely perturbed (red sphere, perturbing force as dotted curved arrow) and overlaps evaluated separately for the acutely perturbed subunit (I) as well as for the remaining subunits (II–IV). Subunits II and IV are neighboring subunit I directly (cis-located), and subunit III is located opposite of I (trans-located monomer). Each structural subunit is perturbed independently (depicted as 90° rotation of the relative positions I–IV); results for relative positions II–IV are averaged.
Figure 2
Figure 2
Comparisons between LRT-induced displacements and experimental displacements reveal a robust pattern for HCN as well as for KAT1 and TAX4. Experimental displacements Δq⃗exp (red) and LRT-induced displacements Δp⃗LRT (green) of the apo HCN4 structure in the open state are shown as arrows in subunit IV, III, I, and II (A). Overlaps Ω between LRT-computed displacements and experimental apo-holo displacement vectors (arbitrary units) after perturbation of a single subunit in relative position I (B). A clear pattern is visible with positive overlaps for the trans subunit (III) compared to negative overlaps for cis-located subunits (II, IV). Overall higher absolute overlaps are observed for HCN channels compared with TAX4 and KAT1. The average overlaps for all single perturbed subunits and their corresponding relative conditions are plotted as bars. Standard deviations for these values are below ±0.1.
Figure 3
Figure 3
Parallel LRT null model perturbations of cAMP binding residues in HCN. Overlaps in subunits II–IV (columns 1–3, respectively, denoted as ΩII–ΩIV) are plotted as a function of overlap values in subunit I (ΩI) after randomized perturbation of cAMP binding residues in the latter (A). For a better visual distinction, dots are color coded according to the overlaps ΩII–ΩIV, respectively (minimum: blue; maximum: red). Distinct channels are plotted in row order: HCN4 (7NP3/7NP4), the alternative HCN4 structure pair (6GYN/6GYO) (HCN4-alter.), and HCN1 (5U6O/5U6P). The Pearson coefficient and its associated P value are shown above each subplot. An approximately linear relationship between the overlap at position I and those at other positions can be observed. Here, positions II and IV (cis) are negatively correlated with those in I, while those in III (trans) are positively correlated. Overlap distributions for HCN4 are shown in (B), with the 100 highest (Max. ΩI, red) and lowest (Min. ΩI, blue) overlap distributions as well as those 100 with an overlap closest to zero (Min |ΩI|, gray) shown as stripplot. Boxes denote the interquartile range and the median of the category. Opposing subunits are highlighted with the same color (I + III: dark gray; II + IV: light gray).
Figure 4
Figure 4
LRT-modeled sequential binding patterns of HCN channels show the same pattern as the experimentally derived Ka values for HCN2. The overlap for 1–4 bound cAMP/cGMP molecules (solid lines) shows a qualitatively similar behavior between LRT-simulated subsequent binding of ligands in I–III–II–IV and the experimentally derived association constant Ka of HCN2 channels in the open state (dotted yellow line) from Kusch et al. (A). The perturbed subunit in the current step is depicted in red, previously perturbed subunits in blue, and unperturbed subunits in gray (B).

Similar articles

References

    1. DiFrancesco D. Pacemaker Mechanisms in Cardiac Tissue. Annu. Rev. Physiol. 1993, 55 (1), 455–472. 10.1146/annurev.ph.55.030193.002323. - DOI - PubMed
    1. Pape H.-C. Queer Current and Pacemaker: The Hyperpolarization-Activated Cation Current in Neurons. Annu. Rev. Physiol. 1996, 58 (1), 299–327. 10.1146/annurev.ph.58.030196.001503. - DOI - PubMed
    1. Lee C.-H.; MacKinnon R. Structures of the Human HCN1 Hyperpolarization-Activated Channel. Cell 2017, 168 (1–2), 111–120. 10.1016/j.cell.2016.12.023. - DOI - PMC - PubMed
    1. Saponaro A.; Bauer D.; Giese M. H.; Swuec P.; Porro A.; Gasparri F.; Sharifzadeh A. S.; Chaves-Sanjuan A.; Alberio L.; Parisi G.; Cerutti G.; Clarke O. B.; Hamacher K.; Colecraft H. M.; Mancia F.; Hendrickson W. A.; Siegelbaum S. A.; DiFrancesco D.; Bolognesi M.; Thiel G.; Santoro B.; Moroni A. Gating Movements and Ion Permeation in HCN4 Pacemaker Channels. Mol. Cell 2021, 81 (14), 2929–2943. 10.1016/j.molcel.2021.05.033. - DOI - PMC - PubMed
    1. James Z. M.; Zagotta W. N. Structural Insights into the Mechanisms of CNBD Channel Function. J. Gen. Physiol. 2018, 150 (2), 225–244. 10.1085/jgp.201711898. - DOI - PMC - PubMed

MeSH terms

LinkOut - more resources