. 2024 Jul 10;44(28):e1441232024.
doi: 10.1523/JNEUROSCI.1441-23.2024.

Molecular Characterization of Nodose Ganglia Development Reveals a Novel Population of Phox2b+ Glial Progenitors in Mice

Affiliations

Molecular Characterization of Nodose Ganglia Development Reveals a Novel Population of Phox2b+ Glial Progenitors in Mice

Elijah D Lowenstein et al. J Neurosci. .

Abstract

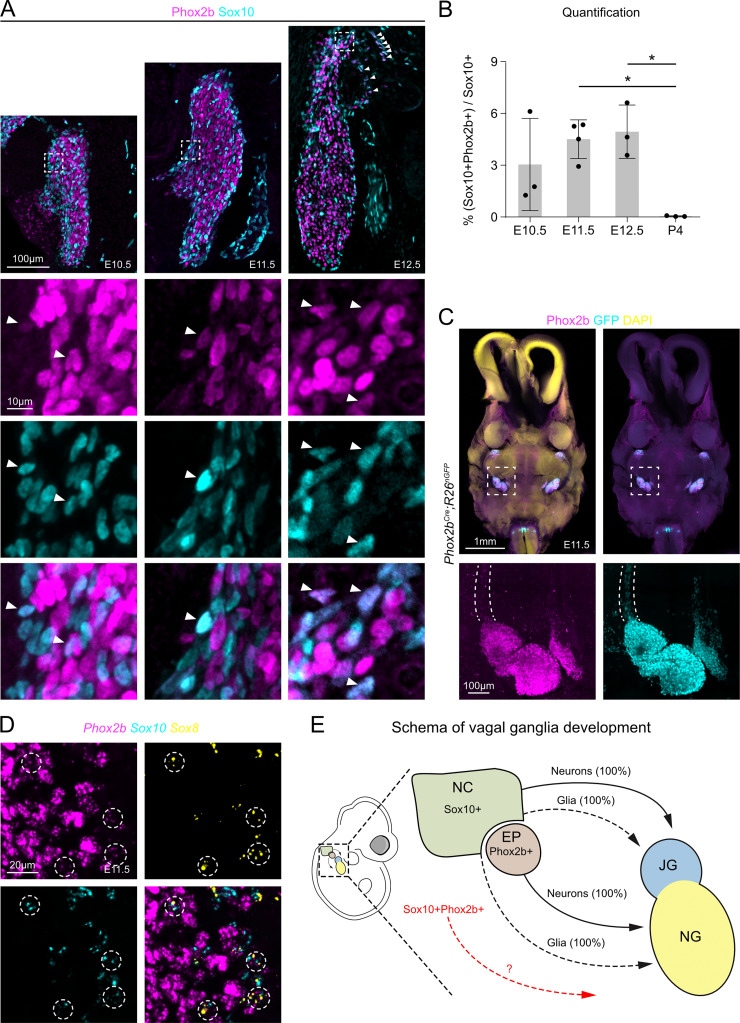
The vagal ganglia, comprised of the superior (jugular) and inferior (nodose) ganglia of the vagus nerve, receive somatosensory information from the head and neck or viscerosensory information from the inner organs, respectively. Developmentally, the cranial neural crest gives rise to all vagal glial cells and to neurons of the jugular ganglia, while the epibranchial placode gives rise to neurons of the nodose ganglia. Crest-derived nodose glial progenitors can additionally generate autonomic neurons in the peripheral nervous system, but how these progenitors generate neurons is unknown. Here, we found that some Sox10+ neural crest-derived cells in, and surrounding, the nodose ganglion transiently expressed Phox2b, a master regulator of autonomic nervous system development, during early embryonic life. Our genetic lineage-tracing analysis in mice of either sex revealed that despite their common developmental origin and extreme spatial proximity, a substantial proportion of glial cells in the nodose, but not in the neighboring jugular ganglia, have a history of Phox2b expression. We used single-cell RNA-sequencing to demonstrate that these progenitors give rise to all major glial subtypes in the nodose ganglia, including Schwann cells, satellite glia, and glial precursors, and mapped their spatial distribution by in situ hybridization. Lastly, integration analysis revealed transcriptomic similarities between nodose and dorsal root ganglia glial subtypes and revealed immature nodose glial subtypes. Our work demonstrates that these crest-derived nodose glial progenitors transiently express Phox2b, give rise to the entire complement of nodose glial cells, and display a transcriptional program that may underlie their bipotent nature.

Keywords: Phox2b; development; neural crest; nodose; peripheral glia; vagal ganglia.


Conflict of interest statement

The authors declare no competing financial interests.

Figures

Figure 1.
Figure 1.
Some Sox10+ cells in the nodose anlage transiently express Phox2b during early development. A, Immunohistology of sagittal sections of the nodose anlage at E10.5, E11.5, and E12.5 using antibodies against Phox2b (magenta) and Sox10 (cyan). Magnifications of the boxed regions are shown below. Arrows mark Sox10+Phox2b+ cells. B, Quantifications revealed that 3.0 ± 2.7%, 4.5 ± 1.1%, and 4.9 ± 1.5% of Sox10+ cells in the nodose ganglia coexpress Phox2b at E10.5, E11.5, and E12.5, respectively. Shortly after birth at P4, 0.0 ± 0.0% of Sox10+ cells express Phox2b, and these proteins are exclusively present in nodose glial cells and neurons, respectively. N = 3–4. C, Immunohistology of a CUBIC cleared 300 µm transverse section from an E11.5 Phox2bCre;R26nGFP embryo using antibodies against Phox2b (magenta) and GFP (cyan). DAPI was used as a counterstain (yellow). One nodose ganglion is shown magnified below, and the vagus nerve is outlined with dotted lines. Note that there are many GFP+Phox2b− cells along the nerve. D, smFISH (RNAscope) against Phox2b (magenta), Sox10 (cyan), and Sox8 (yellow) mRNA. White dotted circles show Phox2b+Sox10+Sox8+ cells. E, A schema showing vagal ganglia development. The neural crest (NC, olive green) contains Sox10+ progenitors that give rise to neurons (solid lines) and glial cells (dotted lines) of the jugular ganglia (JG, blue) and glia of the nodose ganglia (NG, yellow). NG neurons derive from the Phox2b+ epibranchial placode (EP, beige). The derivatives from Sox10+Phox2b+ cells are unknown and are shown in red. Data are represented as mean ± SD; *p < 0.05; ordinary one-way ANOVA with Tukey’s multiple-comparison test (B). Abbreviations: JG, jugular ganglia; NG, nodose ganglia; NC, neural crest; EP, epibranchial placode.
Figure 2.
Figure 2.
Nodose glial cells have a history of Phox2b expression. A, A schema outlining the genetic lineage-tracing strategy used to label all cells with a history of either Wnt1 or Phox2b. We crossed Wnt1Cre or Phox2bCre animals with R26nGFP reporter mice to generate Wnt1Cre;R26nGFP and Phox2bCre;R26nGFP mice. In these animals, all cells that expressed or express Wnt1 (in Wnt1Cre;R26nGFP) or Phox2b (in Phox2bCre;R26nGFP) will express a nuclear GFP. B, We used immunohistology against TrkA (red) and Phox2b (red) to distinguish between the neighboring TrkA+Phox2b− jugular ganglion (JG) and the TrkA-Phox2b+ nodose ganglion (NG). Dotted white lines show the boundary between the jugular and nodose ganglia. For clarity a vagal ganglion is shown schematically on the right. C, Immunohistology experiments in the nodose ganglia of Phox2bCre;R26nGFP mice at P4. Immunohistology against GFP (cyan) and Phox2b (magenta, left); quantifications show that 97.3 ± 2.8% of Phox2b+ cells are GFP+, but surprisingly only 44.1 ± 11.1% of GFP+ cells are Phox2b+; n = 3. Immunohistology against GFP (cyan) and Sox10 (magenta, middle), quantifications show that unexpectedly 35.2 ± 2.3% of Sox10+ cells are GFP+, and 50.4 ± 8.3% of GFP+ cells are Sox10+; n = 3. Immunohistology against GFP (cyan) and Tlx3 (magenta, right); quantification shows that 53.4 ± 6.8% of Tlx3+ cells are GFP+; n = 4. D, Immunohistology experiments in the nodose ganglia of Wnt1Cre;R26nGFP mice at P4. Immunohistology against GFP (cyan) and Phox2b (magenta, left); quantifications show that 2.4 ± 3.0% of Phox2b+ cells are GFP+; n = 3. Immunohistology against GFP (cyan) and Sox10 (magenta, middle); quantifications show that 99.1 ± 0.7% of Sox10+ cells are GFP+; n = 3. E, A schema outlining the genetic lineage-tracing strategy used to label neurons with a history of either Wnt1 or Phox2b. We crossed Wnt1Cre or Phox2bCre animals with TaunLacZ reporter mice to generate Wnt1Cre;TaunLacZ and Phox2bCre;TaunLacZ mice. In these animals, neurons that expressed or express Wnt1 (in Wnt1Cre;TaunLacZ) or Phox2b (in Phox2bCre;TaunLacZ) will express a nuclear β-galactosidase. F, Immunohistology experiments in the jugular ganglia of Wnt1Cre;TaunLacZ mice at P4. Immunohistology against β-gal (cyan) and Tlx3 (magenta, left); quantification shows that 95.7 ± 2.6% of β-gal+ cells are Tlx3+; n = 3. Immunohistology against β-gal (cyan) and TrkA (magenta, left); quantification shows that 81.8 ± 5.0% of β-gal+ cells are TrkA+; n = 3. Magnifications of the boxed regions are shown in the inset. G, Immunohistology experiments in the nodose ganglia of Phox2bCre;TaunLacZ mice at P4. Immunohistology against β-gal (cyan) and Tlx3 (magenta, left); quantification shows that 99.6 ± 0.4% of β-gal+ cells are Tlx3+; n = 3. Immunohistology against β-gal (cyan) and TrkB (magenta, left); quantification shows that 99.0 ± 1.4% of β-gal+ cells are TrkB+; n = 3. Magnifications of the boxed regions are shown in the inset.
Figure 3.
Figure 3.
Nodose glial cells with a history of Phox2b expression are crest-derived. A, To specifically label the progeny from all cells that have a history of both Wnt1 and Phox2b expression, we used a reporter mouse that expresses nuclear GFP from the Rosa locus only after Cre- and Flp-mediated stop cassette excision (R26ds-nGFP) together with Wnt1Cre and Phox2bFlpO. B, We examined the vagal ganglia from Wnt1Cre;Phox2bFlpO;R26ds-nGFP animals at P4 and performed immunohistology against GFP (cyan), together with TrkA (magenta, left) and Phox2b (magenta, right). Almost no TrkA+ jugular neurons (0.8 ± 1.3%, n = 3) or Phox2b+ nodose neurons (0.2 ± 0.2%, n = 3) were GFP+. C, Immunohistology against GFP (cyan) and Sox10 (magenta) in Wnt1Cre;Phox2bFlpO;R26ds-nGFP at P4 revealed that 96.9 ± 0.7% of all GFP+ cells were Sox10+ and 38.4 ± 2.6% of all nodose Sox10+ cells were GFP+; n = 3. GFP+ cells were located in the nodose rather than the jugular ganglia (96.4 ± 2.1% vs 3.8 ± 2.2%; p < 0.0001; n = 3). D, Wnt1Cre;Phox2bFlpO animals were crossed together with a reporter mouse harboring (1) the Ai65 allele that will express cytoplasmic tdTomato from the Rosa locus only after Cre- and Flp-mediated stop cassette excision in all cells and (2) the TaunLacZ-mGFP allele that will express a nuclear β-galactosidase and membrane GFP from the Tau locus after Cre-mediated stop cassette excision specifically in neurons. We examined the vagal ganglia from Wnt1Cre;Phox2bFlpO;TaunLacZ-mGFP;Ai65 animals at P4 and performed immunohistology against GFP (cyan), together with tdTomato (magenta) and β-gal (yellow). The dotted white box is shown magnified to the right. E, Magnifications of individual tdTomato+ glial cells (magenta) from dotted blue boxes in D. F, A schema showing vagal ganglia development. The neural crest (NC, olive green) contains Sox10+ progenitors that give rise to neurons (solid lines) and glial cells (dotted lines) of the jugular ganglia (JG, blue) and the newly described Sox10+Phox2b+ progenitors that give rise to glia (dotted red line) of the nodose ganglia (NG, yellow). NG neurons derive from the Phox2b+ epibranchial placode (EP, beige). Data are represented as mean ± SD; ****p < 0.0001; unpaired two-tailed t test (J). Abbreviations: JG, jugular ganglia; NG, nodose ganglia; NC, neural crest; EP, epibranchial placode.
Figure 4.
Figure 4.
Bioinformatics analysis reveals that Sox10+Phox2b+ cells give rise to all major glial cell types in the nodose ganglia. A, In order to examine the derivatives from Sox10+Phox2b+ cells, we used Phox2bCre to drive the expression of a cytoplasmic tomato protein upon Cre-mediated excision of a stop cassette. Immunofluorescence at P4 showed many tdTomato+ cells in the nodose ganglion. To investigate the non-neuronal derivatives from Sox10+Phox2b+ cells, we dissociated the vagal ganglia from Phox2bCre;Ai14 mice at P4 and employed a neuronal depletion protocol. After enzymatic digestion at 37°C, ganglia were harshly mechanically triturated and passed twice through a 40 µm filter. 384 tdTomato+ cells were then sorted into four 96-well plates using flow cytometry. scRNA-seq libraries were prepared using the CEL-Seq2 protocol and sequenced. B, We detected a median of 4,484 genes and 11,900 UMIs per cell. C, UMAP plot of non-neuronal Phox2b derivatives, with each subtype labeled in a different color. The UMAP plot revealed four transcriptomically unique non-neuronal subtypes: NMSCs (peach), SG (gold), MSCs (green), and GPs (blue). D, Heatmap showing the top five subtype-specific genes for each subtype, ranked by p value. Note the color code on top of the heatmap. The marker gene used to identify each subtype is shown in red. E, Violin plots showing the subtype markers. Scn7a labels NMSC, Fabp7 labels SG, Pou3f1 labels MSC, and MKi67 labels GP. F, UMAP plots for general glia markers Apoe and Sox10 showing that all cells in our analysis are glia. G, UMAP plots for each subtype marker. H, Hierarchical clustering dendrogram reveals that NMSC and SG are the most transcriptomically similar subtypes, while MSC and GP are different from each other and also from NMSC and SG. Illustrations were adapted from bioicons.com and scidraw.io and licensed under CC-BY 3.0 and CC-BY 4.0.
Figure 5.
Figure 5.
GO term analysis reveals putative roles for the four glial cell subtypes. Top 15 enriched GO terms for NMSCs, MSCs, SG, and GPs.
Figure 6.
Figure 6.
smFISH confirms that Sox10+Phox2b+ cells give rise to all major glial cell types in the nodose ganglia in vivo. A, Phox2bCre;R26nGFP mice were used to label all cells with a history of Phox2b expression with nuclear GFP (cyan). Nodose ganglia at P4 were analyzed using immunofluorescence against GFP (cyan) and smFISH probes against Sox10 (magenta, left) to label glial cells and Phox2b (magenta, right) to label neurons. Notice the many GFP+ glial cells that are Phox2b−. Arrowheads mark GFP+ glial cells with a history of Phox2b expression that are Sox10+ (left) and Phox2b− (right). B, Nodose ganglia were analyzed at P4 using immunohistology against GFP (cyan) together with smFISH probes (magenta) against Scn7a to label NMSC, Fabp7 to label SG, Pou3f1 to label MSC, and MKi67 to label GP. Arrowheads mark marker+GFP+ cells. Note that Phox2b+ nodose neurons have large, bright, and round nuclei, while glial cells with a history of Phox2b expression have smaller, dimmer, oblong-shaped nuclei. C, smFISH with probes against glial subtype markers show that there is hardly any overlap between glial subtypes. Arrowheads label rare cells that simultaneously express subtype markers for two glial subtypes. C, UMAPs showing additional subtype marker genes for NMSCs, SG, MSCs, and GPs. D, Summary diagram showing that Sox10+Phox2b+ cells during early development give rise to Sox10+Apoe+Phox2b− NMSC, SG, MSC, and GP postnatally. Illustrations were adapted from bioicons.com and scidraw.io and licensed under CC-BY 3.0 and CC-BY 4.0.
Figure 7.
Figure 7.
Dataset integration of peripheral glial cells reveals transcriptomic similarities between DRG and nodose ganglia glial cells. A, Top, UMAP plot of nodose glial cells, with each subtype labeled in a different color. The UMAP plot revealed four transcriptomically unique non-neuronal subtypes: NMSCs (peach), SG (gold), MSCs (green), and GPs (blue). Bottom, 2D visualization of glial subtypes g1–g11 from Tasdemir-Yilmaz et al. (2021). B, UMAP of the integration analysis between the datasets shown in A. Top, nodose glial cells are shown color-coded by subtype, with the Tasdemir-Yilmaz et al. (2021) glial cells shown in gray. Bottom, Tasdemir-Yilmaz et al. (2021) glial cells are shown color-coded by subtype, with nodose glial cells shown in gray. C, Sankey plot that displays the results from Suerat's cell-type label transfer assigning the labels of the reference dataset [Tasdemir-Yilmaz et al. (2021) glial subtypes] to the cells of the query dataset (nodose glial subtypes). D, UMAP plots of nodose glial cells for GP genes Ube2c, Gata2, Sfrp5, and Sox9. E, UMAP plots of nodose glial cells for SG genes kcnj10, Fgfr1, Epas1, Srgn, Glul, and Cxcr4. iSG are shown with the dotted circles. F, UMAP plots of nodose glial cells for genes known to inhibit myelination: Ddit4 and Ptprz1. iSC are shown with the dotted circles. G, UMAP plots of nodose glial cells for genes expressed in cochlea SG that are expressed in MSC: Arhgap19, Fxyd6, Fa2h, and Gldn. iSC are shown with the dotted circle. H, UMAP plots of nodose glial cells for MSC genes Mpz and Prx. iSC are shown with the dotted circles. I, UMAP plots of nodose glial cells for NMSC genes L1cam and ngfr. iSC are shown with the dotted circles. J, A UMAP plot of nodose glial cells, with each subtype labeled in a different color. Dotted circles show iSC (left) and iSG (right), with marker genes listed.

Similar articles

Cited by

References

    1. Abe T, Kiyonari H, Shioi G, Inoue K-I, Nakao K, Aizawa S, Fujimori T (2011) Establishment of conditional reporter mouse lines at ROSA26 locus for live cell imaging. Genesis 49:579–590. 10.1002/dvg.20753 - DOI - PubMed
    1. Adameyko I, et al. (2012) Sox2 and Mitf cross-regulatory interactions consolidate progenitor and melanocyte lineages in the cranial neural crest. Development 139:397–410. 10.1242/dev.065581 - DOI - PMC - PubMed
    1. Avraham O, Chamessian A, Feng R, Yang L, Halevi AE, Moore AM, Gereau RW, Cavalli V (2022) Profiling the molecular signature of satellite glial cells at the single cell level reveals high similarities between rodents and humans. Pain 163:2348–2364. 10.1097/j.pain.0000000000002628 - DOI - PMC - PubMed
    1. Avraham O, Deng P-Y, Jones S, Kuruvilla R, Semenkovich CF, Klyachko VA, Cavalli V (2020) Satellite glial cells promote regenerative growth in sensory neurons. Nat Commun 11:4891. 10.1038/s41467-020-18642-y - DOI - PMC - PubMed
    1. Ayer-Le Lievre CS, Le Douarin NM (1982) The early development of cranial sensory ganglia and the potentialities of their component cells studied in quail-chick chimeras. Dev BIiol 94:291–310. 10.1016/0012-1606(82)90349-9 - DOI - PubMed

LinkOut - more resources