. 2024 Jul 3;44(27):e2334232024.
doi: 10.1523/JNEUROSCI.2334-23.2024.

Rab6-Mediated Polarized Transport of Synaptic Vesicle Precursors Is Essential for the Establishment of Neuronal Polarity and Brain Formation

Affiliations

Rab6-Mediated Polarized Transport of Synaptic Vesicle Precursors Is Essential for the Establishment of Neuronal Polarity and Brain Formation

Yu Zhang et al. J Neurosci. .

Abstract

Neurons are highly polarized cells that are composed of a single axon and multiple dendrites. Axon-dendrite polarity is essential for proper tissue formation and brain functions. Intracellular protein transport plays an important role in the establishment of neuronal polarity. However, the regulatory mechanism of polarized transport remains unclear. Here, we show that Rab6, a small GTPase that acts on the regulation of intracellular vesicular trafficking, plays key roles in neuronal polarization and brain development. Central nervous system-specific Rab6a/b double knock-out (Rab6 DKO) mice of both sexes exhibit severe dysplasia of the neocortex and the cerebellum. In the Rab6 DKO neocortex, impaired axonal extension of neurons results in hypoplasia of the intermediate zone. In vitro, deletion of Rab6a and Rab6b in cultured neurons from both sexes causes the abnormal accumulation of synaptic vesicle precursors (SVPs) adjacent to the Golgi apparatus, which leads to defects in axonal extension and the loss of axon-dendrite polarity. Moreover, Rab6 DKO causes significant expansion of lysosomes in the soma in neurons. Overall, our results reveal that Rab6-mediated polarized transport of SVPs is crucial for neuronal polarization and subsequent brain formation.

Keywords: Golgi apparatus; Rab6; cell polarity; knock-out mouse; synaptic vesicle.


Conflict of interest statement

The authors declare no competing financial interests.

Figures
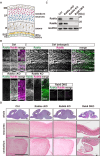
Figure 1.
Figure 1.
Rab6 DKO mice exhibit severe dysplasia of the cerebral cortex and the cerebellum. A, Schematic illustration of the laminar organization of the E18.5 neocortex, showing the location of RGCs, IPCs, axons, and newborn neurons. VZ, ventricular zone; SVZ, subventricular zone; IZ, intermediate zone; CP, cortical plate; MZ, marginal zone; RGC, radial glial cell; IPC, intermediate progenitor cell. B, Representative images showing the expression of Rab6a and Rab6b in E18.5 cerebral cortices of the indicated genotypes. The area between the two white dashed lines indicates the Rab6 DKO neocortex. Scale bars, 50 µm. C, Western blot analysis of Rab6a and Rab6b expression in the E18.5 brains of the indicated genotypes. GAPDH was used as a loading control. D, Representative images of H&E staining of E18.5 sagittal brain sections of the indicated genotypes. The bottom panels show magnified images of the boxes surrounded by dashed lines in the top panels. Scale bars, 500 µm.
Figure 2.
Figure 2.
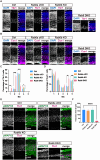
Rab6 DKO causes ectopic NPCs. A, Schematic illustration of the laminar organization of the E18.5 neocortex, showing the expression domains for Pax6-positive (green), Tbr2-positive (yellow), Tbr1-positive (blue), and Cux1-positive (red) cells. VZ, ventricular zone; SVZ, subventricular zone; IZ, intermediate zone; CP, cortical plate; MZ, marginal zone. B, C, Representative images of Pax6 (magenta in B) or Tbr2 (magenta in C) staining in coronal sections of E18.5 cortices of the indicated genotypes. Nuclei were stained with DAPI (blue). Arrows in Rab6 DKO panels indicate ectopic NPCs. Scale bars, 50 µm. D, E, Quantification of the distribution of Pax6-positive (D) or Tbr2-positive (E) cells in E18.5 cerebral cortices (n = 3 sections from 3 brains per genotype, **p = 0.0039, *p = 0.0252, one-way ANOVA with Tukey's multiple-comparisons test). F, Representative images of cleaved caspase 3 (CC3) (magenta) staining in coronal sections of E18.5 cortices of the indicated genotypes. Nuclei were stained with DAPI (blue). Arrows in Rab6 DKO panels indicate CC3-positive cells. Scale bar, 50 µm. G, Quantification of the percentage of CC3 positive cells in E18.5 cerebral cortices (n = 3 sections from 3 brains per genotype, **p = 0.0018, one-way ANOVA with Tukey's multiple-comparisons test). Values are represented as the mean ± SD. *p < 0.05; **p < 0.01. Ctrl, control.
Figure 3.
Figure 3.
The Rab6 DKO neocortex exhibits impaired IZ formation. A, B, Representative images of Tbr1 (magenta in A) or Cux1 (magenta in B) staining in coronal sections of E18.5 cortices of the indicated genotypes. Nuclei were stained with DAPI (blue). Scale bars, 50 µm. C, Quantification of the distribution of Tbr1-positive neurons in E18.5 cerebral cortices (n = 3 sections from 3 brains per genotype, **p = 0.0012 Bin 1, ****p < 0.0001 Bin 2, ****p < 0.0001 Bin 3, *p = 0.014 Bin 4, one-way ANOVA with Tukey's multiple comparison test). D, Quantification of the distribution of Cux1-positive neurons in E18.5 cerebral cortices (n = 3 sections from 3 brains per genotype, **p = 0.0011 Bin 4, ***p = 0.0001 Bin 5, one-way ANOVA with Tukey's multiple-comparisons test). E, Representative images of pMAP1B (green) staining in coronal sections of E18.5 cortices of the indicated genotypes. Deep layer neurons were stained with Tbr1 (magenta) antibody. Scale bar, 50 µm. F, Quantification of the thickness of the IZ of E18.5 cerebral cortices (n = 3 sections from 3 brains per genotype, ****p < 0.0001, one-way ANOVA with Tukey's multiple-comparisons test). Values are represented as the mean ± SD. *p < 0.05; **p < 0.01; ***p < 0.001; ****p < 0.0001. Ctrl, control.
Figure 4.
Figure 4.
Rab6 DKO results in decreased axonal extension. A, Representative images of Tuj1, Rab6a, and Rab6b staining in primary cortical neurons of the indicated genotypes at 72 h after adenovirus infection. Arrows indicate localization in the perinuclear region. Arrowheads indicate punctate structures in the axons. Scale bar, 50 µm. B, Representative images of the subcellular distribution of Rab6a and Rab6b in the soma of primary cortical neurons of the indicated genotypes at 72 h after adenovirus infection. The Golgi apparatus was stained with GM130 antibody. Scale bar, 5 µm. C, Quantification of colocalization coefficients between Rab6 and GM130 in neurons (****p < 0.0001, **p = 0.0078, one-way ANOVA with Tukey's multiple-comparisons test). D, Western blot analysis of Rab6a and Rab6b expression in primary cortical neurons of the indicated genotypes. β-Actin was used as a loading control. E, Quantification of the percentage of stage III neurons among cultured cortical neurons at 24, 48, and 72 h after adenovirus infection (**p = 0.0026, one-way ANOVA with Tukey's multiple-comparisons test). F, Quantification of the length of the longest neurite of cultured cortical neurons at 24, 48, and 72 h after adenovirus infection (*p = 0.0162, one-way ANOVA with Tukey's multiple-comparisons test). G, Quantification of the average length of minor neurites of cultured cortical neurons at 24, 48, and 72 h after adenovirus infection (***p = 0.0003, one-way ANOVA with Tukey's multiple-comparisons test). H, Quantification of the number of total neurites in cultured cortical neurons at 24, 48, and 72 h after adenovirus infection (one-way ANOVA with Tukey's multiple-comparisons test). Values are represented as the mean ± SD. *p < 0.05; **p < 0.01; ***p < 0.001; p < 0.0001; ns, not statistically significant. Ctrl, control.
Figure 5.
Figure 5.
Rab6 DKO neurons lose their axon–dendrite polarity. A, Representative images of pMAP1B (green) staining in primary cortical neurons of the indicated genotypes at 72 h after adenovirus infection. Neurites were labeled with rhodamine-phalloidin (magenta). Arrows indicate pMAP1B-positive neurites. Scale bar, 50 µm. B, Quantification of the percentage of neurons with multiple pMAP1B-positive neurites at 72 h after adenovirus infection. The data were collected from four independent experiments (****p < 0.0001, one-way ANOVA with Tukey's multiple-comparisons test). C, Representative images of Shootin1 (green) staining in primary cortical neurons of the indicated genotypes at 72 h after adenovirus infection. Neurites were labeled with rhodamine-phalloidin (magenta). Arrows indicate Shootin1 accumulation in neurite tips. Scale bar, 50 µm. D, Quantification of the percentage of neurons with multiple Shootin1-positive tips of neurites at 72 h after adenovirus infection. The data were collected from three independent experiments (****p < 0.0001, one-way ANOVA with Tukey's multiple-comparisons test). Values are represented as the mean ± SD. ****p < 0.0001. Ctrl, control.
Figure 6.
Figure 6.
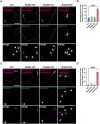
Rab6 DKO leads to the accumulation of synaptic vesicle precursors in the perinuclear region. A, B, Representative images of IGF1R (A) and chromogranin B (CHGB; B) staining in the soma (top panels) and the longest neurite (bottom panels) of primary cortical neurons of the indicated genotypes at 72 h after adenovirus infection. Scale bars, 5 µm. C, D, Representative images of Synaptotagmin1 (Syt1; green in C) or Synaptophysin1 (Syph; green in D) staining in the soma (top panels) and the longest neurite (bottom panels) of primary cortical neurons of the indicated genotypes at 72 h after adenovirus infection. The Golgi apparatus (arrows) were stained with Golgin97 (magenta) antibody. Scale bar, 5 µm. E–H, Quantifications of the distribution of Syt1 (E, F) or Syph (G, H) in the longest neurite (E, G) and the colocalization coefficients with Golgin97 (F, H) in neurons (*p = 0.0266, one-way ANOVA with Tukey's multiple-comparisons test). Values are represented as the mean ± SD. *p < 0.05; ns, not statistically significant. Ctrl, control.
Figure 7.
Figure 7.
The accumulated synaptic vesicle precursors are located at the Golgi area in Rab6 DKO neurons. A, Western blot analysis of Syt1 and Syph in DIV3 neurons of the indicated genotypes. β-Actin was used as a loading control. B, C, Representative images of EGFP-tagged Syt1 signals (green) and Golgin97 (magenta) staining in the soma (B) and the longest neurite (C) in control and Rab6 DKO neurons at 0, 15, 30, 45, 60, and 120 min after biotin treatment. B, The soma area were surrounded by white dashed lines. C, The neurites were surrounded by black dashed lines. EGFP-tagged Syt1 signals (black) are shown by arrows. Axon terminals were shown by magenta dashed lines. Scale bars, 5 µm. D, Representative images of immunoelectron micrographs showing the localization of Syph in the Golgi area and axon terminal of control and Rab6 DKO neurons. Yellow arrows in Rab6 DKO panel indicate accumulated Syph adjacent to the Golgi. Scale bar, 500 nm.
Figure 8.
Figure 8.
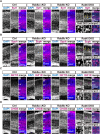
Rab6 DKO causes the accumulation of synaptic vesicle precursors in neuronal soma in vivo. A–D, Representative images of Syt1 (magenta in A), Syph (magenta in B), IGF1R (magenta in C), or CHGB (magenta in D) in coronal sections of E18.5 cortices of the indicated genotypes. Nuclei were stained with DAPI (blue). Yellow arrows in Rab6 DKO panels indicate strongly stained neuronal soma. Bottom panels of Rab6 DKO show magnified images of the boxes surrounded by magenta dashed lines in the top panels. Scale bars, 50 µm.
Figure 9.
Figure 9.
Rab6 does not colocalize with synaptic vesicle proteins in axon shafts. A–D, Representative images of Rab6a (A, C) or Rab6b (B, D) and Syt1 (A, B) or Syph (C, D) staining in the soma (middle panels) and the axons (bottom panels) of wild-type cortical neurons (top panels) at 72 h after plating. Rhodamine-phalloidin was used to show neuronal morphology. Scale bars, 10 µm. E, Quantification of colocalization coefficients between Rab6 and SVP markers in the soma and the axon in control neurons (****p < 0.0001, one-way ANOVA with Tukey's multiple-comparisons test). F, Representative images of interaction between Rab6a and SVP markers determined by PLA. PIST, and Tom20 were used as positive and negative control, respectively. Nuclei were stained with DAPI (blue). Arrows show the PLA signals in neurites. The bottom left insets show magnified images of the boxes surrounded by dashed lines. Arrowheads in magenta show the PLA signals (magenta) in the insets. Scale bar, 2 µm. Values are represented as the mean ± SD. ****p < 0.0001.
Figure 10.
Figure 10.
Rab6 partially colocalizes with TrkB in the axons. A, Representative images of KIF1A (green) and Syt1 (magenta) staining in the longest neurite of control and Rab6 DKO neurons. Arrows show overlapped signals. Scale bar, 5 µm. B, Quantification of colocalization coefficients between Syt1 and KIF1A in the longest neurite of control and Rab6 DKO neurons (*p = 0.0488, unpaired t test). C, Representative images of KIF1A (green) and Rab33a (magenta) staining in the control axons. Arrows show overlapped signals. Scale bar, 5 µm. D, Representative images of Rab6a or Rab6b (green) and TrkB (magenta) staining in the control axons. Arrows show overlapped signals. Scale bar, 5 µm. E, Representative images of TrkB staining in the soma and the longest neurite of control and Rab6 DKO neurons. Scale bar, 5 µm. F, G, Quantification of distributions of TrkB in the soma (F) or the longest neurite (G) of control and Rab6 DKO neurons (unpaired t test). Values are represented as the mean ± SD. *p < 0.05; ns, not statistically significant. Ctrl, control.
Figure 11.
Figure 11.
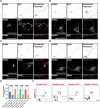
Rab6 DKO causes lysosomal enlargement and accumulation in the soma. A, B, Representative images of EEA1 (A) or CD71 (B) staining in the soma (top panels) and dendrites (bottom panels) of cortical neurons of the indicated genotypes at 72 h after adenovirus infection. Scale bars, 5 µm. C, Representative images of LAMP1 staining in the soma, the longest neurite, and a minor neurite of primary cortical neurons of the indicated genotypes at 72 h after adenovirus infection. Arrows show enlarged lysosomes in the soma of Rab6 DKO neurons. Scale bars, 5 µm. D–H, Quantifications of the distribution and the size of lysosomes in cortical neurons of indicated genotypes at 72 h after adenovirus infection (*p = 0.0213 in D, *p = 0.0232 in F, one-way ANOVA with Tukey's multiple-comparisons test for all). Values are represented as the mean ± SD. *p < 0.05; ns, not statistically significant. Ctrl, control.
Figure 12.
Figure 12.
Rab6 DKO causes the defect of lysosomal acidification in neurons. A, Representative images of lysosomal acidification visualized by Lysosomal Acidic pH Detection Kit in control and Rab6 DKO neurons. Bafilomycin A1 (Baf.A1) was used as a lysosomal inhibitor. The bottom right insets in the bottom panels show magnified images of the boxes surrounded by dashed lines. Scale bar, 5 µm. B, Western blot analysis of Cathepsin D in cortical neurons of the indicated genotypes at 72 h after adenovirus infection. GAPDH was used as a loading control. C, Representative images of Syt1 (green) and LAMP2 (magenta) staining in the soma of control and Rab6 DKO neurons in the presence or absence of bafilomycin A1. Scale bar, 5 µm. D, Representative images of EGFP-tagged Syt1 signals (green) and LAMP2 (magenta) staining in the soma of Rab6 DKO neurons at 60 and 120 min after biotin treatment. Scale bar, 5 µm.
Figure 13.
Figure 13.
A schematic model showing the function of Rab6 in SVP anterograde transport in neurons. WT, wild type; SVP, synaptic vesicle precursor.

Similar articles

Cited by

References

    1. Arimura N, et al. (2009) Anterograde transport of TrkB in axons is mediated by direct interaction with Slp1 and Rab27. Dev Cell 16:675–686. 10.1016/j.devcel.2009.03.005 - DOI - PubMed
    1. Arimura N, Kaibuchi K (2007) Neuronal polarity: from extracellular signals to intracellular mechanisms. Nat Rev Neurosci 8:194–205. 10.1038/nrn2056 - DOI - PubMed
    1. Avriyanti E, Atik N, Kunii M, Furumoto N, Iwano T, Yoshimura S, Harada R, Harada A (2015) Functional redundancy of protein kinase D1 and protein kinase D2 in neuronal polarity. Neurosci Res 95:12–20. 10.1016/j.neures.2015.01.007 - DOI - PubMed
    1. Barnes AP, Polleux F (2009) Establishment of axon-dendrite polarity in developing neurons. Annu Rev Neurosci 32:347–381. 10.1146/annurev.neuro.31.060407.125536 - DOI - PMC - PubMed
    1. Bentley M, Banker G (2016) The cellular mechanisms that maintain neuronal polarity. Nat Rev Neurosci 17:611–622. 10.1038/nrn.2016.100 - DOI - PubMed

LinkOut - more resources