Norepinephrine Drives Sleep Fragmentation Activation of Asparagine Endopeptidase, Locus Ceruleus Degeneration, and Hippocampal Amyloid-β42 Accumulation
- PMID: 38830763
- PMCID: PMC11236578
- DOI: 10.1523/JNEUROSCI.1929-23.2024
Norepinephrine Drives Sleep Fragmentation Activation of Asparagine Endopeptidase, Locus Ceruleus Degeneration, and Hippocampal Amyloid-β42 Accumulation
Abstract
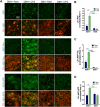
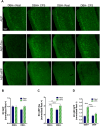
Chronic sleep disruption (CSD), from insufficient or fragmented sleep and is an important risk factor for Alzheimer's disease (AD). Underlying mechanisms are not understood. CSD in mice results in degeneration of locus ceruleus neurons (LCn) and CA1 hippocampal neurons and increases hippocampal amyloid-β42 (Aβ42), entorhinal cortex (EC) tau phosphorylation (p-tau), and glial reactivity. LCn injury is increasingly implicated in AD pathogenesis. CSD increases NE turnover in LCn, and LCn norepinephrine (NE) metabolism activates asparagine endopeptidase (AEP), an enzyme known to cleave amyloid precursor protein (APP) and tau into neurotoxic fragments. We hypothesized that CSD would activate LCn AEP in an NE-dependent manner to induce LCn and hippocampal injury. Here, we studied LCn, hippocampal, and EC responses to CSD in mice deficient in NE [dopamine β-hydroxylase (Dbh)-/-] and control male and female mice, using a model of chronic fragmentation of sleep (CFS). Sleep was equally fragmented in Dbh -/- and control male and female mice, yet only Dbh -/- mice conferred resistance to CFS loss of LCn, LCn p-tau, and LCn AEP upregulation and activation as evidenced by an increase in AEP-cleaved APP and tau fragments. Absence of NE also prevented a CFS increase in hippocampal AEP-APP and Aβ42 but did not prevent CFS-increased AEP-tau and p-tau in the EC. Collectively, this work demonstrates AEP activation by CFS, establishes key roles for NE in both CFS degeneration of LCn neurons and CFS promotion of forebrain Aβ accumulation, and, thereby, identifies a key molecular link between CSD and specific AD neural injuries.
Keywords: amyloid; hippocampus; locus ceruleus; norepinephrine; sleep deprivation; tau.
Copyright © 2024 Zhang et al.
Conflict of interest statement
The authors declare no competing financial interests.
Figures


Similar articles
-
Chronic Sleep Disruption Advances the Temporal Progression of Tauopathy in P301S Mutant Mice.J Neurosci. 2018 Nov 28;38(48):10255-10270. doi: 10.1523/JNEUROSCI.0275-18.2018. Epub 2018 Oct 15. J Neurosci. 2018. PMID: 30322903 Free PMC article.
-
Localization of endogenous amyloid-β to the coeruleo-cortical pathway: consequences of noradrenergic depletion.Brain Struct Funct. 2018 Jan;223(1):267-284. doi: 10.1007/s00429-017-1489-9. Epub 2017 Aug 4. Brain Struct Funct. 2018. PMID: 28779307 Free PMC article.
-
Comparisons of neuroinflammation, microglial activation, and degeneration of the locus coeruleus-norepinephrine system in APP/PS1 and aging mice.J Neuroinflammation. 2021 Jan 6;18(1):10. doi: 10.1186/s12974-020-02054-2. J Neuroinflammation. 2021. PMID: 33407625 Free PMC article.
-
Down but Not Out: The Consequences of Pretangle Tau in the Locus Coeruleus.Neural Plast. 2017;2017:7829507. doi: 10.1155/2017/7829507. Epub 2017 Sep 5. Neural Plast. 2017. PMID: 29038736 Free PMC article. Review.
-
Roles of tau pathology in the locus coeruleus (LC) in age-associated pathophysiology and Alzheimer's disease pathogenesis: Potential strategies to protect the LC against aging.Brain Res. 2019 Jan 1;1702:17-28. doi: 10.1016/j.brainres.2017.12.027. Epub 2017 Dec 21. Brain Res. 2019. PMID: 29274876 Review.
Cited by
-
A Focus on the Link Between Metal Dyshomeostasis, Norepinephrine, and Protein Aggregation.Antioxidants (Basel). 2025 Mar 15;14(3):347. doi: 10.3390/antiox14030347. Antioxidants (Basel). 2025. PMID: 40227404 Free PMC article. Review.
-
Cognitive Dysfunction in Myalgic Encephalomyelitis/Chronic Fatigue Syndrome-Aetiology and Potential Treatments.Int J Mol Sci. 2025 Feb 22;26(5):1896. doi: 10.3390/ijms26051896. Int J Mol Sci. 2025. PMID: 40076522 Free PMC article. Review.
-
Fading Blue: Exploring the Causes of Locus Coeruleus Damage Across the Lifespan.Antioxidants (Basel). 2025 Feb 22;14(3):255. doi: 10.3390/antiox14030255. Antioxidants (Basel). 2025. PMID: 40227216 Free PMC article. Review.
References
MeSH terms
Substances
Grants and funding
LinkOut - more resources
Full Text Sources
Molecular Biology Databases
Miscellaneous
