. 2024 Jul 17;44(29):e2347232024.
doi: 10.1523/JNEUROSCI.2347-23.2024.

Neutral or Detrimental Effects of TREM2 Agonist Antibodies in Preclinical Models of Alzheimer's Disease and Multiple Sclerosis

Affiliations

Neutral or Detrimental Effects of TREM2 Agonist Antibodies in Preclinical Models of Alzheimer's Disease and Multiple Sclerosis

Ainhoa Etxeberria et al. J Neurosci. .

Abstract

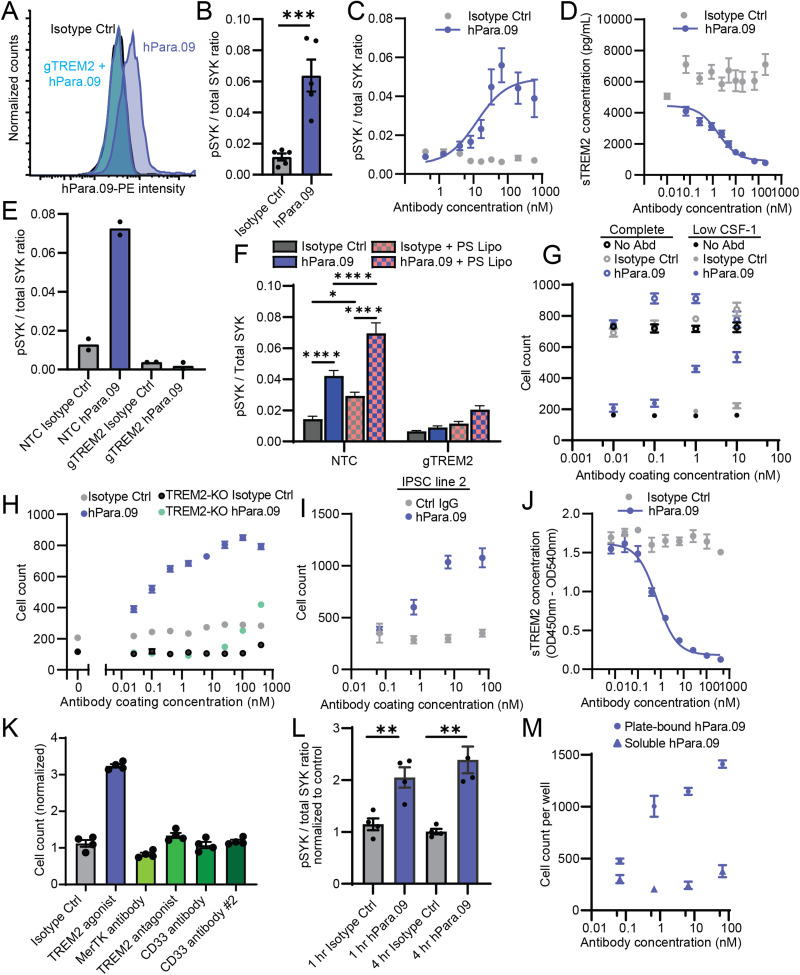
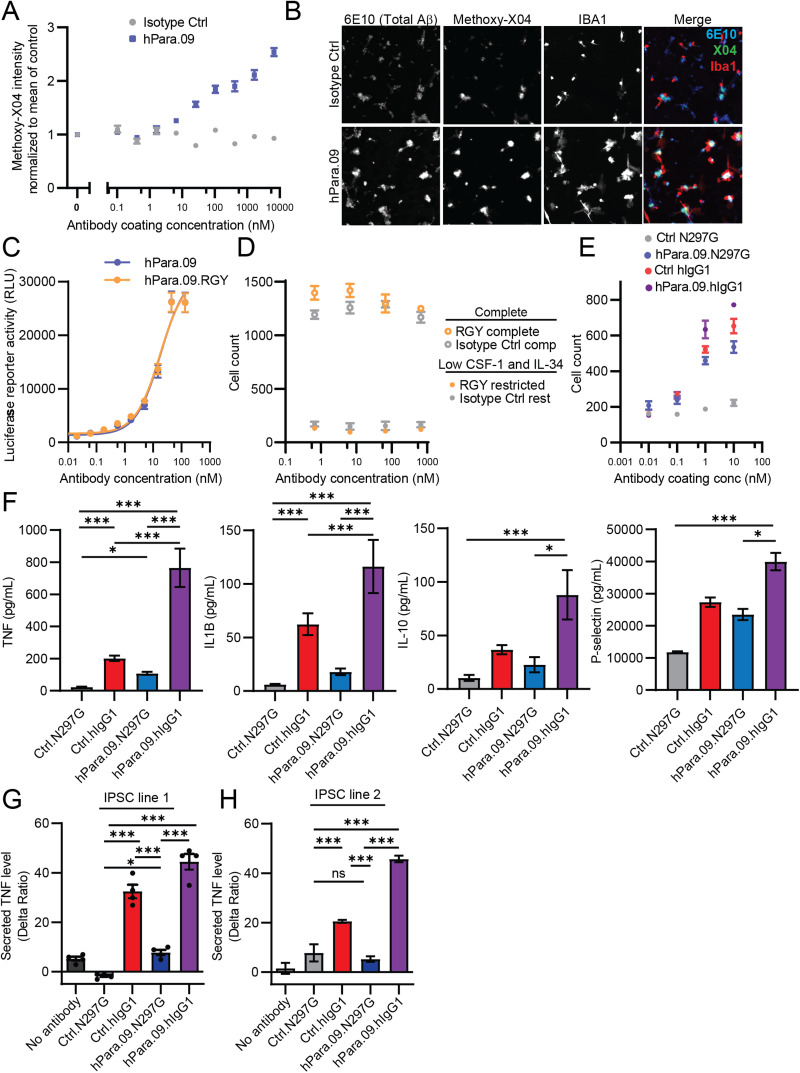
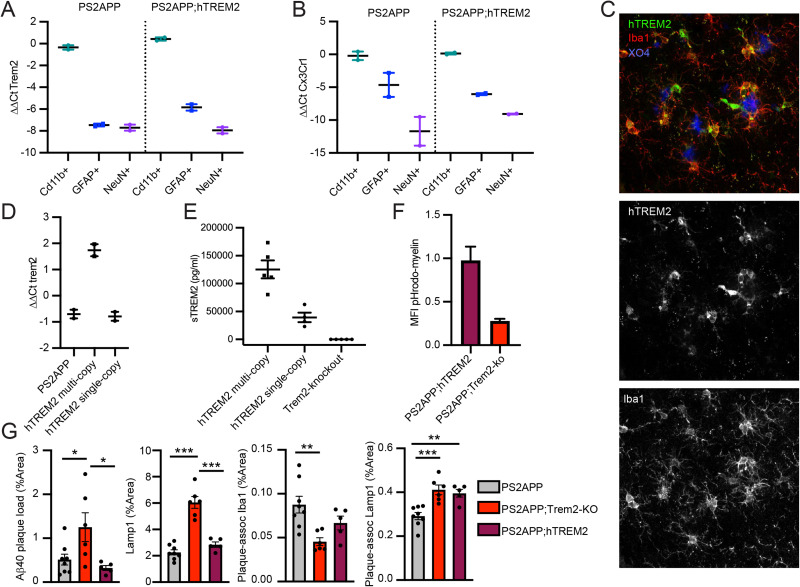
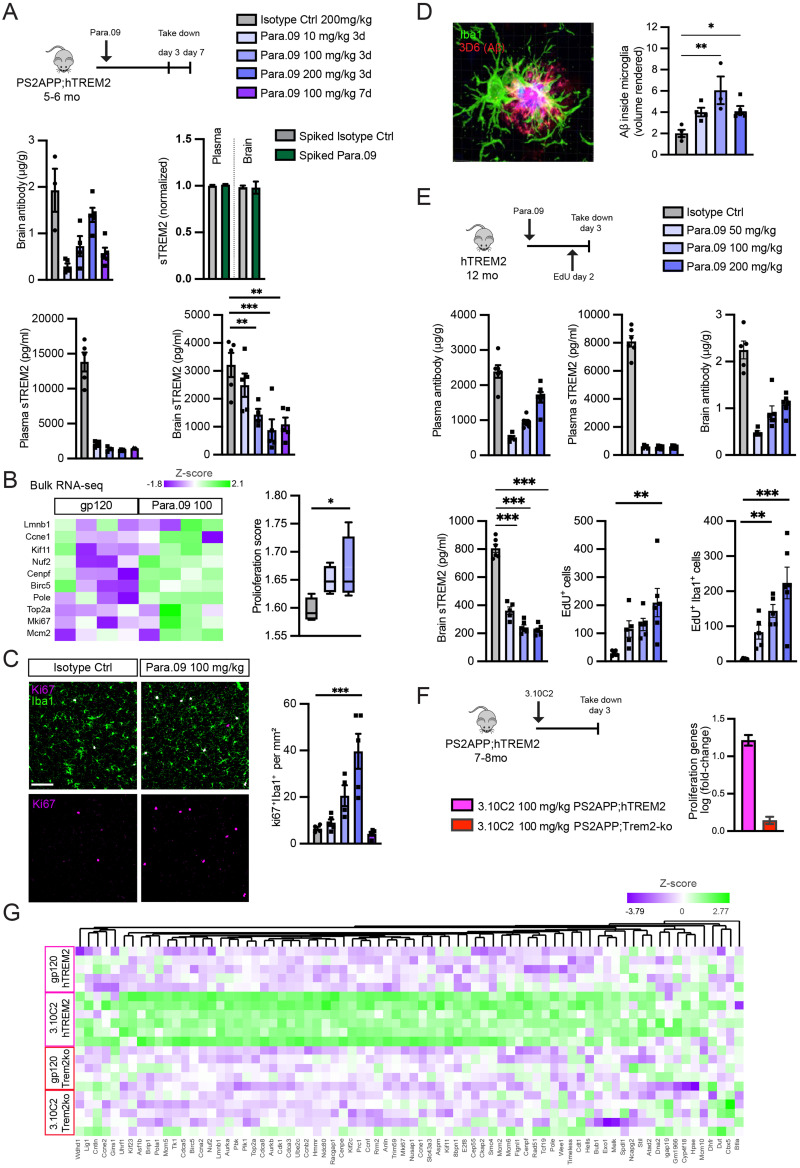
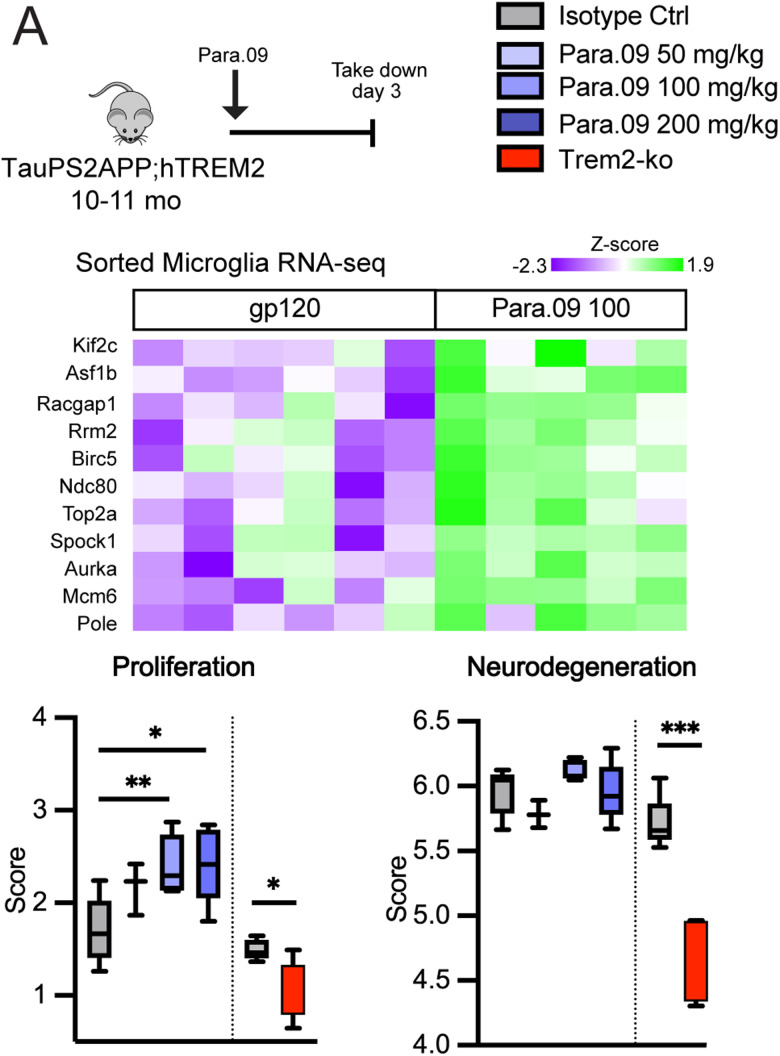
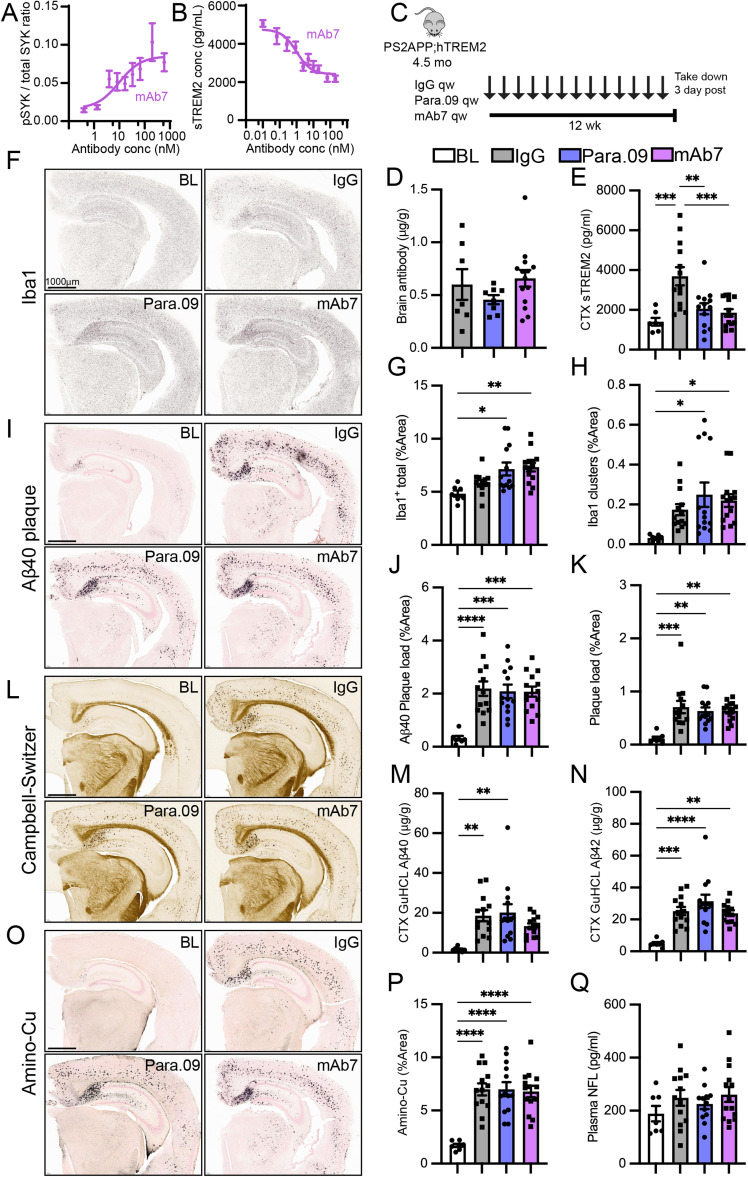
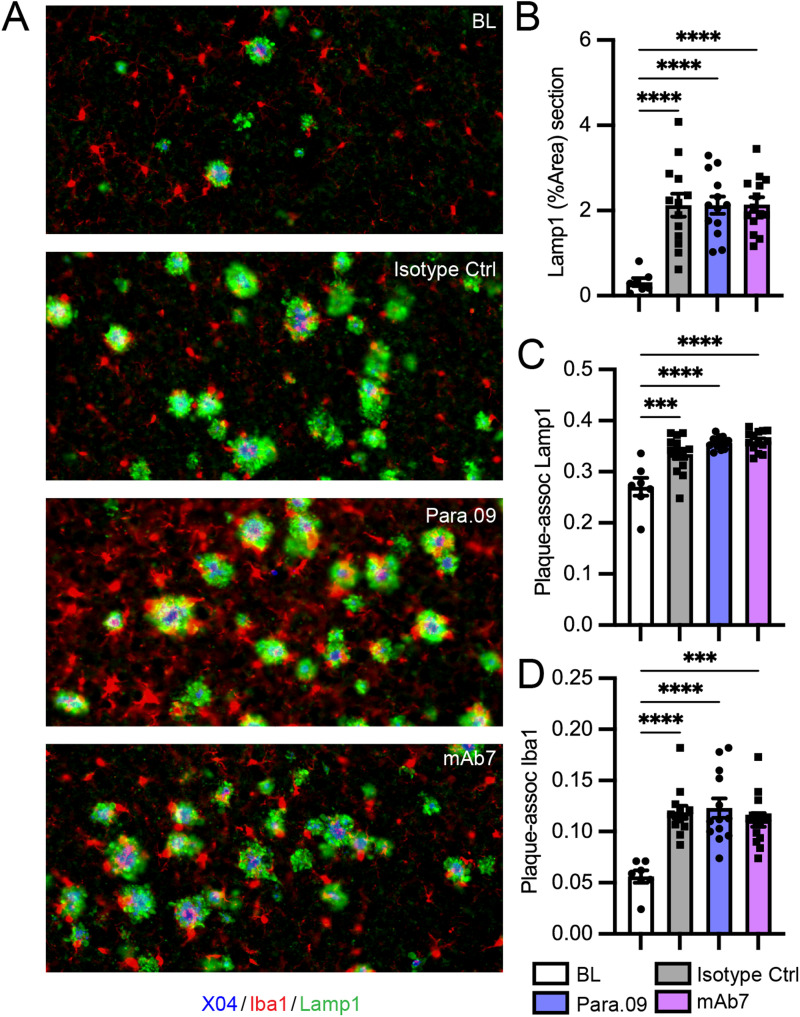
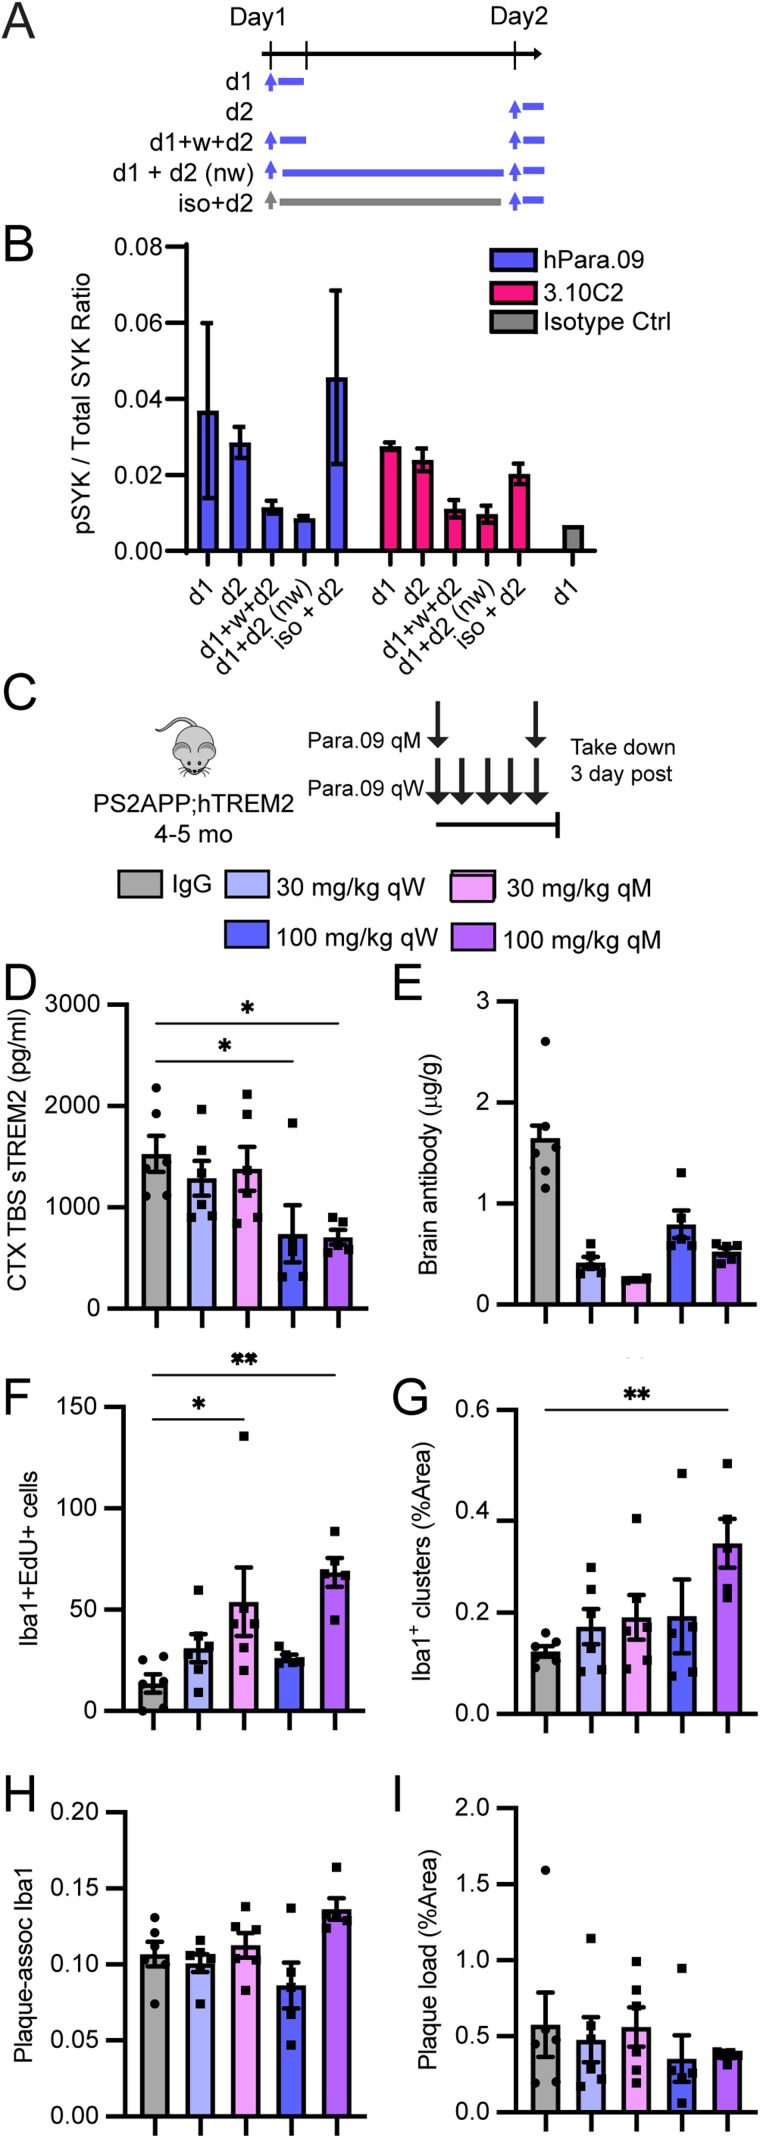
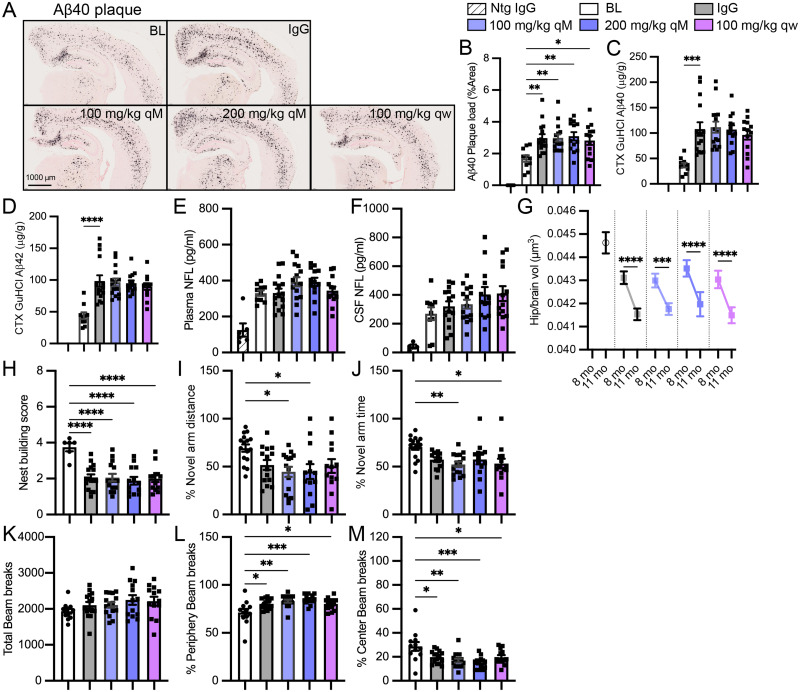
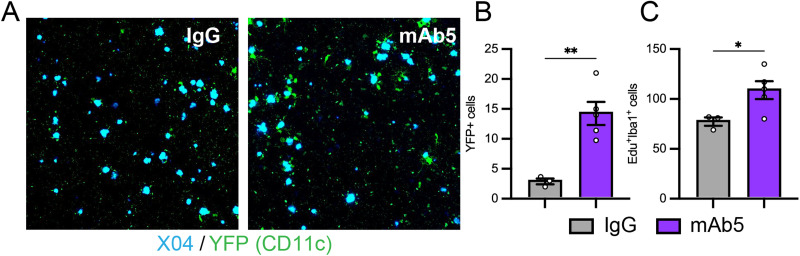
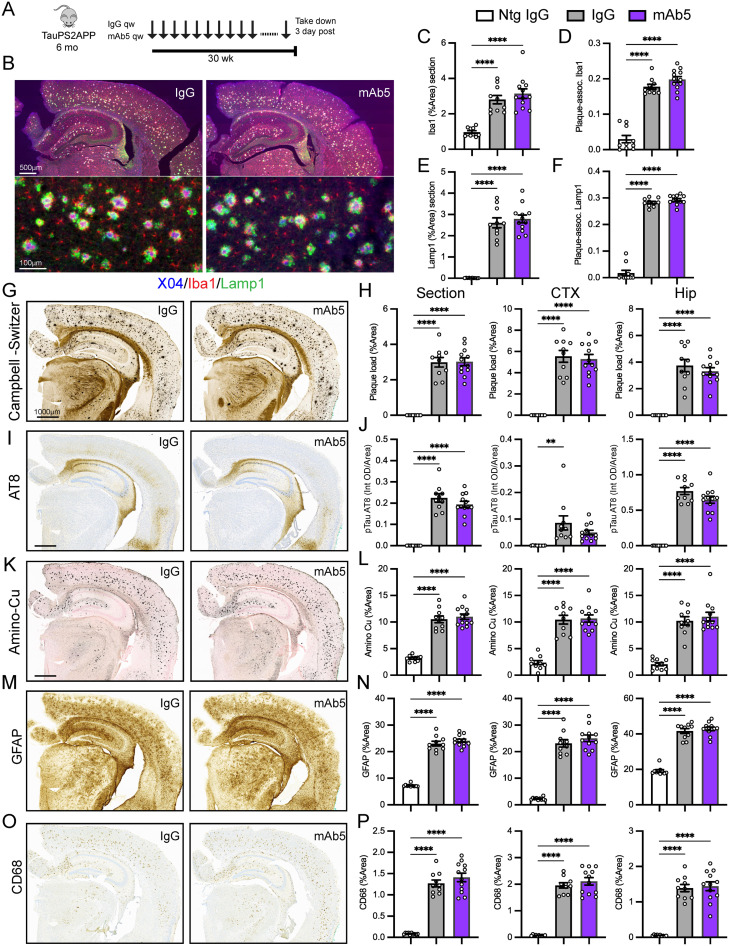
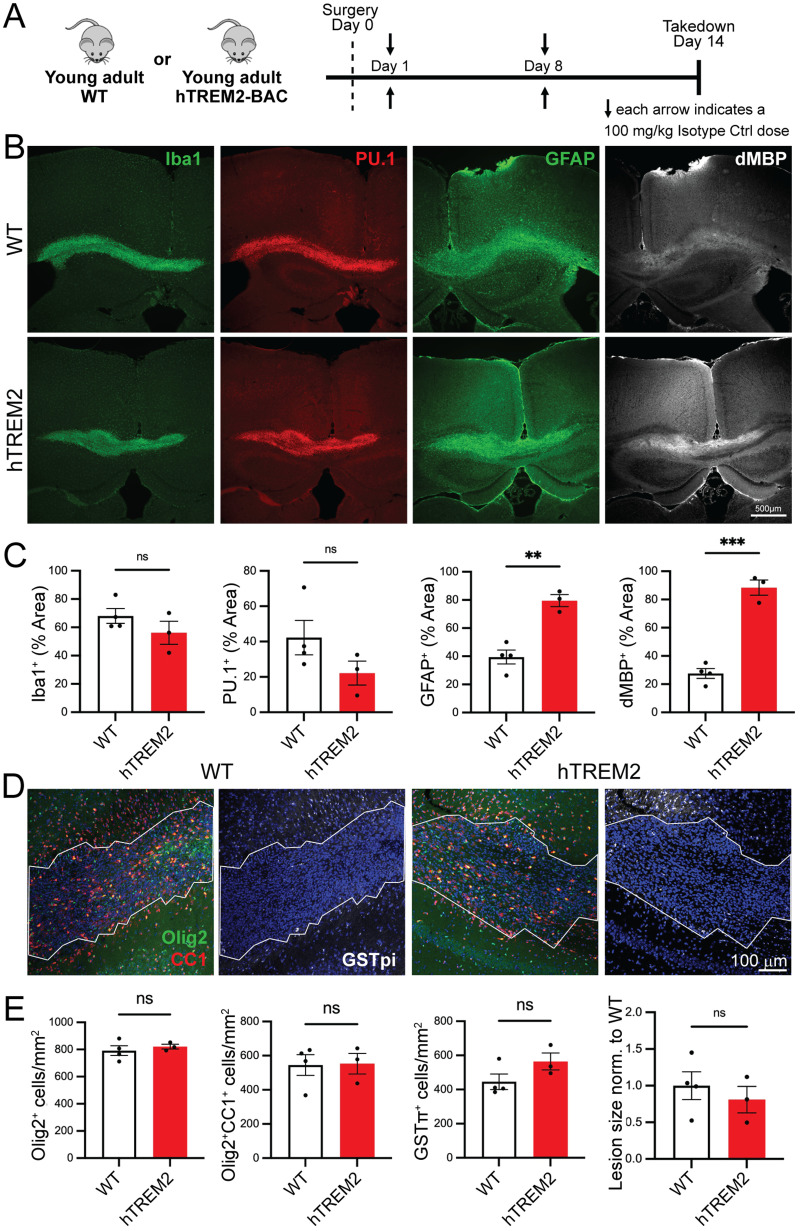
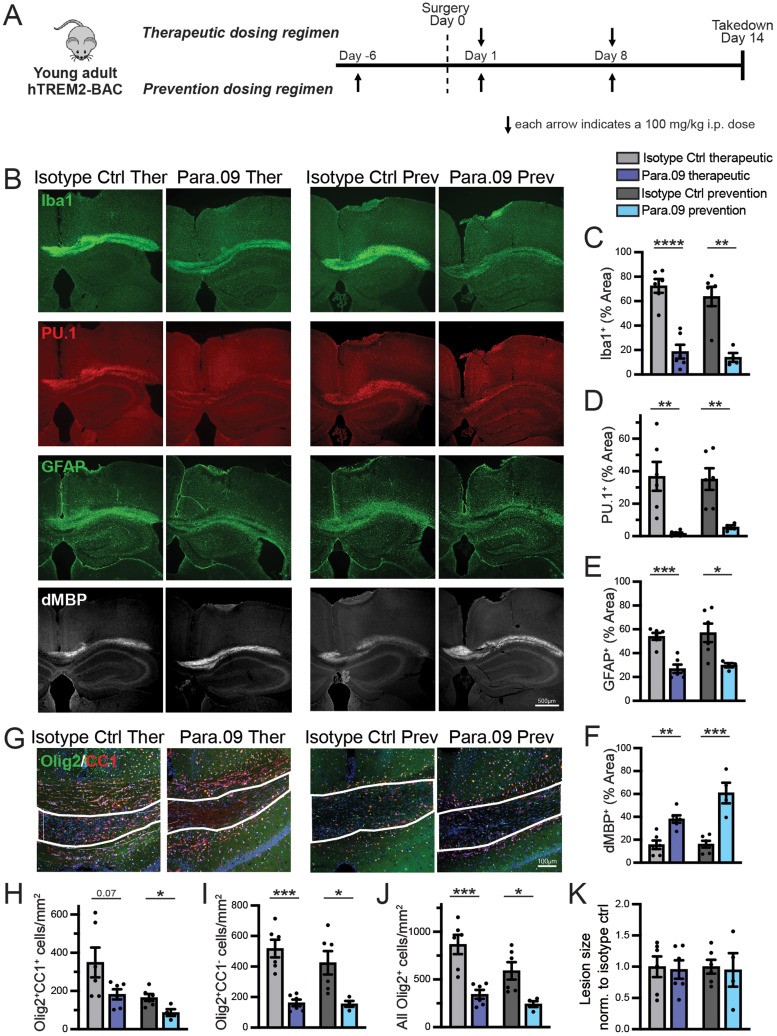
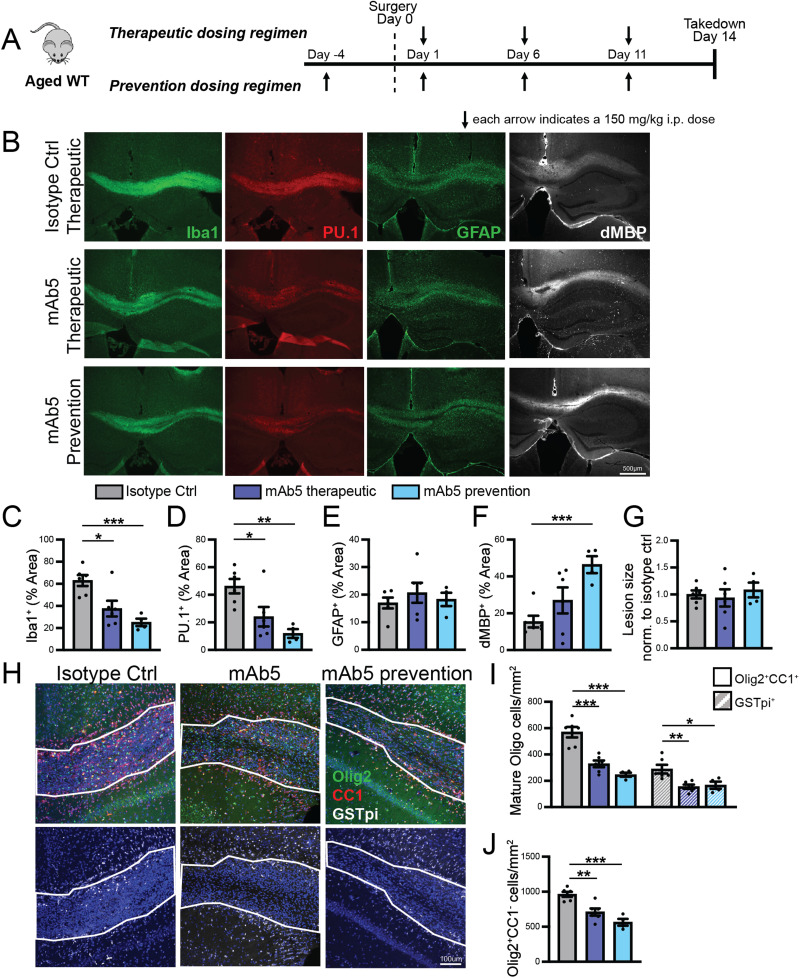
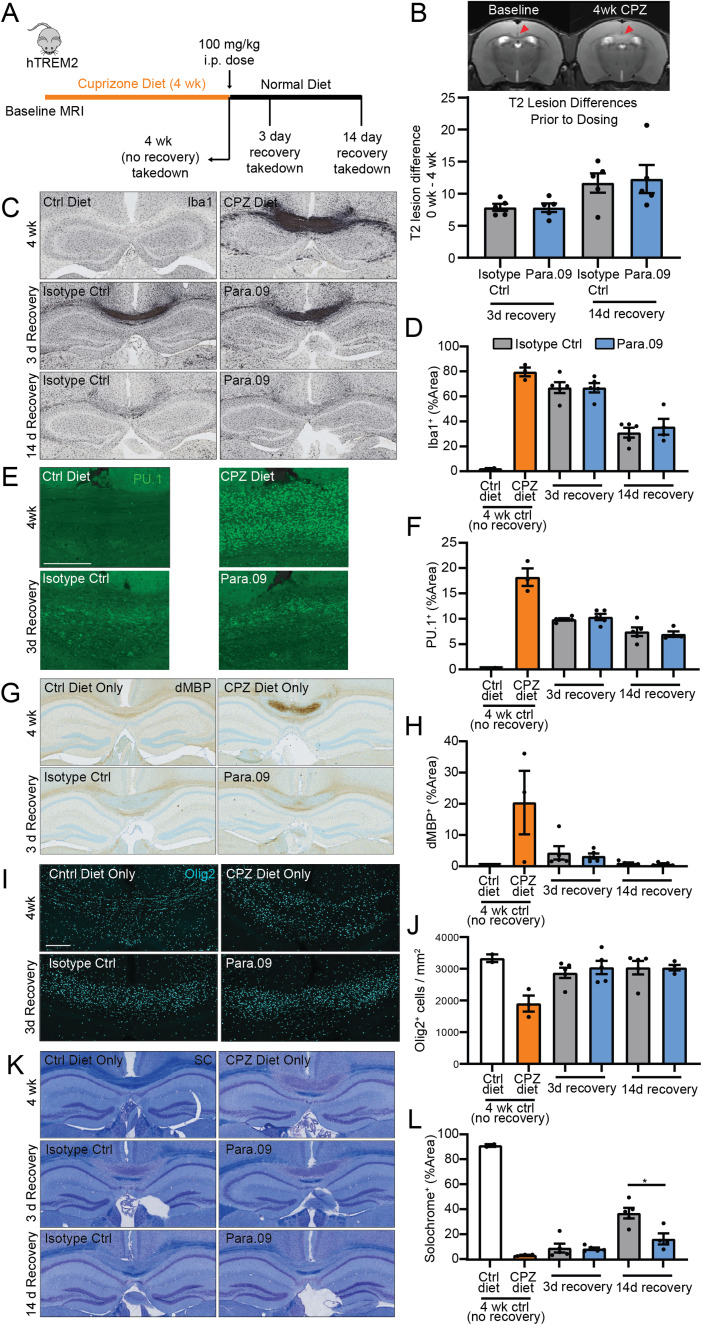
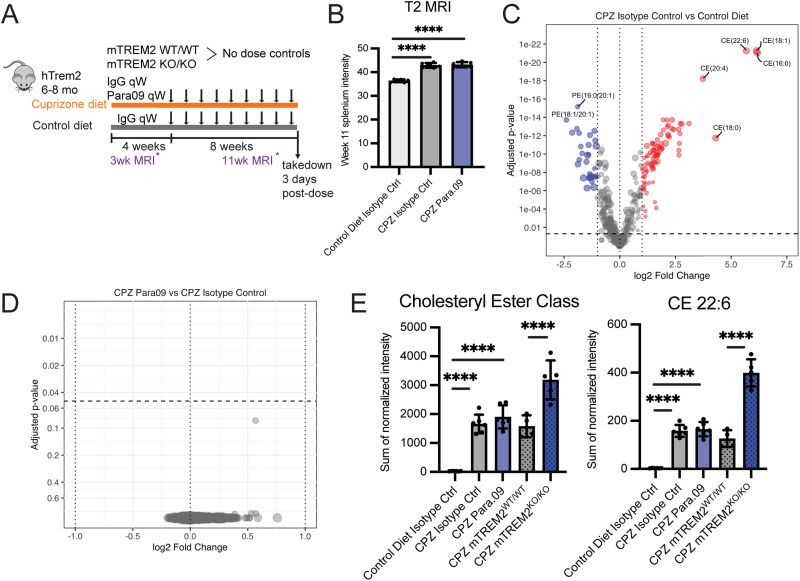
Human genetics and preclinical studies have identified key contributions of TREM2 to several neurodegenerative conditions, inspiring efforts to modulate TREM2 therapeutically. Here, we characterize the activities of three TREM2 agonist antibodies in multiple mixed-sex mouse models of Alzheimer's disease (AD) pathology and remyelination. Receptor activation and downstream signaling are explored in vitro, and active dose ranges are determined in vivo based on pharmacodynamic responses from microglia. For mice bearing amyloid-β (Aβ) pathology (PS2APP) or combined Aβ and tau pathology (TauPS2APP), chronic TREM2 agonist antibody treatment had limited impact on microglia engagement with pathology, overall pathology burden, or downstream neuronal damage. For mice with demyelinating injuries triggered acutely with lysolecithin, TREM2 agonist antibodies unexpectedly disrupted injury resolution. Likewise, TREM2 agonist antibodies limited myelin recovery for mice experiencing chronic demyelination from cuprizone. We highlight the contributions of dose timing and frequency across models. These results introduce important considerations for future TREM2-targeting approaches.

Keywords: Alzheimer’s disease; TREM2; antibody; microglia; multiple sclerosis; myelin repair.


Conflict of interest statement

The authors declare no competing financial interests.

Figures

Figure 1.
Figure 1.
In vitro signaling and survival activity of TREM2 agonist antibody hPara.09. A, Flow cytometry histograms showing surface staining of hMDMs with PE-conjugated Para.09 or isotype control (hIgG1.N297G) antibody. Cells were treated with Cas9 and TREM2-targeting guide RNA (gTREM2, aqua trace) or control guide RNA. B, SYK phosphorylation in hMDM lysate 20 min after soluble antibody treatment (15 nM). C, hMDM pSYK dose–response. D, sTREM2 in hMDM supernatant 48 h after soluble antibody treatment. E, hMDM SYK phosphorylation from antibody treatment in cells treated with Cas9 and TREM2-targeting guide RNA (gTREM2) or nontargeting control guide RNA (NTC). F, hMDM SYK phosphorylation in response to soluble antibody, phosphatidylserine-containing liposomes, or their combination. Cells were treated with Cas9 and nontargeting control guide RNA (NTC) or TREM2-targeting guide RNA (gTREM2). G, IPSC-MG survival 72 h after plating onto antibody-coated plates in complete medium (open circles) or growth factor–restricted medium (closed circles) comparing antibody treatment conditions. H, IPSC-MG survival 72 h after plating onto antibody-coated plates in growth factor–restricted medium comparing WT IPSC-MG to IPSC-MG lacking TREM2 (TREM2-KO). I, Same as in H using microglia derived from a separate IPSC line (WC30). J, IPSC-MG sTREM2 in supernatant 48 h after soluble antibody treatment. K, IPSC-MG survival 72 h after plating onto TREM2 agonist, TREM2 antagonist, or other surface receptor antibodies. L, IPSC-MG SYK phosphorylation at 1 or 4 h after plating onto antibody-coated plates. Responses are normalized to the isotype control average at each time point. M, IPSC-MG survival 72 h after plating onto hPara.09-coated plates (circles) or treatment with soluble hPara.09 (triangles) in growth factor–restricted medium. Points represent mean ± SEM. In B–E, 2–6 biological replicates (2–6 separate donors) with each point reporting the average of 2–3 technical replicates per donor and combined from at least two independent experiments. In F–M, four technical replicates are representative of at least two independent experiments.*p < 0.05, ***p < 0.001 unpaired t test in B and L, or one-way ANOVA with Tukey's test in F. The lines in C, D, and J indicate Hill equation fits with the slope fixed at 1.
Figure 2.
Figure 2.
In vitro plaque and cytokine activity of TREM2 agonist antibody hPara.09. A, IPSC-MG compaction of Aβ oligomers 48 h after plating onto antibody-coated plates in growth factor–restricted medium, quantified using methoxy-X04 staining intensity. Total methoxy-X04 intensity was normalized to a no antibody control. B, Representative images of IPSC-MG (Iba1) relationship with total Aβ (6E10 antibody stain) or compact Aβ (methoxy-X04 stain). C, Jurkat cell NFAT luciferase responses to soluble hPara.09 or hexamerization-promoting variant hPara.09.RGY. D, IPSC-MG survival 72 h after treatment with soluble antibody in complete medium (open circles) or growth factor–restricted medium (closed circles) comparing hPara.09.hIgG1.RGY (RGY) to gp120.hIgG1.RGY (Isotype Ctrl). E–G, IPSC-MG survival at 72 h (E), cytokine release into supernatants at 24 h measured by Luminex (F), or TNF release into supernatants at 24 h measured by HTRF assay (G) after addition to plates coated with full-effector (hIgG1) or reduced-effector (N297G) antibodies. H, IPSC-MG TNF release measured by HTRF assay from an independent IPSC line (WC30). *p < 0.05, **p < 0.01, ***p < 0.001 one-way ANOVA with Tukey's test. Points represent mean ± SEM. Three to six technical replicates, representative of at least two independent experiments. The line in H indicates Hill equation fit with the slope fixed at 1.
Figure 3.
Figure 3.
Characterization of hTREM2 transgenic mice. A, RT-PCR quantification illustrates enrichment of mouse Trem2 (left) or human TREM2 (right) gene expression in Cd11b+ (microglia-enriched) over GFAP+ (astrocyte-enriched) or NeuN+ (neuron-enriched) FACS-sorted fixed cell fractions from PS2APP or PS2APP;hTREM2 mice. B, RT-PCR quantification of a separate microglial marker, Cx3cr1, illustrating relative enrichment across sorted populations. C, Staining of human TREM2 (green) colocalizes with plaque (methoxy-X04)-associated microglia (Iba1; cortex). D, RT-PCR quantification of murine Trem2 or human TREM2 expression in single-copy versus multicopy PS2APP (4–5 months old) BAC transgenic mouse lines from Cd11b+ (microglia) FACS-sorted live cell fraction. Single-copy hTREM2 mice approximate normal mouse TREM2 expression. E, ELISA quantification of plasma sTREM2 illustrating levels in TREM2 knock-out mice and single versus multicopy PS2APP;hTREM2 transgenic lines. F, Phagocytosis assay using primary microglia from PS2APP;hTREM2 mice shows elevated phagocytosis of pHrodo-labeled myelin relative to cells from PS2APP;Trem2 knock-out mice. G, Quantification of percentage area coverage from histological stains across coronal brain sections or within a 15 µm region dilated around the plaque. Plaque load (Aβ40), neuritic dystrophy (Lamp1), plaque-associated microglia (Iba1), or plaque-associated neuritic dystrophy (Lamp1) all show changes with Trem2 knock-out and partial rescue by the introduction of the hTREM2 transgene. Bars represent mean ± SEM; points are individual animals. One-way ANOVA was performed followed by Tukey's test. *p < 0.05, **p < 0.01, ***p < 0.001.
Figure 4.
Figure 4.
In vivo responses to a single dose of Para.09. A, Response of PS2APP;hTREM2 mice 3 d after a single dose of Para.09 (10, 100, or 200 mg/kg) versus isotype control antibody (200 mg/kg) or 7 d after Para.09 (100 mg/kg). Concentration of dosed antibodies in brain homogenate (cerebellum), sTREM2 in plasma, and sTREM2 in brain homogenate (cortex) soluble fraction. Para.09 did not interfere with the sTREM2 detection assay, as spiking Para.09 into plasma or brain homogenate before measurement did not change values. B, Upregulation of proliferation markers after Para.09 dosing by bulk brain (hippocampus) RNA-seq. Expression of individual genes (left) or averaged expression score across the set of proliferation-associated markers (right). C, Representative images (left) and quantification (right) of microglial proliferation scored as Ki67 nuclear stain overlap with Iba1 (cortex). D, Representative image (left) and quantification (right) of microglia (Iba1) and Aβ (3D6) double-positive volume from confocal z-stacked images. E, Single-dose study in hTREM2 mice lacking AD pathology. EdU was dosed 18 h prior to takedown (50 mg/kg). Plasma antibody or sTREM2 concentrations, brain antibody (cerebellum), brain sTREM2 (cortex), brain EdU-positive proliferating cell counts, and brain EdU-positive proliferating microglia counts (Iba1/EdU colocalization) were all altered by Para.09 at expected concentrations. F, Averaged log2(fold change) of genes in the proliferation module between 3.10C2 and isotype control groups within PS2APP;hTREM2 mice (pink) or PS2APP;Trem2ko mice (red), showing hTREM2 dependence of antibody responses. G, Heatmap illustrating differential expression of all proliferation genes in the module after treatment with a Para.09 precursor TREM2 agonist antibody, 3.10C2. Bars represent mean ± SEM except in B, where they represent median, 25–75% (boxes), and minimum/maximum (bars). N = 4–6 biological replicates (separate mice) per plot. ANOVA followed by Tukey's test compared with Isotype Ctrl *p < 0.05, **p < 0.01, ***p < 0.001.
Figure 5.
Figure 5.
Para.09 responses in aged TauPS2APP;hTREM2 mice. A, Response of sorted microglia (cortex) from aged TauPS2APP;hTREM2 mice to Para.09 (50, 100, or 200 mg/kg) versus isotype control antibody (200 mg/kg) or response of Trem2 knock-out PS2APP mice microglia compared with PS2APP;hTREM2. Upregulation of proliferation markers after Para.09 shown from individual genes in a heatmap. Averaged expression score across a set of proliferation-associated markers (bottom-left) or neurodegeneration-associated markers (bottom-right). Symbols represent median, 25–75% (boxes), and minimum/maximum (bars). One-way ANOVA was performed followed by Dunnett's test versus Isotype Ctrl. *p < 0.05, **p < 0.01, ***p < 0.001.
Figure 6.
Figure 6.
Para.09 chronic dosing effects in PS2APP mice. A, hMDM pSYK dose–response to agonist antibody mAb7. B, hMDM sTREM2 in supernatant 48 h after mAb7 treatment. C, Experiment schematic. PS2APP;hTREM2 mice were treated weekly for 12 weeks with 100 mg/kg Para.09, mAb7, or a control antibody starting at 4.5 months of age. Baseline (BL) mice were killed at 4.5 months. D, Cerebellum antibody concentrations collected 3 d postfinal dose. E, sTREM2 levels measured from cortical brain homogenate soluble fraction. F, Representative images of Iba1 staining in coronal brain sections. G, Quantification of %Area covered by Iba1 staining in coronal brain sections. H, Quantification of %Area covered by microglial clusters. I, Representative image of Aβ40 plaque staining. J, Quantification of %Area covered by Aβ40 plaque staining in coronal brain sections. K, Quantification of %Area covered by Campbell–Switzer plaque in coronal brain sections. L, Representative image of Campbell–Switzer amyloid plaque staining. M, N, Cortical insoluble guanidine HCL Aβ40 and Aβ42 measured by ELISA. O, Representative image of aminocupric disintegrative degeneration stain. P, Quantification of %Area covered by aminocupric stain in coronal brain sections. Q, Plasma neurofilament light (NfL) measured 3 d postfinal dose. Bars represent mean ± SEM. For A and B, six biological replicates (6 separate donors) with each point reporting an average of two to three technical replicates per donor. In DQ, points represent individual mice with the means of 8–10 sections per animal reported. ANOVA followed by Tukey's t test versus BL or as indicated. *p < 0.05, **p < 0.01, ***p < 0.001, ****p < 0.0001. Scale bar, 1,000 µm.
Figure 7.
Figure 7.
Para.09 chronic dosing effects near plaques in PS2APP mice. A, Plaque-associated neuritic dystrophy was visualized using Lamp1 (green) immunostaining with amyloid plaques visualized with methoxy-X04 (blue) and microglia visualized by Iba1 (red) immunostaining. B, Quantification of total Lamp1 %Area coverage per coronal brain section. C, D, Quantification of plaque-associated neuritic dystrophy (Lamp1; C) or microglia (Iba1; D) signal within a 15 µm radius dilated around amyloid plaques normalized to the total dilated area. Bars represent mean ± SEM from three sections for each animal; points are individual animal means. ANOVA followed by Tukey's t test *p < 0.05, **p < 0.01, ***p < 0.001, ****p < 0.0001 as indicated. Not significant unless otherwise marked. Scale bar, 1,000 µm.
Figure 8.
Figure 8.
Cellular responses to continuous versus intermittent antibody stimulation. A, Schematic describing treatment groups for in vitro stimulation of hMDMs with single or repeated exposure to antibody. Cell lysates were collected 20 min after the last antibody treatment pulse (either 20 min after Day 1 stimulation for the d1 group or 20 min after Day 2 stimulation for other groups). B, hMDM SYK phosphorylation responses to hPara.09 (blue) or related agonistic antibody 3.10.C2 (red) after single or repeated exposure to the antibody. Isotype control single-treatment effects are shown in gray for comparison. C, Schematic illustrating monthly versus weekly dosing paradigms at 30 or 100 mg/kg. IgG denotes an inactive isotype control antibody. D, sTREM2 concentration in brain homogenate soluble fraction. E, Dose antibody concentration in brain homogenate normalized to tissue weight. F, Counts of proliferating microglia per tissue section measured histologically by overlapping EdU+ Iba1+ cells. G, %Area of full coronal tissue sections occupied by clusters of microglia. H, %Area around X-04 plaques occupied by microglia (Iba1 staining). I, %Area of full coronal tissue sections occupied by methoxy-X04 amyloid plaques. Bars represent mean ± SEM. In A, three technical replicates are representative of two independent experiments. In FI, the points are individual animal means from three sections per animal. ANOVA followed by Tukey's t test versus IgG-negative control. *p < 0.05, **p < 0.01.
Figure 9.
Figure 9.
Chronic treatment with Para.09 does not alter disease pathology in TauPS2APP;hTREM2 mice. A, Experiment schematic. TauPS2APP;hTREM2 mice were treated monthly (every 4 weeks) with 100 mg/kg or 200 mg/kg Para.09 or control IgG (200 mg/kg) or weekly with 100 mg/kg of Para.09 for 16 weeks starting at 8 months of age. Baseline (BL) mice were killed at 8 months. Age-matched control hTREM2 mice (nontreated) were also included. B, C, sTREM2 concentration in plasma (B) or cortical homogenate soluble fraction (C). D, Plaque-associated neuritic dystrophy was visualized using Lamp1 (red) immunostaining with methoxy-X04 (blue) to stain for amyloid plaques and Iba1 (green) to immunostain for microglia. E, Average plaque-associated microglia (Iba1 signal) and plaque-associated neuritic dystrophy (Lamp1 signal) within a 15 µm radius around amyloid plaques normalized to total dilated plaque area. F, Representative images of Iba1 staining in coronal sections from TauPS2APP;hTREM2 mice. G, Quantification of %Area covered for total Iba1 (left) or Iba1 clusters (right) measured in coronal brain sections. H, Representative image of Campbell–Switzer amyloid plaque staining. I, Quantification of %Area covered by Campbell–Switzer plaque staining in coronal sections of brain (left) or hippocampus (right). J, Representative image of phosphorylated tau visualized using AT8 immunostaining. K, Quantification of AT8 integrated optical density per tissue area (Integ OD/area) in coronal brain sections (left) or hippocampus (right). L, Representative image of aminocupric disintegrative degeneration stain. M, Quantification of %Area covered by aminocupric staining in coronal brain sections (left) or hippocampus (right). Bars represent mean ± SEM from 3 sections (E) or 8–10 sections (G–M) for each animal; points are individual animal means. Two-way ANOVA including sex and treatment as a factor was performed followed by Tukey's t test versus BL or as indicated. *p < 0.05, **p< 0.01, ***p < 0.001, ****p < 0.0001 as indicated. Not significant unless otherwise marked. Scale bars: B, 400 µm; D–J, 1,000 µm.
Figure 10.
Figure 10.
Para.09 chronic dosing effects in TauPS2APP mice. A, Amyloid plaque load representative images visualized by Aβ40 staining. B, Quantification of %Area covered by Aβ40 staining. C, D, Quantification of total Aβ40 (C) or Aβ42 (D) in the insoluble fraction of cortex homogenates, recovered in guanidinium hydrochloride (GuHCl). E, F, Neuronal degeneration marker neurofilament light (NfL) levels in plasma (E) or cerebrospinal fluid (CSF, F). G, Volumetric MRI measurements of hippocampal volume normalized to total brain volume. Hippocampal volume reduction is evident over the 3-month course of the study for all treatment groups. Ntg mice were imaged only at the 11-month time point for comparison. H, Nest building behavior scores, representing averaged scores provided by two independent observers for each of the three nesting sessions. Each point represents the behavioral score of one animal. I, J, %Total distance traveled (I) or %Time (J) spent in the novel arm of a Y-maze during the test phase. K–M, Behavioral readouts from the open field assay reporting overall locomotive activity. Total beam breaks (K), movement through more sheltered peripheral regions (L), or movement through more exposed center regions (M). Bars represent mean ± SEM from 8–10 sections per animal; points are individual animal means. Two-way ANOVA including sex and treatment as a factor was performed followed by Tukey's t test versus BL or as indicated. *p < 0.05, **p < 0.01, ***p < 0.001, ****p < 0.0001 as indicated. Scale bar, 1,000 µm.
Figure 11.
Figure 11.
Mouse tool antibody mAb5 acute effects. A, B, Representative images (A) and quantification (B) of YFP reporter signal from PS2APP;CD11c-YFP mice dosed with mAb5 (100 mg/ml, i.p.). C. Microglia proliferation quantified by counts of EdU-positive signal within Iba1-positive microglia (whole brain). Bars represent mean ± SEM; points are individual animal means. Unpaired Student's t test *p < 0.05, **p < 0.01.
Figure 12.
Figure 12.
Mouse tool antibody mAb5 chronic dosing effects in TauPS2APP mice. A, Experiment schematic. TauPS2APP mice were treated weekly with 100 mg/kg mAb5, an agonistic antibody recognizing mouse TREM2, or control IgG (100 mg/kg) starting at 6 months of age. Control IgG–treated nontransgenic (Ntg) mice were also included. B, Plaque-associated neuritic dystrophy was visualized using Lamp1 (green), amyloid plaques visualized with methoxy-X04 (blue), and microglia visualized by Iba1 (red) immunostaining. C–F, Quantification of Iba1 (C, D) or Lamp1 (E, F) staining as %Area of coronal brain sections (C) or within a 15 µm radius around amyloid plaques normalized to total dilated plaque area (D). G, Representative image of Campbell–Switzer amyloid plaque staining on coronal brain sections. H, Quantification of %Area covered by Campbell–Switzer plaque staining in the full section (left), cortex (middle), or hippocampus (hip, right). I, Representative image of phosphorylated tau visualized using AT8 immunostaining. J, Quantification of total AT8 integrated optical density per tissue area (Integ OD/area) in the full section, cortex, or hippocampus. K, Representative image of aminocupric disintegrative degeneration stain. L, Quantification of %Area covered by aminocupric staining in the full section, cortex, or hippocampus. M, Representative image of GFAP astrocyte stain. N, Quantification of %Area covered by GFAP in the full section, cortex, or hippocampus. O, Representative image of CD68 reactive microglia stain. P, Quantification of %Area covered by CD68 staining in the full section, cortex, or hippocampus. Bars represent mean ± SEM from 3 sections (C–F) or 8–10 sections (G, I, K); points are individual animal means. ANOVA followed by Tukey's t test versus BL or as indicated. *p < 0.05, **p < 0.01, ***p < 0.001, ****p < 0.0001. Not significant unless otherwise marked. Scale bar, 1,000 µm.
Figure 13.
Figure 13.
Characterization of lysolecithin injury in hTREM2 transgenic mice. A, Schematic describing the WT mice and hTREM2 transgenic mice in lysolecithin demyelination experiment. Young adult WT or hTREM2 mice were dosed weekly with 100 mg/kg isotype control antibody. The first dose was administered on the day after demyelination surgery. All animals were killed at 14 d postsurgery. B, Representative images of the corpus callosum at Day 14 postdemyelination surgery. Microglia was visualized with Iba1 antibody (green) and PU.1 (red). Astrocytes were labeled with GFAP (green). Myelin debris were stained with dMBP (gray). C, Quantification of immunostaining coverage area over lesion area of Iba1, PU.1, GFAP, and dMBP. D, Representative images of corpus callosum with white lines denote lesion border. All cells in the oligodendrocyte lineage were labeled with Olig2 (green), and matured oligodendrocytes were labeled with CC1 (red) or GSTpi (gray). E, Quantification of cell density in lesion area for all cells in oligodendrocyte lineage, matured CC1+ oligodendrocytes, and matured GSTpi+ oligodendrocytes and quantification of lesion size normalized to WT group. Bars represent mean ± SEM; points are individual animal means. Student's t test **p < 0.01, ***p < 0.001. Scale bars: B, 500 µm; D, 100 µm.
Figure 14.
Figure 14.
Para.09 effects on remyelination after lysolecithin-induced injury in young hTREM2 mice. A, Schematic describing the effect of Para.09 treatment in lysolecithin-induced demyelination experiment. The first dose was administered at 1 d after (therapeutic dosing regimen) or 6 d prior to (prevention dosing regimen) lysolecithin-induced demyelination. Within each dosing regimen, animals were then assigned into 100 mg/kg Para.09 or 100 mg/kg control IgG groups. All animals were killed at 14 d postdemyelination surgery. B, Representative images of the corpus callosum at Day 14 postdemyelination surgery. Microglia was visualized with Iba1 antibody (green) and PU.1 (red). Astrocytes were labeled with GFAP (green). Myelin debris were stained with dMBP (gray). C–F, Quantification of immunostaining coverage area over lesion area of Iba1 (C), PU.1 (D), GFAP (E), and dMBP (F). G, Representative images of corpus callosum with white lines denoting lesion border. All cells in the oligodendrocyte lineage were labeled with Olig2 (green) and matured oligodendrocytes were labeled with CC1 (red). H–J, Quantification of cell density in lesion area for matured oligodendrocytes (H), OPCs (I), and all oligodendrocyte lineage cells (J). K, Quantification of lesion size normalized to control IgG treatment for each dosing regimen group. Bars represent mean ± SEM; points are individual animal means. Student’s t test was used to compare Para.09 and control antibody for each dosing regimen group. *p < 0.05, **p < 0.01, ***p < 0.001, ****p < 0.0001 as indicated. Scale bars: B, 500 µm; G, 100 µm.
Figure 15.
Figure 15.
Mouse tool antibody mAb5 effects after lysolecithin-induced injury in aged WT mice. A, Schematic describing the mAb5 treatment in lysolecithin-induced demyelination experiment. Twelve-month-old WT mice were assigned to control antibody, mAb5 therapeutic dosing, or mAb5 prevention dosing groups, and antibody was given every 5 d. The first dose of mAb5 was administered at 1 d after (therapeutic) or 4 d prior to (prevention) demyelination, and control antibody was administered following the therapeutic dosing design. All animals were killed at 14 d postdemyelination surgery. B, Representative images of the corpus callosum at Day 14 postdemyelination surgery. Microglia were visualized with Iba1 antibody (green) and PU.1 (red). Astrocytes were labeled with GFAP (green); myelin debris were stained with dMBP (gray). C–F, Quantification of immunostaining coverage area over lesion area of Iba1 (C), PU.1 (D), GFAP (E), and dMBP (F). G, Quantification of lesion size normalized to control antibody group. H, Representative images of corpus callosum with white lines denoting lesion border. All cells in the oligodendrocyte lineage were labeled with Olig2 (green), and matured oligodendrocytes were labeled with CC1 (red) or GSTpi (gray). I, J, Quantification of cell density in lesion area for matured oligodendrocytes (I) and OPCs (J). Bars represent mean ± SEM; points are individual animal means. Student's t test was used to compare mAb5 therapeutic to control antibody and mAb5 prevention to control antibody separately. *p < 0.05, **p < 0.01, ***p < 0.001. Scale bars: B, 500 µm; H, 100 µm.
Figure 16.
Figure 16.
Para.09 effects on remyelination after cuprizone-induced demyelination. A, Schematic describing the cuprizone treatment experiment. A single dose of antibody was administered intraperitoneally at 100 mg/kg after 4 weeks of the cuprizone diet. Animals were returned to normal chow and killed 3 or 14 d later. Additional animals were killed without antibody dosing at the end of the cuprizone diet (CPZ diet only, orange bars) or 4 weeks of normal chow (Ctrl diet only, white bars) for comparison. B, T2 MRI representative image (top) and quantification (bottom) at the end of 4 weeks of cuprizone diet. Animals were stratified within each recovery group to exhibit equivalent lesion intensity in Isotype Ctrl and Para.09 treatment conditions. C–L, Representative images (C, E, G, I, K) and quantification (D, F, H, J, L) of staining for Iba1 (microglia, C, D), PU.1 (microglia nuclei, E, F), dMBP (degraded myelin, GH), Olig2 (oligodendrocyte lineage cells, I, J), and solochrome (intact myelin, K, L). Hematoxylin nuclear label was used as a counterstain. Images are from coronal brain sections centered on the corpus callosum. Quantification is from a manually drawn region containing the corpus callosum. Bars represent mean ± SEM; points represent individual animals. Data were analyzed by one-way ANOVA followed by Tukey's multiple-comparisons test. *p < 0.05. Not significant unless otherwise marked. The scale of each chromogenic image is 3.5 mm in width. The scale bar for fluorescent images is 200 µm.
Figure 17.
Figure 17.
Chronic Para.09 effects on cuprizone-induced demyelination. A, Schematic describing mouse TREM2 wild-type versus TREM2 knock-out, and hTREM2 transgenic mice in the chronic 12-week cuprizone (CPZ) experiment. Mice were placed on a cuprizone diet for 4 weeks and then dosed weekly for the following 8 weeks with 100 mg/kg isotype control or Para.09 antibody (total of 9 doses). All animals were killed 3 d after the last dose. T2 MRI was performed at Week 3 to balance demyelination signatures across dose groups and again at Week 11. B, T2 MRI intensity at Week 11 in the corpus callosum splenium region from hTREM2 control diet isotype, hTREM2 CPZ diet isotype, and hTREM2 CPZ diet Para.09 dosed mice. C, Brain lipidomic profiles from the terminal corpus callosum region in 12-week CPZ diet isotype control versus 12-week control diet isotype control dosed hTREM2 mice. Red points: upregulated lipids with an adjusted p-value of <0.05 and log2(fold change) of >1. Blue points: downregulated lipids with an adjusted p-value of <0.05 and log2(fold change) of less than −1. Dashed horizontal line: adjusted p-value cutoff = 0.05. D, Brain lipidomic profiles from the terminal corpus callosum region in 12-week CPZ diet Para.09 versus 12-week CPZ diet isotype control–dosed hTREM2 mice. No lipids met the adjusted p-value of <0.05 (horizontal dashed line). E, Sum of cholesteryl ester (CE) normalized intensities from all CE species represented as a CE lipid class (left) and CE 22:6 species (right) from the terminal corpus callosum region. Bars represent mean ± SEM. One-way ANOVA with Tukey's test: ****p < 0.0001.

Similar articles

Cited by

References

    1. Andrews SJ, Renton AE, Fulton-Howard B, Podlesny-Drabiniok A, Marcora E, Goate AM (2023) The complex genetic architecture of Alzheimer’s disease: novel insights and future directions. EBioMedicine 90:104511. 10.1016/j.ebiom.2023.104511 - DOI - PMC - PubMed
    1. Atagi Y, et al. (2015) Apolipoprotein E is a ligand for triggering receptor expressed on myeloid cells 2 (TREM2). J Biol Chem 290:26043–26050. 10.1074/jbc.M115.679043 - DOI - PMC - PubMed
    1. Bacioglu M, et al. (2016) Neurofilament light chain in blood and CSF as marker of disease progression in mouse models and in neurodegenerative diseases. Neuron 91:494–496. 10.1016/j.neuron.2016.07.007 - DOI - PubMed
    1. Bailey CC, DeVaux LB, Farzan M (2015) The triggering receptor expressed on myeloid cells 2 binds apolipoprotein E. J Biol Chem 290:26033–26042. 10.1074/jbc.M115.677286 - DOI - PMC - PubMed
    1. Bassil R, Shields K, Granger K, Zein I, Ng S, Chih B (2021) Improved modeling of human AD with an automated culturing platform for iPSC neurons, astrocytes and microglia. Nat Commun 12:5220. 10.1038/s41467-021-25344-6 - DOI - PMC - PubMed

MeSH terms

LinkOut - more resources