. 2024 Jun 3;7(8):e202402683.
doi: 10.26508/lsa.202402683. Print 2024 Aug.

Reduced protein-coding transcript diversity in severe dengue emphasises the role of alternative splicing

Affiliations

Reduced protein-coding transcript diversity in severe dengue emphasises the role of alternative splicing

Priyanka Mehta et al. Life Sci Alliance. .

Erratum in

Abstract

Dengue fever, a neglected tropical arboviral disease, has emerged as a global health concern in the past decade. Necessitating a nuanced comprehension of the intricate dynamics of host-virus interactions influencing disease severity, we analysed transcriptomic patterns using bulk RNA-seq from 112 age- and gender-matched NS1 antigen-confirmed hospital-admitted dengue patients with varying severity. Severe cases exhibited reduced platelet count, increased lymphocytosis, and neutropenia, indicating a dysregulated immune response. Using bulk RNA-seq, our analysis revealed a minimal overlap between the differentially expressed gene and transcript isoform, with a distinct expression pattern across the disease severity. Severe patients showed enrichment in retained intron and nonsense-mediated decay transcript biotypes, suggesting altered splicing efficiency. Furthermore, an up-regulated programmed cell death, a haemolytic response, and an impaired interferon and antiviral response at the transcript level were observed. We also identified the potential involvement of the RBM39 gene among others in the innate immune response during dengue viral pathogenesis, warranting further investigation. These findings provide valuable insights into potential therapeutic targets, underscoring the importance of exploring transcriptomic landscapes between different disease sub-phenotypes in infectious diseases.


Conflict of interest statement

The authors declare that they have no conflict of interest.

Figures

None
Graphical abstract
Figure 1.
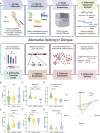
Figure 1.. Study design overview, patient stratification, and clinical characteristics of the cohort.
(A) Schematic flow chart illustrates the sequential process, starting from sample collection, clinical segregation based on the clinical characteristics of transcriptome sequencing, transcript-level RNA-seq data analysis, and downstream functional analysis, and interpretation for dengue-positive patients categorised as mild, moderate, and severe. (B, C, D, E, F, G) Sample-wise distribution of clinical parameters across the mild, moderate, and severe patients for (B) age of the patients, (C) platelet counts (in 109/litre), (D) total leucocyte count (in 109/litre), (E) lymphocyte count (in %), (F) neutrophil count (in %), and (G) bilirubin (direct) (in mg/dl). (H) Radar plot represents the clinical symptoms manifested by the patients in three severity groups. A Mann–Whitney U test was used to test for significance, and only significant associations are depicted in the plot.
Figure 2.
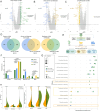
Figure 2.. Illustration of the patterns of differentially expressed transcripts across the severity sub-phenotypes and their characteristics.
(A, B, C) Violin plots depict differentially expressed transcripts (DTEs) between (A) severe versus mild, (B) severe versus moderate, and (C) moderate versus mild patients. The x-axis indicates the log2 fold change, whereas the y-axis shows the log10 (P-values). Coloured dots denote isoforms significant in the higher severity group compared with the lower severity. (D) Venn diagrams showcase the overlap between significantly differentially expressed genes and transcripts across different severity groups. (E) Graphic visualisation characterises alternate transcript isoforms across severity groups. (F) Bar plot illustrates the distribution of transcript biotypes across severity groups compared with the global distribution. A chi-square test was performed to check for significance. (G) Combined dot plot displays groups of significantly enriched Reactome pathways for the differentially expressed gene (as circles) and DTE (as triangles), with severity comparison patient groups represented in green (severe versus mild), blue (severe versus moderate), and yellow (moderate versus mild). The size of the icons reflects the number of genes involved in the pathway. (H) Violin plot illustrates the number of exons in DTEs represented in yellow, as opposed to their corresponding non-significantly expressed isoforms, referred to as differential isoforms (DI), shown in green. This comparison is made across the severity groups. (I) Violin plot illustrates the ratio of isoforms expressed across severity groups. The yellow colour represents significantly expressed isoforms (DTEs), whereas green represents non-significantly expressed isoforms (DI), in comparison with the total number of possible isoforms. A Mann–Whitney U test was used to compare for significance, and only significant associations are shown.
Figure S1.
Figure S1.. Differential gene expression and transcript features.
(A, B, C) Volcano plot represents differentially expressed genes between (A) severe versus mild, (B) severe versus moderate, and (C) moderate versus mild comparison groups. (D, E, F) Circular dendrogram represents differentially expressed transcripts between (D) severe versus mild, (E) severe versus moderate, and (F) moderate versus mild comparison groups. The edge colour represents the log2 fold change with respect to the higher severity group. (G, H, I) Density plot represents the comparison between significant and non-significant differentially expressed transcripts for severity sub-phenotypes: severe versus mild, severe versus moderate, and moderate versus mild, for (G) 3′ UTR, (H) coding sequence length, and (I) 5′ UTR. A chi-square test was used for comparison.
Figure 3.
Figure 3.. Dengue severity–associated alternative splicing patterns and their functional consequences.
(A) Venn diagram represents the overlap between differentially spliced (DS) genes (in yellow), differentially expressed transcripts (in blue), and differentially expressed genes (in green) across disease severity group comparisons, severe versus mild, severe versus moderate, and moderate versus mild. (B, C, D) Network represents the genes differentially spliced between different severity comparisons. The nodes in square represent the pathway to which the genes belong, whereas the size represents the number of genes differentially spliced in that pathway. (B, C, D) Node colour represents pathway categories; edges (circle) represent the gene names, and the edge colour represents direction of regulation—up-regulated (blue) or down-regulated (red)—in (B) severe versus mild, (C) severe versus moderate, and (D) moderate versus mild. (E) Stacked bar plot depict distribution of splicing events (retained intron [RI] [yellow], mutually exclusive exons [brown], alternative 3′ splice site [A3SS] [blue], alternative 5′ splice site [A5SS] [dark green], and skipped exons [SE] [light green] in DS and differentially expressed transcript groups compared with global transcriptome diversity across severe, moderate, and mild). The stacked bars with black borders represent the significant splicing events when compared to the global distribution of splicing events.
Figure 4.
Figure 4.. Enrichment of repeat elements around the splicing sites as a modulator of alternative splicing during dengue severity.
(A) Graphical illustration expands on two exonic regions to highlight the enrichment of repeat elements around the 5′ and 3′ splicing sites as a potential modulator of alternative splicing. (B) Stacked bar plot illustrates the proportion of total repeat bases around 200 bases downstream of the 5′ splice site (5′ss) and 200 bases upstream of the 3′ splice site (3′ss) between significant differentially expressed transcripts (with black border) and non-significant DIs (without black borders) across severity groups: severe (blue), moderate (yellow), and mild (green). (C, D) Radial bar plot compares the proportion of repeat classes, including short interspersed nuclear elements, long interspersed nuclear elements, LTR, and simple repeats, between significant differentially expressed transcripts (right panel) and non-significant DIs (left panel) at (C) the 5′ splice site (5′ss) and (D) the 3′ splice site (3′ss) across severity groups: severe (blue), moderate (yellow), and mild (green).
Figure 5.
Figure 5.. Differential contribution of transcript biotypes/isoforms to the gene-level function.
(A) Visual representation illustrates the role of alternative splicing in increasing isoform diversity, influencing the abundance of various transcript biotypes, and contributing differentially to overall gene expression. (B) Venn diagram shows the overlap between genes exhibiting differential transcript usage patterns across different severity comparison groups: severe versus mild, severe versus moderate, and moderate versus mild. (C, D, E) Upset plot illustrates the overlap and unique genes displaying differential transcript usage, differential transcript expression, differential gene expression, and differential splicing (DS) across the severity comparisons: (C) severe versus mild, (D) moderate versus mild, and (E) severe versus moderate. (F) Combined box-and-violin plot groups genes that are differentially spliced and exhibit differential transcript usage into similar functional pathways. The box represents different biotypes—lncRNA (light blue), nonsense-mediated decay (red), protein coding (yellow), protein-coding CDS not defined (blue), and retained intron (violet). The violin plot depicts the overall abundance of gene groups in severity sub-phenotypes: severe, moderate, and mild.
Figure S2.
Figure S2.. Summary of the alternative splicing and differential transcript usage across dengue disease severity.
(A) Sashimi graph visually underscores the MX1 gene, accentuating the patterns of differential intron excision in the severe versus mild patients. In this representation, arcs symbolise splice junction–connected exons, and their colour indicates whether they are up- or down-regulated in the mild group. Transcripts are colour-coded based on biotypes, with protein coding in yellow and retained intron in violet. The isoform significantly expressed is marked as *Sig differentially expressed transcript. (B) LeafCutter analysis depicts specific junctions that are differentially spliced, and the table represents the dPSI (change in per cent spliced in) scores for each junction. (C) Boxplots showcase the abundance of all transcript isoforms grouped by biotypes across severity groups—mild, moderate, and severe.
Figure 6.
Figure 6.. Summary of the alternative splicing and differential transcript usage across dengue disease severity.
(A) Sashimi graph visually underscores the RBM39 gene, accentuating the patterns of differential intron excision in the severe versus mild group. In this representation, arcs symbolise splice junction–connected exons, and their colour indicates whether they are up- or down-regulated in the mild group. Transcripts are colour-coded based on biotypes, with nonsense-mediated decay in red, protein coding in yellow, and protein-coding CDS not defined in blue. The isoform significantly expressed is marked as *Sig differentially expressed transcript. (B) LeafCutter analysis depicts specific splice junctions that are differentially spliced, and the table represents the dPSI scores for each junction. (C) Boxplots showcase the abundance of all transcript isoforms grouped by biotypes across severity groups: mild, moderate, and severe.
Figure S3.
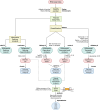
Figure S3.. Flow chart represents the computational pipeline used in the study to understand host alternative splicing during disease severity from RNA-seq data of dengue patient samples.

Similar articles

Cited by

References

    1. Dengue and Severe Dengue (2024). Available at: https://www.who.int/news-room/fact-sheets/detail/dengue-and-severe-dengue.
    1. Horstick O, Tozan Y, Wilder-Smith A (2015) Reviewing dengue: Still a neglected tropical disease? PLoS Negl Trop Dis 9: e0003632. 10.1371/journal.pntd.0003632 - DOI - PMC - PubMed
    1. Mullard A (2023) Neglected tropical diseases go global. Nat Rev Drug Discov 22: 865–866. 10.1038/d41573-023-00167-w - DOI - PubMed
    1. DENGUE SITUATION IN ::INDIA National Center for Vector Borne Diseases Control (NCVBDC) (2024). Available at: https://ncvbdc.mohfw.gov.in/index4.php?lang=1&level=0&linkid=431&lid=3715.
    1. Srikiatkhachorn A, Rothman AL, Gibbons RV, Sittisombut N, Malasit P, Ennis FA, Nimmannitya S, Kalayanarooj S (2011) Dengue-how best to classify it. Clin Infect Dis 53: 563–567. 10.1093/cid/cir451 - DOI - PMC - PubMed

MeSH terms

Substances

LinkOut - more resources