. 2024 Jun 3;15(1):4309.
doi: 10.1038/s41467-024-48574-w.

IL-6 inhibition prevents costimulation blockade-resistant allograft rejection in T cell-depleted recipients by promoting intragraft immune regulation in mice

Affiliations

IL-6 inhibition prevents costimulation blockade-resistant allograft rejection in T cell-depleted recipients by promoting intragraft immune regulation in mice

Moritz Muckenhuber et al. Nat Commun. .

Abstract

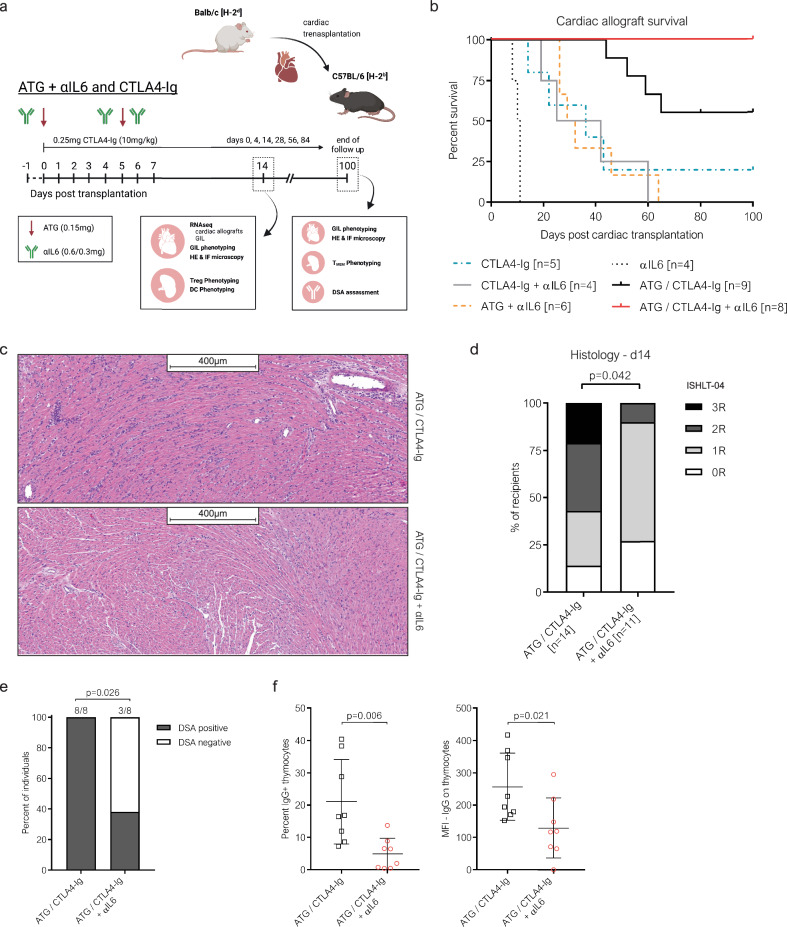
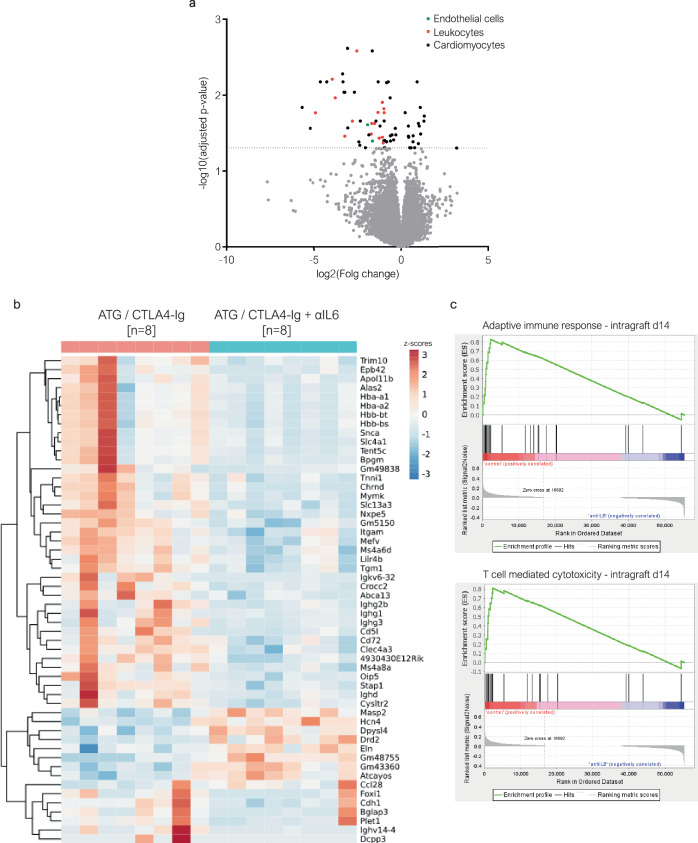
The efficacy of costimulation blockade with CTLA4-Ig (belatacept) in transplantation is limited due to T cell-mediated rejection, which also persists after induction with anti-thymocyte globulin (ATG). Here, we investigate why ATG fails to prevent costimulation blockade-resistant rejection and how this barrier can be overcome. ATG did not prevent graft rejection in a murine heart transplant model of CTLA4-Ig therapy and induced a pro-inflammatory cytokine environment. While ATG improved the balance between regulatory T cells (Treg) and effector T cells in the spleen, it had no such effect within cardiac allografts. Neutralizing IL-6 alleviated graft inflammation, increased intragraft Treg frequencies, and enhanced intragraft IL-10 and Th2-cytokine expression. IL-6 blockade together with ATG allowed CTLA4-Ig therapy to achieve long-term, rejection-free heart allograft survival. This beneficial effect was abolished upon Treg depletion. Combining ATG with IL-6 blockade prevents costimulation blockade-resistant rejection, thereby eliminating a major impediment to clinical use of costimulation blockers in transplantation.


Conflict of interest statement

TW received speaker’s honoraria from eGenesis and Mallinckrodt/Therakos and is a DSMB member for Quell Therapeutics. The other authors have no competing interests to disclose.

Figures

Fig. 1
Fig. 1. ATG re-shapes the composition of the peripheral, but not the intragraft T cell compartment.
a–d C57BL/6 (BL6) mice were grafted with a fully mismatched BALB/c cardiac allograft. Panel a illustrates the therapeutic regimen (Note: CTLA4-Ig is used as belatacept does not adequately bind murine CD80/CD86) (created with biorender.com). b Cardiac allograft survival under indicated immunosuppressive treatment regimens is depicted as Kaplan-Meier curves. Panel c illustrates the frequency of regulatory T cells (Tregs, CD4+ FOXP3+) within CD4 T cells in spleens (left) and cardiac allografts (right) isolated 14 days after transplantation (CTLA4-Ig [n = 7], ATG/CTLA4-Ig [n = 14]). Panel d shows the ratio between Tregs and CD8 T cells (log2 transformed) within spleens (left) and cardiac allografts (right) isolated 14 days after transplantation (CTLA4-Ig [n = 7], ATG/CTLA4-Ig [n = 14]). e and f C57BL/6 mice received two doses of anti-thymocyte globulin (ATG, 0.15 mg on days 0 and 5) with or without costimulation blockade or CTLA4-Ig alone (without cardiac transplantation). A panel of pro-inflammatory cytokines was quantified in sera obtained 7 days after the first ATG injection using a flow cytometry-based multiplex assay. e Cytokine levels are depicted descriptively as z-scores in a heat map. Each column represents an individual mouse. Panel f illustrates serum concentrations (pg/ml) of interleukin (IL)−6 (top, left), IL-23 (top, right), interferon-gamma (IFNγ, bottom, left) and interferon-beta (IFNβ, bottom, right), 7 days after the first ATG administration (naïve BL6 [n = 4], ATG [n = 4], CTLA4-Ig [n = 5], ATG/CTLA4-Ig [n = 5]). Each symbol represents an individual mouse. Lines indicate group means ± SD (c and d) or median ± IQR (f). Group comparisons (indicated with brackets) were conducted via two-sided unpaired t-test for normal distributed values (c and d) and two-sided Mann–Whitney-U test for variables not following normal distribution f.
Fig. 2
Fig. 2. IL-6 blockade prevents costimulation blockade-resistant allograft rejection.
Panel a represents a schematic illustration of the experimental setup and the immunosuppressive treatment regimen combining anti-thymocyte globulin (ATG) and perioperative interleukin (IL)−6 blockade under CTLA4-Ig (created with biorender.com). b C57BL/6 mice received a fully mismatched BALB/c cardiac allograft under the indicated immunosuppressive treatment regimen (Note: CTLA4-Ig and ATG/CTLA4-Ig groups are also shown in panel 1b). Kaplan-Meier curves depict the cardiac allograft survival for each treatment group. Cardiac allograft survival was compared between groups using a two-sided log-rank test. In selected recipients, cardiac allografts were explanted 14 days after transplantation for histological examination. Panel c shows two representative images of the hematoxylin-eosin (HE) stained cardiac allograft tissue sections generated for the histological analyses presented in panel d. d Rejection severity was graded according to the 2004 International Society for Heart and Lung Transplantation (ISHLT-04) cardiac allograft rejection scores depicted as contingency bar graph. ISHLT scores were compared between the two groups via two-sided Mann-Whitney U test. At rejection or at the end of the follow up (day 100), presence of serum IgG donor-specific antibodies (DSA) was assessed via flow crossmatch e and f. Panel e illustrates the fraction of recipients with detectable IgG DSA (DSA positive) within each treatment group. The rates of DSA positive recipients were compared between the two treatment groups using Fisher’s exact test. Panel f depicts the frequency of IgG+ donor thymocytes (left) and the median fluorescence intensity (MFI) of IgG on donor thymocytes (right) for each individual recipient, analyzed using a two-sided unpaired t-test (ATG/CTLA4-Ig [n = 8], ATG/CTLA4-Ig + αIL6 [n = 8]). Each symbol represents an individual mouse. Lines indicate group means ± SD.
Fig. 3
Fig. 3. IL6 blockade leads to intragraft accumulation of Tregs.
C57BL/6 mice were transplanted with a fully mismatched BALB/c cardiac allograft. 14 days after transplantation, cardiac allografts were explanted in recipients treated with indicated immunosuppressive regimens. a–d Grafts were enzymatically digested for flow cytometric analysis of graft infiltrating leukocytes (GIL). a The absolute number of graft infiltrating CD4 and CD8 T cells was calculated based in the total number of GIL isolated per cardiac allograft (ATG/CTLA4-Ig [n = 12], ATG/CTLA4-Ig + αIL6 [n = 11]). b The frequency of CD8 effector-memory T cells (CD8 TEM, CD8+ CD44high CD62Llow) within infiltrating CD8 T cells was quantified (ATG/CTLA4-Ig [n = 9], ATG/CTLA4-Ig + αIL6 [n = 6]). Panel c depicts the frequency of regulatory T cells (Tregs, CD4+ FOXP3+) within CD4 T cells in cardiac allografts (left) and spleens (right) (Intragraft: ATG/CTLA4-Ig [n = 12], ATG/CTLA4-Ig + αIL6 [n = 11]; Spleen: ATG/CTLA4-Ig [n = 14], ATG/CTLA4-Ig + αIL6 [n = 13]). Panel d shows the ratio between Tregs and CD8 T cells (determined via flow cytometry; log2 transformed) within cardiac allografts (left) and spleens (right) (Intragraft: ATG/CTLA4-Ig [n = 12], ATG/CTLA4-Ig + αIL6 [n = 11]; Spleen: ATG/CTLA4-Ig [n = 14], ATG/CTLA4-Ig + αIL6 [n = 13]). Panel e shows a representative image of cardiac allograft tissue sections stained for FOXP3 (left) and CD8 (right) obtained via immunofluorescence microscopy for the quantification of Tregs and CD8 T cells presented in panel f. f The number of Tregs (FOXP3+, red) and CD8 T cells (CD8+, green) per mm² was quantified in these tissue sections of cardiac allografts. The ratio between infiltrating Tregs and CD8 T cells was calculated and is depicted in log2-transformed form (ATG/CTLA4-Ig [n = 11], ATG/CTLA4-Ig + αIL6 [n = 10]). g–i Long-term surviving cardiac allografts were explanted 100 days after transplantation and enzymatically digested (ATG/CTLA4-Ig [n = 4], ATG/CTLA4-Ig + αIL6 [n = 7]). Graft infiltrating leukocytes were analyzed via flow cytometry to quantify the infiltrating CD4 and CD8 T cells g and CD8 TEM h. i The ratio of infiltrating Tregs and CD8 T cells is depicted in log2-transformed form. Each symbol represents an individual mouse. Lines indicate group means ± SD. All group comparisons (indicated with brackets) were conducted via two-sided unpaired t-tests. Representative flow cytometry data are provided in (suppl. Fig. 5).
Fig. 4
Fig. 4. IL6 blockade-mediated extension of cardiac allograft survival is Treg-dependent.
Panel a represents a schematic illustration of the experimental setup and the time schedule for regulatory T cell (Treg) depletion (created with biorender.com). b C57BL/6 mice received a fully mismatched BALB/c cardiac allograft under ATG/CTLA4-Ig + αIL6. In these recipients, Tregs were depleted using a monoclonal anti-CD25 antibody (clone: PC61; 0.25 mg per dose) 5 and 2 days before (early Treg depletion) or 28 and 35 days after (late Treg depletion) cardiac transplantation. Kaplan-Meier curves depict the cardiac allograft survival for each group (Note: “ATG/CTLA4-Ig + αIL6 without Treg depletion” group is also shown in panel 2b). Cardiac allograft survival was compared between groups using a two-sided log-rank test. c, d In selected recipients (ATG/CTLA4-Ig with or without αIL6, without Treg depletion), cardiac allografts were explanted 14 days after transplantation, enzymatically digested, and graft infiltrating leukocytes (GIL) were flow sorted (7AAD CD45+) for bulk RNA sequencing. Gene set enrichment analysis was performed between GILs isolated from the ATG/CTLA4-Ig + αIL6 group [n = 4] and the ATG/CTLA4-Ig group [n = 4]. The tested gene sets are representative for genes specifically upregulated in Tregs but not effector T cells (Treg vs. Teff) c and for interleukin-4 and-13 (IL4/13) signaling and interleukin-10 (IL-10) signaling d.
Fig. 5
Fig. 5. IL-6 blockade together with ATG specifically induces PD1high CD44high Tregs in the periphery.
a–b Peripheral blood regulatory T cells (Tregs, CD4+ FOXP3+) were quantified in cardiac allograft recipients via flow cytometry a (ATG/CTLA4-Ig [n = 9], ATG/CTLA4-Ig + αIL6 [n = 8]). Panel b depicts the mean FOXP3 expression (mean fluorescence intensity, MFI) in Tregs. ck Spleens of cardiac allograft recipients were isolated 14 days after transplantation for phenotypical characterization of Tregs based on the expression of CD44 c, Ki-67 d, CD25 e, CTLA4 f, PD-1 g and Helios h (ATG/CTLA4-Ig [c: n = 9, d–h: n = 14], ATG/CTLA4-Ig + αIL6 [n = 13]). i UMAP projections generated using a concatenated file of 90,000 total Tregs (CD4+ Foxp3+) generated from 9 individual mice of the ATG/CTLA4-Ig group and 13 individual mice of the ATG/CTLA4-Ig + αIL6 group. The panels represent the density of Tregs expressing each phenotypical marker (CD44, Ki-67, CD25, PD-1, CTLA4, Helios) as heat map statistic. j Automated clustering using FlowSOM identified 5 distinct Treg populations based on the expression profile of CD44, Ki-67, CD25, PD-1, CTLA4, and Helios. k The generated UMAP projections and clusters were applied to each individual Treg sample to compare the relative distribution of each cluster between the two treatment groups (ATG/CTLA4-Ig [n = 9], ATG/CTLA4-Ig + αIL6 [n = 13]). The circle in panel J indicates cluster 5 (red) within UMAP projections for each treatment group. Each symbol represents an individual mouse. All group comparisons (indicated with brackets) were conducted with a two-sided unpaired t-test. A correction for multiple testing was performed in panels a and b. Lines indicate group means ± SD. Representative flow cytometry data are provided in (suppl. Fig. 6).
Fig. 6
Fig. 6. IL-6 blockade attenuates the inflammatory response within cardiac allografts.
a–c C57BL/6 mice were grafted with a fully mismatched BALB/c heart under the indicated immunosuppressive regimen. Cardiac allografts were explanted 14 days after transplantation for histological and transcriptional analysis. RNA sequencing of paraffin-embedded cardiac allografts was performed. a Genes significantly up-or downregulated (within a Benjamini-Hochberg corrected Wald test) in the ATG/CTLA4-Ig + αIL6 group (n = 8) compared to the ATG/CTLA4-Ig (n = 8) group are depicted as a volcano plot. Color codes indicate the expressing cell type. Panel b represents a heat map depicting all (protein-coding and non-coding) differentially expressed genes for each individual sample. Each individual cardiac allograft represents a column. c Gene set enrichment analysis was performed between ATG/CTLA4-Ig (“control”, [n = 8]) and ATG/CTLA4-Ig + αIL6 (“antiIL6”, [n = 8]) for gene sets representing an adaptive immune response (top) and T cell-mediated cytotoxicity (bottom).

Similar articles

Cited by

References

    1. Noble J, et al. Belatacept in kidney transplantation and its limitations. Expert Rev. Clin. Immunol. 2019;15:359–367. doi: 10.1080/1744666X.2019.1574570. - DOI - PubMed
    1. Vincenti F, et al. Belatacept and Long-Term Outcomes in Kidney Transplantation. N. Eng. J. Med. 2016;374:333–343. doi: 10.1056/NEJMoa1506027. - DOI - PubMed
    1. Ford Mandy L. T Cell Cosignaling Molecules in Transplantation. Immunity. 2016;44:1020–1033. doi: 10.1016/j.immuni.2016.04.012. - DOI - PMC - PubMed
    1. Linsley PS, et al. Immunosuppression in Vivo by a Soluble Form of the CTLA-4 T Cell Activation Molecule. Science. 1992;257:792–795. doi: 10.1126/science.1496399. - DOI - PubMed
    1. Larsen CP, et al. Rational Development of LEA29Y (belatacept), a High-Affinity Variant of CTLA4-Ig with Potent Immunosuppressive Properties. Am. J. Transpl. 2005;5:443–453. doi: 10.1111/j.1600-6143.2005.00749.x. - DOI - PubMed

MeSH terms