. 2024 Jun 3;15(1):4706.
doi: 10.1038/s41467-024-48490-z.

Neuromodulatory subcortical nucleus integrity is associated with white matter microstructure, tauopathy and APOE status

Affiliations

Neuromodulatory subcortical nucleus integrity is associated with white matter microstructure, tauopathy and APOE status

Alfie Wearn et al. Nat Commun. .

Abstract

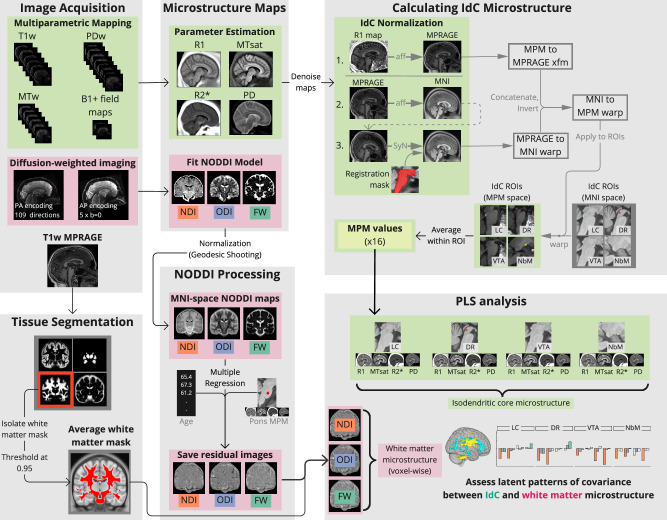
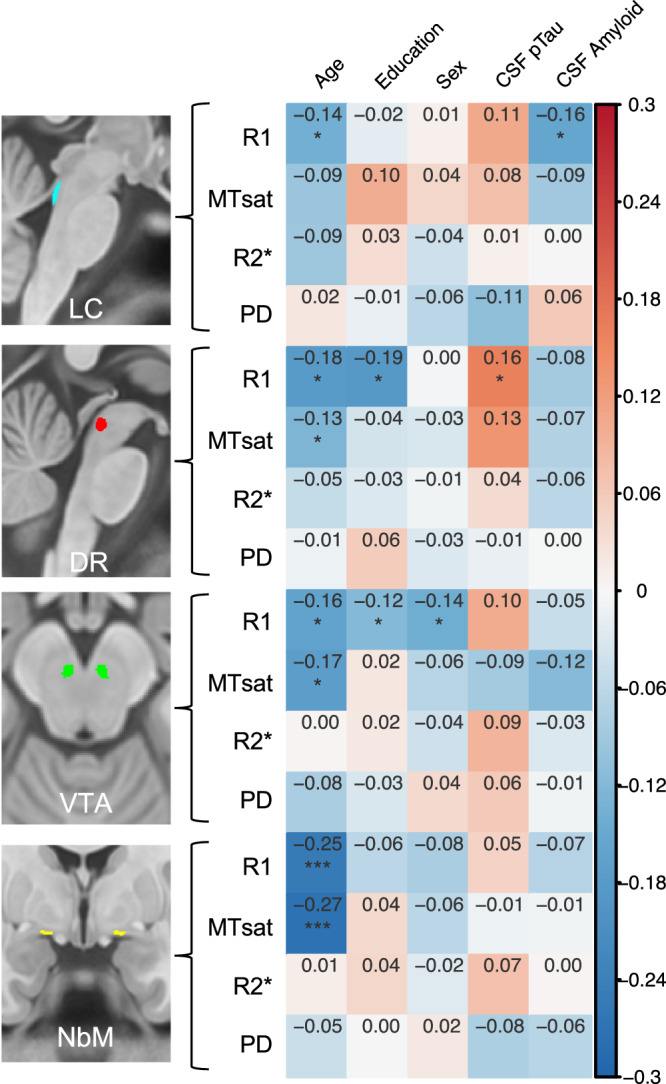
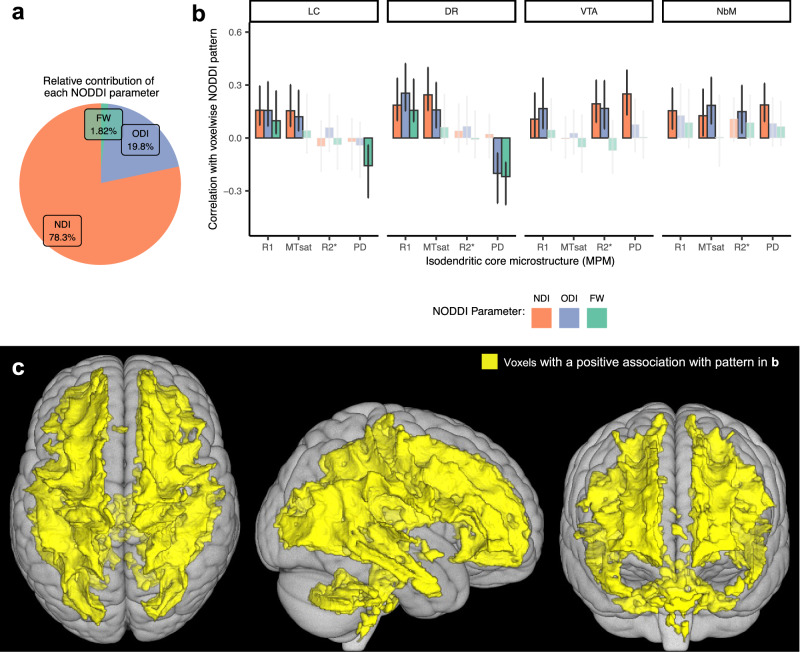
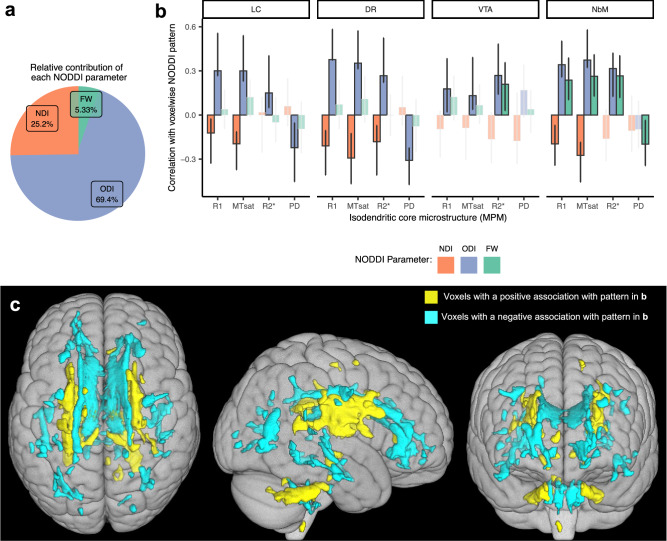
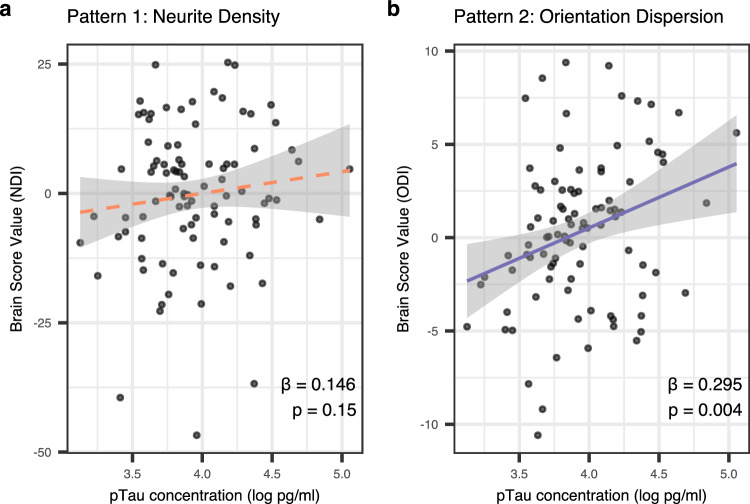
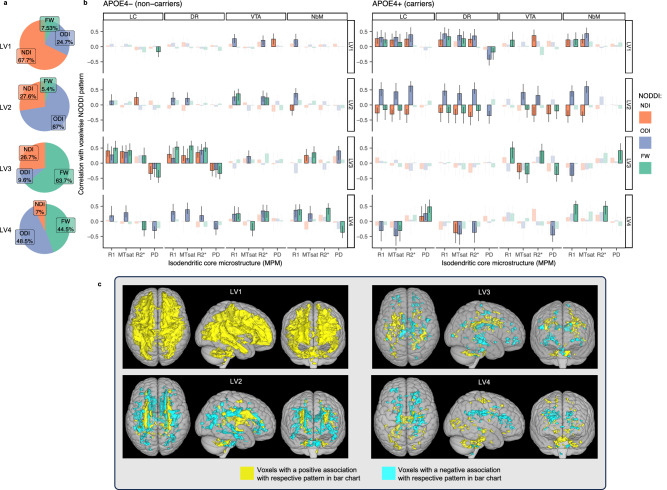
The neuromodulatory subcortical nuclei within the isodendritic core (IdC) are the earliest sites of tauopathy in Alzheimer's disease (AD). They project broadly throughout the brain's white matter. We investigated the relationship between IdC microstructure and whole-brain white matter microstructure to better understand early neuropathological changes in AD. Using multiparametric quantitative magnetic resonance imaging we observed two covariance patterns between IdC and white matter microstructure in 133 cognitively unimpaired older adults (age 67.9 ± 5.3 years) with familial risk for AD. IdC integrity related to 1) whole-brain neurite density, and 2) neurite orientation dispersion in white matter tracts known to be affected early in AD. Pattern 2 was associated with CSF concentration of phosphorylated-tau, indicating AD specificity. Apolipoprotein-E4 carriers expressed both patterns more strongly than non-carriers. IdC microstructure variation is reflected in white matter, particularly in AD-affected tracts, highlighting an early mechanism of pathological development.


Conflict of interest statement

The authors declare no competing interests.

Figures

Fig. 1
Fig. 1. Flowchart of image processing pipeline.
Major parts of the pipeline from image acquisition to the primary (partial least squares) analysis of this study are shown, with major sections shown with a light gray background. Green boxes refer to parts of the multiparametric-mapping (MPM) processing pipeline. Pink boxes refer to parts of the diffusion processing pipeline. Smaller intermediary processes (e.g. denoising) are shown with text along arrows and intermediary products (e.g. transform matrices) are shown in a dark gray box. Images for all masks are shown in more detail in Supplemental Information. MPM multiparametric mapping, MTsat magnetization transfer saturation, PD proton density, NODDI neurite orientation dispersion and density imaging, NDI neurite density index, ODI orientation dispersion index, FW free water fraction, IdC isodendritic core, LC locus coeruleus, DR dorsal raphe, VTA ventral tegmental area, NbM nucleus basalis of Meynert, PLS partial least squares.
Fig. 2
Fig. 2. Partial correlation statistics measures of Isodendritic core integrity and demographic variables and CSF biomarkers.
Correlation statistics are corrected for age, sex, and education. Sex was dummy-coded as male (1) and female (0), so a positive correlation indicates greater values in males, and a negative correlation indicates greater values in females. MT magnetization transfer saturation, PD proton density, LC locus coeruleus, DR dorsal raphe, VTA ventral tegmental area, NbM nucleus basalis of Meynert. *p < 0.05, **p < 0.001, ***p < 0.0001 (These p-values are uncorrected for multiple comparisons and are presented only for transparency. They are not the primary metrics interpreted in the analysis but are here only to guide future studies). All statistical tests shown were two-tailed. Source data are provided as a Source Data file.
Fig. 3
Fig. 3. LV1 correlations between IdC MPM measures and NODDI in white matter.
a The relative contributions of each NODDI metric to the overall pattern are calculated as a sum of the design scores and expressed as a percentage. NDI is the primary driver of this pattern. b The strength and direction of the relationship that each measure of isodendritic core microstructure (R1, MTsat, R2*, PD) has with the voxels highlighted in (c) for each measure of white matter microstructure (NDI, ODI or FW). Error bars show 95% confidence intervals from 1000 bootstrapped samples. The midpoint of each bar represents the correlation using the full dataset. Non-significant correlations (confidence intervals overlapping with zero) are faded out. c The yellow color of the voxels indicates a positive relationship with the pattern shown in the top panel. Only voxels with a bootstrap ratio of >|2| are colored. Here, we see strong positive associations between R1 in all isodendritic core nuclei and NDI (as well as ODI) across most of the white matter. LC locus coeruleus, DR dorsal raphe, VTA ventral tegmental area, NbM nucleus basalis of Meynert, MTsat magnetization transfer saturation, PD proton density, NDI neurite density index, ODI orientation dispersion index, FW free water fraction. Source data are provided as a Source Data file.
Fig. 4
Fig. 4. LV2 correlations between IdC MPM measures and NODDI in white matter.
a The relative contributions of each NODDI metric to the overall pattern are calculated as a sum of the design scores and expressed as a percentage. Covariance of ODI with IdC integrity is the primary driver of this pattern. b The strength and direction of the relationship that each measure of isodendritic core microstructure (R1, MTsat, R2*, PD) has with the voxels highlighted in (c) for each measure of white matter microstructure (NDI, ODI or FW). Error bars show 95% confidence intervals from 1000 bootstrapped samples. The midpoint of each bar represents the correlation using the full dataset. Non-significant correlations (confidence intervals overlapping with zero) are faded out. c The yellow voxels indicate a positive relationship with the pattern shown in (b). The blue voxels indicate a negative relationship. Only voxels with a bootstrap ratio of >|2| are colored. These plots can be interpreted as follows: Greater R1 in LC is associated with lower NDI in yellow regions (brainstem efferent tracts) and greater NDI in blue regions (limbic tracts), as the correlation value in (b) is negative. Greater R1 in LC is also associated with greater ODI in yellow regions and lower ODI in blue regions, as the correlation value in (b) is positive. R1 in LC is not associated with FW in this pattern, as the correlation value confidence intervals in (b) overlap with zero. Overall, in this pattern, we see positive associations between R1, MTsat and R2* across all isodendritic core nuclei and ODI in yellow regions (brainstem efferent tracts) and negative associations with ODI in blue regions (limbic tracts). LC locus coeruleus, DR dorsal raphe, VTA ventral tegmental area, NbM nucleus basalis of Meynert, MTsat magnetization transfer saturation, PD proton density, NDI neurite density index, ODI orientation dispersion index, FW free water fraction. Source data are provided as a Source Data file.
Fig. 5
Fig. 5. Scatterplots between CSF pTau181 concentration and PLS brain scores for (a) NDI in pattern 1 and (b) ODI in pattern 2.
NDI neurite density index (orange), ODI Orientation dispersion index (purple). Higher brain scores indicate stronger expression of the covariance pattern. Standardized slope coefficients (β) and p-values are shown on each respective plot. Regression lines are shown with standard error shown in gray. All statistical tests shown were two-tailed. Source data are provided as a Source Data file.
Fig. 6
Fig. 6. PLS results for APOE4 group analysis.
Pie charts (a) show the relative contributions of each NODDI metric to each LV, calculated as a sum of the design scores and expressed as a percentage. The bar charts (b) show the strength and direction of the correlation between each measure of isodendritic core microstructure (R1, MTsat, R2*, PD) with the voxels highlighted in panel c for each measure of white matter microstructure (NDI, ODI, FW). These data are shown separately for APOE4- (left b) and APOE4+ (right b) groups. The yellow voxels highlighted in c indicate a positive relationship with the pattern shown in panel b. The blue voxels indicate a negative relationship. Only voxels in c with a bootstrap ratio of >|2| are colored. Non-significant correlations in b are faded out. Error bars show 95% confidence intervals from 1000 bootstrapped samples. The midpoint of each bar represents the correlation using the full dataset. Here, we see the overall specificity of the first two patterns to the APOE4 positive group and the specificity of the third pattern to the APOE4 negative group. LC locus coeruleus, DR dorsal raphe, VTA ventral tegmental area, NbM nucleus basalis of Meynert, MTsat magnetization transfer saturation, PD proton density, NDI neurite density index, ODI orientation dispersion index, FW free water fraction, LV latent variable. Source data are provided as a Source Data file.

Similar articles

Cited by

References

    1. Ehrenberg, A. J. et al. Priorities for research on neuromodulatory subcortical systems in Alzheimer’s disease: position paper from the NSS PIA of ISTAART. Alzheimer’s Dement.10.1002/alz.12937 (2023). - PMC - PubMed
    1. Engels-Domínguez N, et al. State-of-the-art imaging of neuromodulatory subcortical systems in aging and Alzheimer’s disease: challenges and opportunities. Neurosci. Biobehav. Rev. 2023;144:104998. doi: 10.1016/j.neubiorev.2022.104998. - DOI - PMC - PubMed
    1. Theofilas P, Dunlop S, Heinsen H, Grinberg LT. Turning on the light within: subcortical nuclei of the isodentritic core and their role in Alzheimer’s disease pathogenesis. J. Alzheimers Dis. 2015;46:17–34. doi: 10.3233/JAD-142682. - DOI - PMC - PubMed
    1. Ramón-Moliner E, Nauta WJH. The isodendritic core of the brain stem. J. Comp. Neurol. 1966;126:311–335. doi: 10.1002/cne.901260301. - DOI - PubMed
    1. Wu H, Williams J, Nathans J. Complete morphologies of basal forebrain cholinergic neurons in the mouse. eLife. 2014;3:e02444. doi: 10.7554/eLife.02444. - DOI - PMC - PubMed

MeSH terms