. 2024 Jun 3;15(1):4708.
doi: 10.1038/s41467-024-48819-8.

Longitudinal multicompartment characterization of host-microbiota interactions in patients with acute respiratory failure

Affiliations

Longitudinal multicompartment characterization of host-microbiota interactions in patients with acute respiratory failure

Georgios D Kitsios et al. Nat Commun. .

Abstract

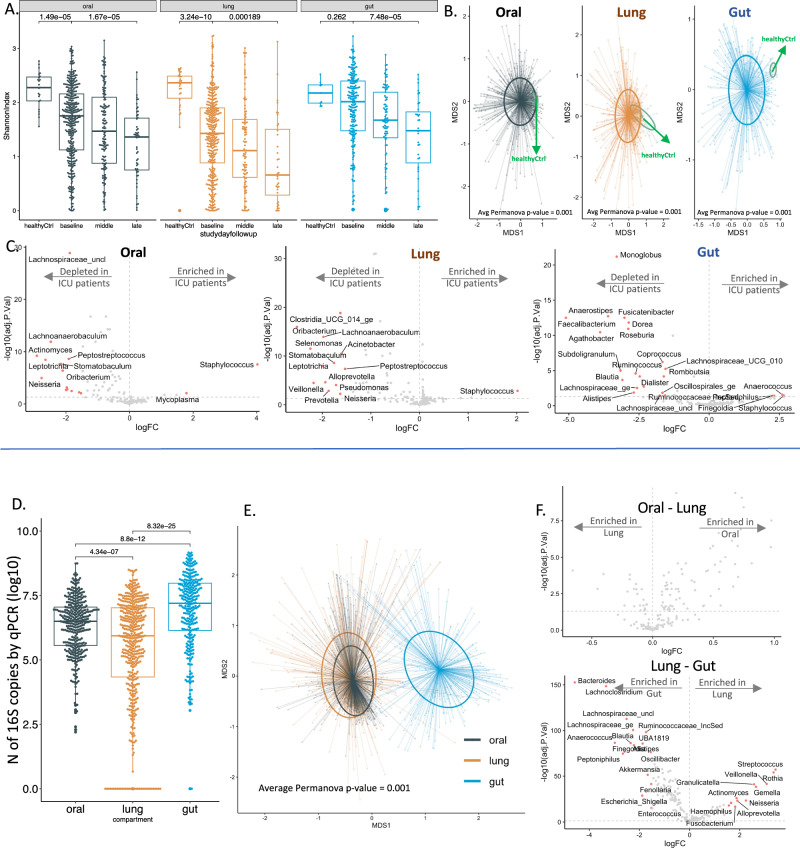
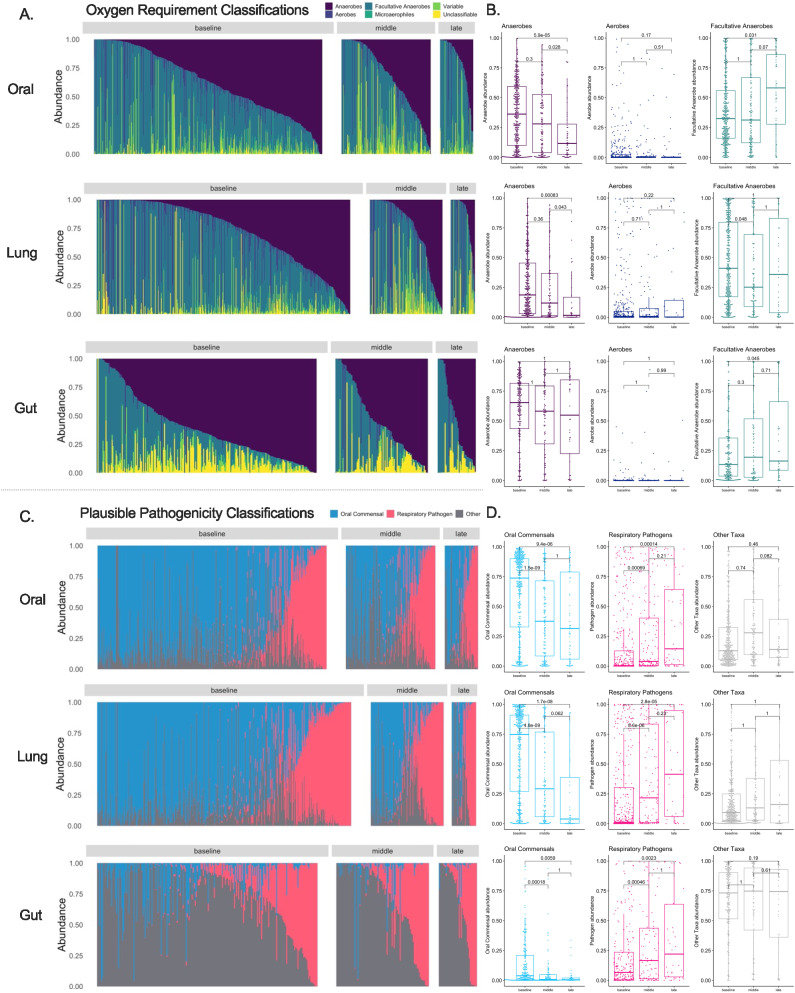
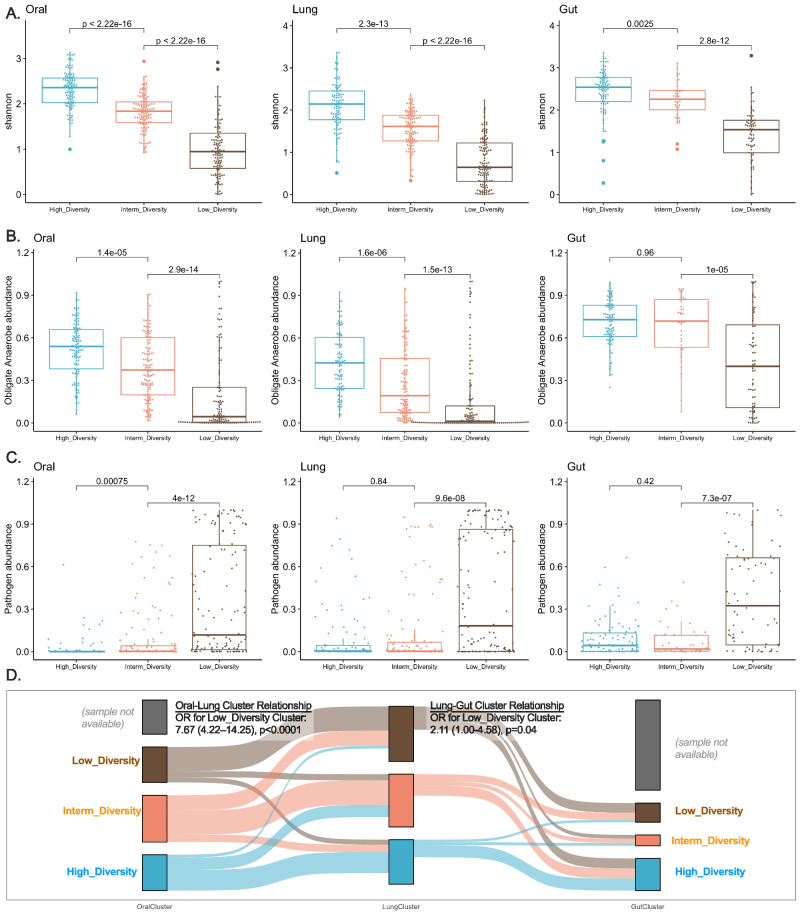
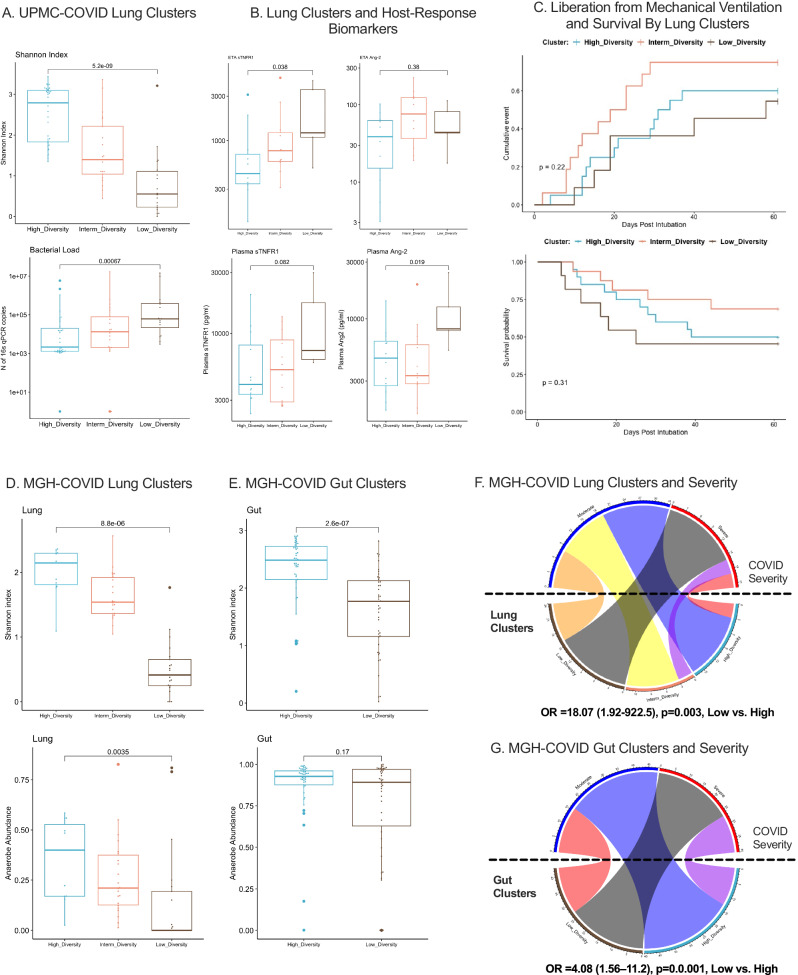
Critical illness can significantly alter the composition and function of the human microbiome, but few studies have examined these changes over time. Here, we conduct a comprehensive analysis of the oral, lung, and gut microbiota in 479 mechanically ventilated patients (223 females, 256 males) with acute respiratory failure. We use advanced DNA sequencing technologies, including Illumina amplicon sequencing (utilizing 16S and ITS rRNA genes for bacteria and fungi, respectively, in all sample types) and Nanopore metagenomics for lung microbiota. Our results reveal a progressive dysbiosis in all three body compartments, characterized by a reduction in microbial diversity, a decrease in beneficial anaerobes, and an increase in pathogens. We find that clinical factors, such as chronic obstructive pulmonary disease, immunosuppression, and antibiotic exposure, are associated with specific patterns of dysbiosis. Interestingly, unsupervised clustering of lung microbiota diversity and composition by 16S independently predicted survival and performed better than traditional clinical and host-response predictors. These observations are validated in two separate cohorts of COVID-19 patients, highlighting the potential of lung microbiota as valuable prognostic biomarkers in critical care. Understanding these microbiome changes during critical illness points to new opportunities for microbiota-targeted precision medicine interventions.


Conflict of interest statement

Dr. Kitsios has received research funding from Karius, Inc, Genentech, Inc, and Pfizer, Inc, all unrelated to this project. Dr. Morris has received research funding from Pfizer, Inc., unrelated to this project. Dr. McVerry has received consulting fees from Boehringer Ingelheim, BioAegis, and Synairgen Research, Ltd. unrelated to this work. All other authors disclosed no conflict of interest.

Figures

Fig. 1
Fig. 1. Intra- and inter-compartment comparisons of microbiota profiles by Illumina 16S-Seq reveal features of dysbiosis in all three body compartments in critically ill patients. Panels A–C: Intra-compartment comparisons between ICU patients and healthy controls.
A Samples from critically ill patients had significantly lower alpha diversity (Shannon index obtained post-rarefication with random subsampling of reads in samples with ≥1000 16S rRNA gene reads) compared to corresponding healthy control samples in each compartment (Wilcoxon test p < 0.001), with a further decline of Shannon index over time in longitudinal samples in critically ill patients (Wilcoxon test p < 0.001). B Baseline samples from critically ill patients had markedly significant differences in beta diversity (Bray-Curtis indices in centered-log ratio transformed [CLR] abundances following random subsampling of reads in samples with ≥ 1000 reads) compared to healthy controls (visualized with Principal Coordinates Analysis [PCoA] and statistically compared with permutational analysis of variance [permanova] p values < 0.001, adjusted for multiple comparisons with the Bonferroni method). C Taxonomic composition comparisons with the limma package showed high effect sizes and significance thresholds (threshold of log2-fold-change [logFC] of CLR-transformed abundances >1.5; Benjamini-Hochberg adjusted p value < 0.05), revealing depletion for multiple commensal taxa in critically ill patients samples, with significant enrichment for Staphylococcus in oral and lung samples, and Anaerococcus and Staphylococcus in gut samples (significant taxa shown in red in the volcano plots). Panels DF: Inter-compartment comparisons among ICU patients. D Lung samples had lower bacterial burden compared to oral and gut samples by 16S rRNA gene qPCR (all Wilcoxon test p < 0.001). E PCoA plot of beta-diversity shows compositional similarity for the oral and lung compartments, which were compositionally dissimilar to gut samples (permanova p < 0.001). F Taxonomic comparisons between compartments revealed that no specific taxa were systematically different between oral and lung microbiota above the threshold of logFC≥1.5, whereas in gut-lung comparisons, lung communities were enriched for typical respiratory commensals (e.g. Rothia, Veillonella, Streptococcus) and gut communities for gut commensals (e.g. Bacteroides, Lachnoclostridium, Lachnospiraceae). Source data are provided as a Source Data file. Displayed data include 583 oral, 543 lung, and 343 gut samples from ICU patients, as well as 23 oral, 32 lung, and 7 gut samples from healthy controls. Data displayed as boxplots with individual dots have their median as the line inside the box, interquartile range (25th–75th percentile) as the box itself, whiskers extend to 1.5 times the interquartile range, and individual dots beyond whiskers signify outlier observations. All statistical tests were two-sided.
Fig. 2
Fig. 2. Longitudinal analysis of bacterial composition showed a progressive loss of obligate anaerobes in oral and lung communities as well as enrichment for recognized respiratory pathogens in all three compartments.
Top Panels (A, B): Relative abundance barplots for oral, lung, and gut samples with the classification of bacterial genera by oxygen requirement into obligate anaerobes (anaerobes), aerobes, facultative anaerobes, microaerophiles, genera of variable oxygen requirement and unclassifiable. Comparisons of centered-log ratio (CLR) transformed relative abundances for the three main categories of bacteria (obligate anaerobes, aerobes, and facultative anaerobes) by follow-up interval (baseline, middle and late). Data in boxplots (B) are represented as individual values of untransformed relative abundances, with their median as the line inside the box, interquartile range (25th–75th percentile) as the box itself, whiskers extend to 1.5 times the interquartile range, and individual dots beyond whiskers signify outlier observations. Comparisons between intervals were done by non-parametric Wilcoxon tests, with p-values adjusted for multiple comparisons by the Bonferroni method. Bottom Panels (C, D): Relative abundance barplots for oral, lung and gut samples with the classification of bacterial genera by plausible pathogenicity into oral commensals, recognized respiratory pathogens, and “other” category. Comparisons of CLR-transformed relative abundances for these categories of bacteria by follow-up interval (baseline, middle, and late) in boxplots (D), with p-values adjusted for multiple comparisons. Source data are provided as a Source Data file. Displayed data include 583 oral, 543 lung, and 343 gut samples from ICU patients. All statistical tests were two-sided.
Fig. 3
Fig. 3. Unsupervised clustering approaches revealed differences in bacterial alpha diversity and composition in three body compartments of critically ill patients.
Panels AD demonstrate bacterial Dirichlet Multinomial Mixture (DMM) modeling results for each compartment separately. DMM clusters had significant differences in alpha diversity (A, Shannon index, derived from all reads in each sample) and composition (obligate anaerobe relative abundance in shown in panel B and pathogen relative abundance shown in panel C, with comparisons performed in abundances post centered-log ratio transformation), with cluster 3 in each compartment showing very low Shannon Index and enrichment for pathogens (Low-Diversity cluster). Oral and lung cluster assignments were strongly associated with each other (Odds ratio for assignment to the Low-Diversity cluster: 7.67 (422–14.25), Fisher’s test p < 0.0001), whereas membership to lung and gut clusters was associated significantly with borderline statistical significance (Fisher’s test p = 0.04, panel D). Source data are provided as a Source Data file. Displayed data include 380 oral, 393 lung, and 216 gut samples from ICU patients obtained at baseline. Data displayed as boxplots with individual dots have their median as the line inside the box, interquartile range (25th–75th percentile) as the box itself, whiskers extend to 1.5 times the interquartile range, and individual dots beyond whiskers signify outlier observations.
Fig. 4
Fig. 4. Lung dysbiosis features and clusters predict 60-day survival.
A, B: Forest plots of effect sizes (point estimates and 95% confidence intervals) for dysbiosis features (Shannon index, bacterial load, anaerobe and pathogen abundance) in three different models: (i) mixed linear regression models with random patient intercepts for the longitudinal change of dysbiosis features during follow-up sampling, (ii) the age-adjusted hazards ratios from Cox-proportional hazards models for the baseline values of each feature on 60-day survival, and (iii) joint-modeling with adjusted beta-coefficient for the effect of each longitudinally-measured feature on survival. Joint modeling showed that pathogen abundance in the oral compartment and anaerobe abundance in the lung compartment had borderline statistically significant effects on 60-day survival. Joint-models for bacterial load by qPCR did not converge due to low number of longitudinal measurements. C. Kaplan-Meier curves for 60-day survival from intubation stratified by oral (A), lung (B) and gut (C) bacterial DMM clusters. The Low-Diversity lung DMM cluster was independently predictive of worse survival (adjusted Hazard Ratio = 2.22 (1.0.7-4.63), Cox regression p = 0.03), following adjustment for age, sex, history of COPD, immunosuppression, severity of illness by sequential organ failure assessment (SOFA) scores and host-response subphenotypes. Longitudinal analysis of lung DMM clusters showed that patients who remained in the low diversity cluster from the baseline to the middle interval (“Low Diversity Persisters”) had significantly worse survival than other patients with available follow-up samples (age-adjusted HR = 2.73 [1.19–6.42], Cox regression p = 0.02). Source data are provided as a Source Data file. Displayed data include 380 oral, 393 lung and 216 gut samples from ICU patients obtained at baseline.
Fig. 5
Fig. 5. Lung and Gut Microbiota Associations with COVID-19 Severity in Two Independent Cohorts.
A Application of the dysbiosis index in lung (ETA) microbiota profiles in the UPMC-COVID cohort classified subjects in three clusters, with significant differences in Shannon index and bacterial load by 16S qPCR. B The low diversity cluster in lung samples from UPMC-COVID subjects was significantly associated with higher ETA levels of sTNFR1 and plasma levels of Ang-2. C COVID-19 patients classified to the low diversity cluster had numerically worse time-to-liberation from invasive mechanical ventilation and survival. D, E Application of the dysbiosis index models in lung (sputum or ETA) and gut (stool) samples in the MGH-COVID cohort classified subjects in three clusters, with significant differences in Shannon index and anaerobe abundance between clusters. F, G Cluster assignments in the MGH cohort were strongly associated with clinical severity. Membership in the Low-Diversity cluster in the lungs was associated with an odds ratio of 18.07 (1.92-922.5) for severe disease (black belt connecting the Low-Diversity cluster and Severe Disease perimetric zones in the chord diagram). Membership in the low diversity gut cluster was also significantly associated with clinical severity of COVID-19 pneumonia (odds ratio of 4.08 [1.56–11.2]). Source data are provided as a Source Data file. Displayed data include 47 baseline lung samples from UPMC-COVID, and 75 baseline lung and 88 stool samples from MGH-COVID cohort. Data displayed as boxplots with individual dots have their median as the line inside the box, interquartile range (25th–75th percentile) as the box itself, whiskers extend to 1.5 times the interquartile range, and individual dots beyond whiskers signify outlier observations.

Update of

Similar articles

Cited by

References

    1. Kitsios GD, Morowitz MJ, Dickson RP, Huffnagle GB, McVerry BJ, Morris A. Dysbiosis in the intensive care unit: Microbiome science coming to the bedside. J. Crit. Care. 2017;38:84–91. doi: 10.1016/j.jcrc.2016.09.029. - DOI - PMC - PubMed
    1. Dickson RP. The microbiome and critical illness. Lancet Respir. Med. 2016;4:59–72. doi: 10.1016/S2213-2600(15)00427-0. - DOI - PMC - PubMed
    1. Kitsios GD, Yang H, Yang L, et al. Respiratory tract dysbiosis is associated with worse outcomes in mechanically ventilated patients. Am. J. Respir. Crit. Care Med. 2020;202:1666–1677. doi: 10.1164/rccm.201912-2441OC. - DOI - PMC - PubMed
    1. Dickson RP, Schultz MJ, van der Poll T, et al. Lung microbiota predict clinical outcomes in critically ill patients. Am. J. Respir. Crit. Care Med. 2020;201:555–563. doi: 10.1164/rccm.201907-1487OC. - DOI - PMC - PubMed
    1. Sulaiman I, Chung M, Angel L, et al. Microbial signatures in the lower airways of mechanically ventilated COVID-19 patients associated with poor clinical outcome. Nat. Microbiol. 2021;6:1245–1258. doi: 10.1038/s41564-021-00961-5. - DOI - PMC - PubMed

MeSH terms

Substances