. 2024 Jun 3;14(1):236.
doi: 10.1038/s41398-024-02962-4.

Analysis of human neuronal cells carrying ASTN2 deletion associated with psychiatric disorders

Affiliations

Analysis of human neuronal cells carrying ASTN2 deletion associated with psychiatric disorders

Yu Hayashi et al. Transl Psychiatry. .

Abstract

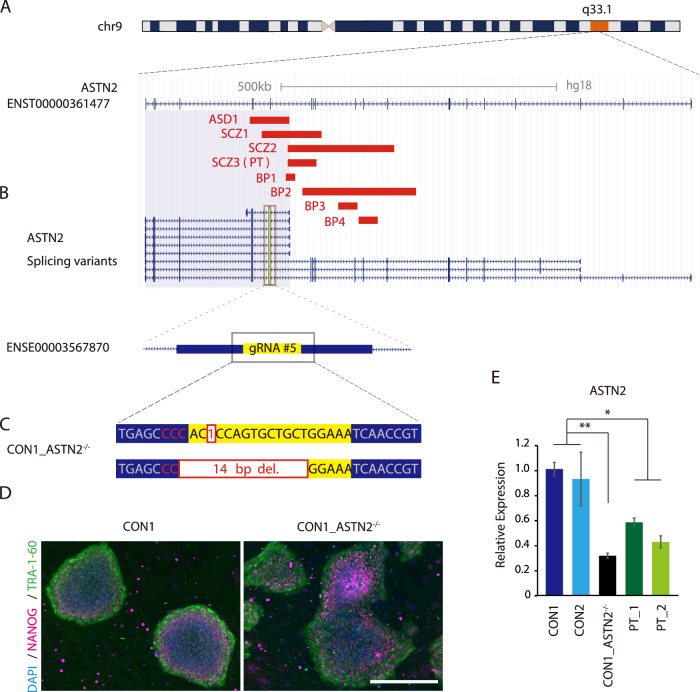
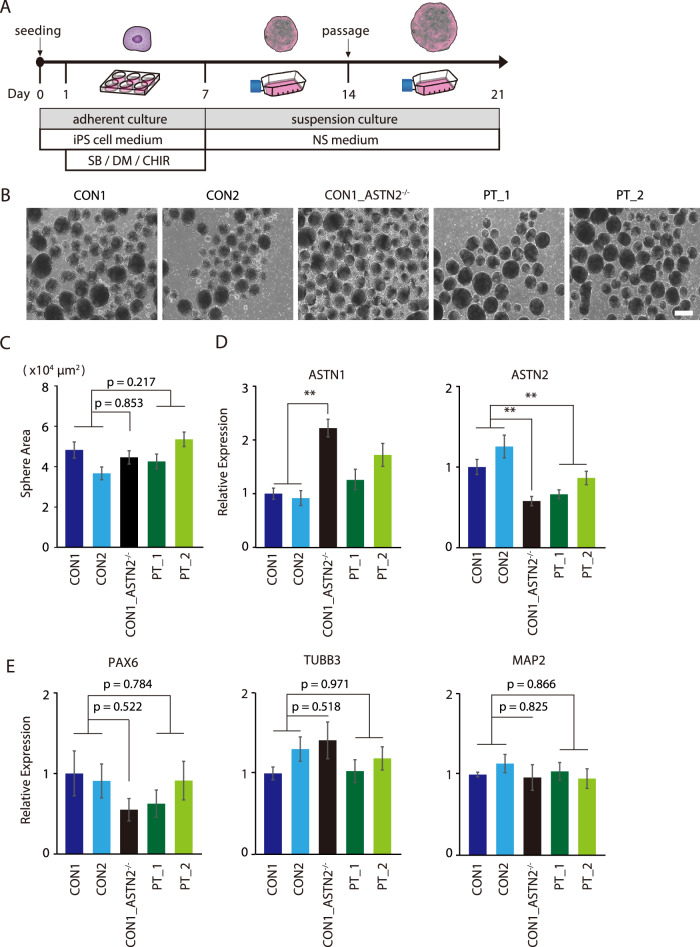
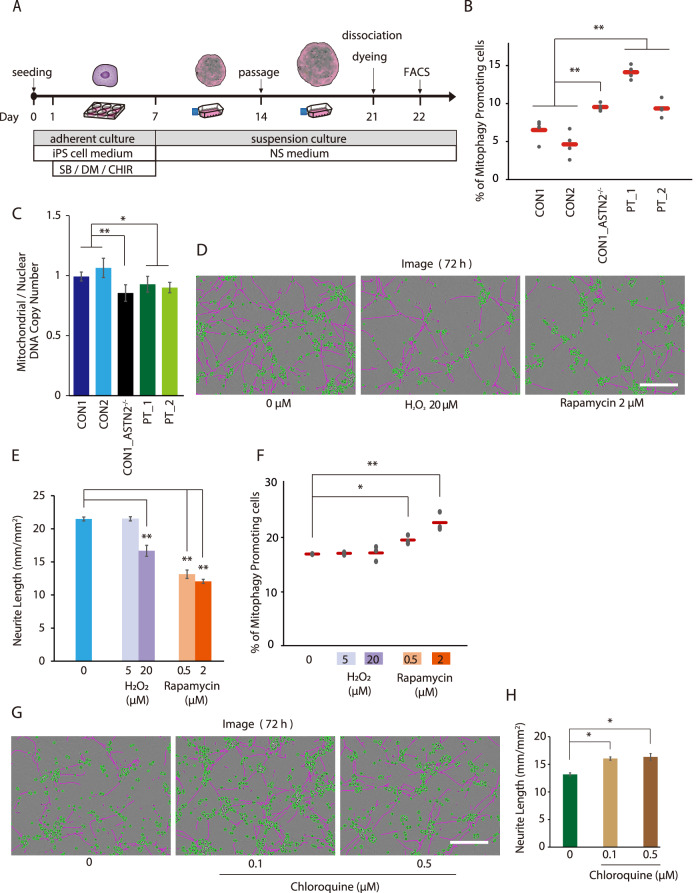
Recent genetic studies have found common genomic risk variants among psychiatric disorders, strongly suggesting the overlaps in their molecular and cellular mechanism. Our research group identified the variant in ASTN2 as one of the candidate risk factors across these psychiatric disorders by whole-genome copy number variation analysis. However, the alterations in the human neuronal cells resulting from ASTN2 variants identified in patients remain unknown. To address this, we used patient-derived and genome-edited iPS cells with ASTN2 deletion; cells were further differentiated into neuronal cells. A comprehensive gene expression analysis using genome-edited iPS cells with variants on both alleles revealed that the expression level of ZNF558, a gene specifically expressed in human forebrain neural progenitor cells, was greatly reduced in ASTN2-deleted neuronal cells. Furthermore, the expression of the mitophagy-related gene SPATA18, which is repressed by ZNF558, and mitophagy activity were increased in ASTN2-deleted neuronal cells. These phenotypes were also detected in neuronal cells differentiated from patient-derived iPS cells with heterozygous ASTN2 deletion. Our results suggest that ASTN2 deletion is related to the common pathogenic mechanism of psychiatric disorders by regulating mitophagy via ZNF558.


Conflict of interest statement

Dr. N. Ozaki has received research support or speakers’ honoraria from or has served as a joint researcher with, or a consultant to, Sumitomo Pharma, Otsuka, Viatris, Eisai, Mochida, Kyowa Pharmaceutical Industry, Nihon Medi-Physics, Nippon Chemiphar, Medical Review, Nippon Boehringer Ingelheim, SUSMED, outside the submitted work.

Figures

Fig. 1
Fig. 1. Establishment of ASTN2-deleted iPS cells using the CRISPR/Cas9 system.
A Diagram of the deleted region of ASTN2 in patients with psychiatric disorders identified by our previous CNV analysis. Red bars show the deletion region in each patient. B Diagram of ASTN2 splicing variants. Exons in yellow are the most upstream exons of those common to all splicing variants. Regions in gray are those that have been previously identified as significantly associated with neurodevelopmental disorders. C The indel pattern of nonhomologous end joining. The red letters represent PAM sequences. D Immunostaining of pluripotent stem cell markers (NANOG and TRA-1-60) in iPS cell lines. The scale bar represents 500 µm. E RT-qPCR analysis of ASTN2 in each iPS cell line. N = 3. Bars represent the mean ± standard error. Multiple comparison was performed using Dunnett’s test. *p < 0.05; **p < 0.01.
Fig. 2
Fig. 2. Differentiation of iPS cell lines into NSs.
A Schematic timeline for NS differentiation from iPS cells. B Phage images of the NS (Day 21) of each cell line. The scale bar indicates 500 µm. C Comparison of NS area in each cell line. N = 50. Bars represent the mean ± standard error. Multiple comparison was performed using Dunnett’s test. D, E Relative mRNA expression levels for ASTN1, ASTN2, PAX6, TUBB3, and MAP2 in NSs (day 21). N = 6. Bars represent the mean ± standard error. Multiple comparison was performed using Dunnett’s test. **p < 0.01.
Fig. 3
Fig. 3. Assessment of neurite outgrowth in pan-neuronal cells derived from NSs by timelapse imaging and immunocytochemistry (ICC).
A Timelapse images of pan-neuronal cell outgrowth of each cell line using IncuCyte ZOOM™ software. Scale bars indicate 200 µm. Green: cell body, Pink: neurite. B Neurite length measured in the indicated time after plating. N = 5. Bars represent the mean ± standard error. Repeated-measure multiple ANOVA method was used for analysis. Moreover, Bonferroni adjustment for multiple comparisons was performed. C Representative ICC images of pan-neuronal cells 72 h after plating. Immunostained for βIII-tubulin and DAPI. The white bars in the image indicate 200 µm. D Measurement of the longest neurite using ICC images. N = 75. Bars represent the mean ± standard error. Multiple comparison was performed using Dunnett’s test. **p < 0.01.
Fig. 4
Fig. 4. Comprehensive gene expression and ChIP-seq analyses identified ZNF558 and SPATA18.
A Differentially expressed genes (protein coding) with fold change >2, Bonferroni correction of p value <0.05. Red/blue indicates genes that have increased/decreased in CON1_ASTN2/− vs. CON1. B Relative mRNA expression level of ZNF558. N = 6. Bars represent the mean ± standard error. Multiple comparison was performed using Dunnett’s test. **p < 0.01. C Number of peaks overlapping between datasets. D Image of called peaks most plausible in each dataset. E Five most significant genes around the peaks called for each ChIP-seq dataset and its distance from TSS. F Relative mRNA expression level of SPATA18. N = 6. Bars represent the mean ± standard error. Multiple comparison was performed using Dunnett’s test. *p < 0.05; **p < 0.01.
Fig. 5
Fig. 5. Analysis of mitophagy in NSs.
A Schematic timeline for flow cytometry analysis. B Results of flow cytometry analysis. N = 4. The red bar indicates the average value. Multiple comparison was performed using Dunnett’s test. **p < 0.01. C MtDNA/nucDNA copy number ratio. N = 6. Bars represent the mean ± standard error. Multiple comparison was performed using Dunnett’s test. *p < 0.05; **p < 0.01. D Representative images of the CON2 cell line with H2O2 or rapamycin. Images were obtained 72 h after plating. Green: cell body, Pink: neurite. The scale bar indicates 200 µm. E Neurite length of the CON2 cell lines 72 h after H2O2 or rapamycin was added. N = 4. Bars represent the mean ± standard error. Multiple comparison was performed using Dunnett’s test. **p < 0.01. F The results of the flow cytometry analysis with the addition of H2O2 or rapamycin. N = 3. Multiple comparison was performed using Dunnett’s test. *p < 0.05; **p < 0.01. G The representative images of the PT cell line with 0.1 µM or 0.5 µM chloroquine. The images were obtained 72 h after plating. Green, cell body; pink, neurite. The scale bar indicates 200 µm. H The neurite length of the PT cell line was 72 h after 0.1 µM or 0.5 µM chloroquine was added (N = 4). The bars represent the mean ± standard error. Multiple comparison was performed using Dunnett’s test. *p < 0.05.
Fig. 6
Fig. 6
Graphical abstract of this research.

Similar articles

Cited by

References

    1. Baba K, Guo WJ, Chen YR, Nosaka T, Kato T. Burden of schizophrenia among Japanese patients: a cross-sectional National Health and Wellness Survey. BMC Psychiatry. 2022;22:410. doi: 10.1186/s12888-022-04044-5. - DOI - PMC - PubMed
    1. Simeone JC, Ward AJ, Rotella P, Collins J, Windisch R. An evaluation of variation in published estimates of schizophrenia prevalence from 1990-2013: a systematic literature review. BMC Psychiatry. 2015;15:193. doi: 10.1186/s12888-015-0578-7. - DOI - PMC - PubMed
    1. Saito M, Hirota T, Sakamoto Y, Adachi M, Takahashi M, Osato-Kaneda A, et al. Prevalence and cumulative incidence of autism spectrum disorders and the patterns of co-occurring neurodevelopmental disorders in a total population sample of 5-year-old children. Mol Autism. 2020;11:35. doi: 10.1186/s13229-020-00342-5. - DOI - PMC - PubMed
    1. Sasayama D, Kuge R, Toibana Y, Honda H. Trends in autism spectrum disorder diagnoses in Japan, 2009 to 2019. JAMA Netw Open. 2021;4:e219234. doi: 10.1001/jamanetworkopen.2021.9234. - DOI - PMC - PubMed
    1. Schendel DE, Thorsteinsson E. Cumulative incidence of autism into adulthood for birth cohorts in Denmark, 1980-2012. JAMA. 2018;320:1811–3. doi: 10.1001/jama.2018.11328. - DOI - PMC - PubMed

MeSH terms