. 2024 Jun 3;15(1):4703.
doi: 10.1038/s41467-024-48364-4.

PPIA dictates NRF2 stability to promote lung cancer progression

Affiliations

PPIA dictates NRF2 stability to promote lung cancer progression

Weiqiang Lu et al. Nat Commun. .

Abstract

Nuclear factor erythroid 2-related factor 2 (NRF2) hyperactivation has been established as an oncogenic driver in a variety of human cancers, including non-small cell lung cancer (NSCLC). However, despite massive efforts, no specific therapy is currently available to target NRF2 hyperactivation. Here, we identify peptidylprolyl isomerase A (PPIA) is required for NRF2 protein stability. Ablation of PPIA promotes NRF2 protein degradation and blocks NRF2-driven growth in NSCLC cells. Mechanistically, PPIA physically binds to NRF2 and blocks the access of ubiquitin/Kelch Like ECH Associated Protein 1 (KEAP1) to NRF2, thus preventing ubiquitin-mediated degradation. Our X-ray co-crystal structure reveals that PPIA directly interacts with a NRF2 interdomain linker via a trans-proline 174-harboring hydrophobic sequence. We further demonstrate that an FDA-approved drug, cyclosporin A (CsA), impairs the interaction of NRF2 with PPIA, inducing NRF2 ubiquitination and degradation. Interestingly, CsA interrupts glutamine metabolism mediated by the NRF2/KLF5/SLC1A5 pathway, consequently suppressing the growth of NRF2-hyperactivated NSCLC cells. CsA and a glutaminase inhibitor combination therapy significantly retard tumor progression in NSCLC patient-derived xenograft (PDX) models with NRF2 hyperactivation. Our study demonstrates that targeting NRF2 protein stability is an actionable therapeutic approach to treat NRF2-hyperactivated NSCLC.


Conflict of interest statement

The authors declare no competing interests.

Figures
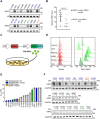
Fig. 1
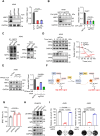
Fig. 1. Identification and validation of Cyclosporin A (CsA) as a chemical inducer of targeted NRF2 protein degradation.
A Representative immunoblot analysis of NRF2 protein levels in nuclear extracts of 17 NSCLC cell lines. B Dot plot showing the relative nuclear NRF2 protein levels in cell lines with KEAP1 and/or KRAS co-mutations (n = 9 cell lines) and in cell lines with KEAP1 and KRAS WT (n = 8 cell lines) related to Fig. 1A. C Overview of the DsRed-IRES-EGFP-NRF2 (RIG-NRF2) screen. CMV, CMV promoter; IRES, Internal ribosome entry site. D Flow cytometry analysis of DsRed and EGFP levels of A549-RIG-NRF2 cells treated with CHX (10 μM), MG132 (10 μM), Ki696 (1 μM), ML334 (50 μM) and CsA (10 μM). The gating strategy are provided in Supplementary Fig. 13. E IC50 values of CsA against a panel of NSCLC cell lines with distinct genetic profile. F Representative immunoblot analysis of NRF2 protein levels in a panel of NSCLC cells upon CsA treatment (10 μM). The results of panels (A, D and F) are representative of three independent experiments. E represents mean ± SD of three independent experiments. P value was analyzed using Two-tailed unpaired Student’s t-test, P < 0.05 was considered statistically significant. Source data are provided as a Source Data file.
Fig. 2
Fig. 2. Peptidylprolyl isomerase A (PPIA) is required for CsA-induced reduction of NRF2 levels and NSCLC cell proliferation.
A Representative immunoblot analysis of NRF2 protein levels in PPIA-WT or PPIA-KO A549 cells. Quantitative data was provided in the right panel. B Representative immunoblot analysis of NRF2 protein levels in PPIA-WT or PPIA KO A549 cells treated with CsA (0, 3, 10 μM) for 48 h. Quantitative data was provided in the right panel. C Immunoprecipitation of NRF2 followed by immunoblot analysis with anti-ubiquitin antibody detected the NRF2 ubiquitination in PPIA-WT and PPIA-KO A549 cells. D CHX chase assay of NRF2 protein stability in PPIA-WT or PPIA-KO A549 cells. Cells were treated with CHX (100 μg/mL) at the indicated time points and then subjected to immunoblot. Quantitative data was provided in the right panel. E Representative immunoblot results demonstrate that PPIA WT, but not PPIA catalytically dead PPIA variant (PPIAR55A&F60A), can restore the NRF2 level in PPIA-KO A549 cells. Quantitative data was provided in the right panel. F Schematic diagram of NanoBRET™ Ubiquitination Assay using the HaloTag®-Ubiquitin and NRF2-NanoLuc® fusion construct. G BRET signal of HEK293T cells transfected with HaloTag®-Ubiquitin and NRF2-Nanoluc® following siPPIA treatment or not. H Immunoprecipitation of NRF2 followed by immunoblot analysis with anti-ubiquitin antibody detected the NRF2 ubiquitination in HEK293T following siPPIA treatment or not. I Relative cell growth of A549 upon PPIA KO or CsA (10 μM) treatment in the presence or absence of NRF2 overexpression. Quantitative results were shown in upper panel and representative colony image was presented in lower panel. C and H are representative of three independent experiments. (AE), G and (I) represent mean ± SD of three independent experiments. P values were analyzed using Two-tailed unpaired Student’s t-test, P < 0.05 was considered statistically significant. Source data are provided as a Source Data file.
Fig. 3
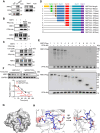
Fig. 3. PPIA directly interacts with NRF2 and P174 of NRF2 is essential for PPIA binding.
A Co-immunoprecipitation analysis of endogenous proteins of PPIA and NRF2 using A549 cell lysates. B Pull-down assay of PPIA WT/NRF2 and PPIAR55A&F60A/NRF2. A549 cell lysate was incubated with PPIA WT or PPIAR55A&F60A pre-loaded beads, and NRF2 protein retained on the beads were detected by immunoblot. C The influence of CsA on the interaction between PPIA and NRF2. A549 cell lysate were incubated with PPIA pre-loaded beads in the presence of CsA (0, 3, 10 μM) and then subjected to pull-down assay. D Schematic diagram of various NRF2 truncation. E The binding of full-length and truncated NRF2 to PPIA as determined by pull-down assay. Various NRF2 truncations were overexpressed in HEK293T cells (as described in D). F CHX chase assay of NRF2 (WT or mutant P174A) protein stability. Cells were treated with CHX (100 μg/mL) at the indicated time points and then subjected to immunoblot (upper panel). Quantitative data was provided in the lower panel. G Crystal structure of PPIA in complex with NRF2 fragment PPIA-Binding Motif (PBM) (169VAQVAPVD176). PBM peptide is deeply embedded into catalytic pocket of PPIA presented as gray surface. 172VAPV175 residues of NRF2 peptide are displayed as slate stick. H Expansion of the catalytic pocket of PPIA in complex with NRF2 fragment PBM. PPIA is shown in gray cartoon and the interacted residues are displayed as salmon sticks. NRF2 PBM fragment is presented as slate sticks. The black dashed line denotes the hydrogen contact. The results of panels (AC, E, F) are representative of three independent experiments. F represents mean ± SD of three independent experiments. P values were analyzed using Two-tailed unpaired Student’s t-test, P < 0.05 was considered statistically significant. Source data are provided as a Source Data file.
Fig. 4
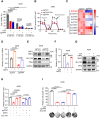
Fig. 4. PPIA inhibition impairs glutamine metabolism in NSCLC cells with NRF2 hyperactivation.
A The cell viability of A549 cells upon CsA (10 μM) treatment or upon PPIA KO in the presence of glutamine (2, 1, 0.5 mM) was measured by MTT assay. Gln, glutamine. B Oxygen consumption rate (OCR) plotted over time in A549 cells following CsA (10 μM) treatment or PPIA KO. C Heatmap showing the mRNA levels of different glutamine membrane transporters in PPIA-WT or PPIA-KO A549 cells. D-E Q-PCR D and immunoblot E analysis of SLC1A5 in PPIA-WT or PPIA-KO A549 cells following NRF2 overexpression. F-G Q-PCR F and immunoblot G results of SLC1A5 in A549 cells treated with CsA (10 μM for 48 h) with or without NRF2 overexpression. H Relative glutamine levels in A549 cells upon CsA (10 μM) treatment or upon PPIA KO, following SLC1A5 or NRF2 overexpression. I A549 cells upon CsA (10 μM) treatment or upon PPIA KO following SLC1A5 overexpression were subjected to colony formation. Quantitative results were shown in upper panel and representative colony image was presented in lower panel. The results of panels (C, E, G) are representative of three independent experiments. A, B, D, F, H and I represent mean ± SD of three independent experiments. P values were analyzed using Two-tailed unpaired Student’s t-test, P < 0.05 was considered statistically significant. Source data are provided as a Source Data file.
Fig. 5
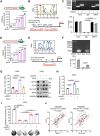
Fig. 5. NRF2 activates SLC1A5 transcription via its downstream gene KLF5.
A pGL3-Luc vector containing human KLF5 promoter (-4,000 to 0 bp) and pCDNA3.1-Flag-NRF2 were co-transfected into HEK293T cells with a ratio of 1:0.5 to 1:8 and luciferase activity was determined. B Analysis of NRF2 consensus motif enrichment in the KLF5 promoter (-4,000 to 0 bp) predicted by JASPAR database. Matched consensus motifs are shown in schematic. C ChIP-PCR analysis of the enrichment of NRF2 at the promoter region of KLF5 in A549 cells. D pGL3-Luc vector containing human SLC1A5 promoter (-500 to +10 bp) and pCDNA3.1-Flag-KLF5 were co-transfected into HEK293T cells with a ratio of 1:0.5 to 1:8 and luciferase activity was determined. E Analysis of KLF5 consensus motif enrichment in the SLC1A5 promoter predicted by JASPAR database. Matched consensus sequences are in bold. F ChIP-PCR analysis of the enrichment of KLF5 at the promoter region of SLC1A5 in A549 cells. G Q-PCR and immunoblot results of SLC1A5 in A549 cells treated with siNRF2 in the presence or absence of KLF5 overexpression. H Relative glutamine level in A549 cells following siNRF2 treatment in the presence or absence of KLF5 overexpression. I Colony formation of A549 cells treated with CsA or siNRF2 in the presence or absence of KLF5 overexpression. Quantitative results were shown in upper panel and representative colony image was presented in lower panel. J Correlation analysis of KLF5/NRF2 or KLF5/SLC1A5 gene expression in clinical NSCLC tumor samples (n = 138 samples). The data are derived from public dataset (GSE8894) and analyzed in PrognoScan. The results of panels (C, F, G) are representative of three independent experiments. A, C, D, F, GI represent mean ± SD of three independent experiments. P values were analyzed using Two-tailed unpaired Student’s t-test, P < 0.05 was considered statistically significant. Source data are provided as a Source Data file.
Fig. 6
Fig. 6. Co-targeting of PPIA and glutaminase potently inhibits tumor growth of NRF2-hyperactivated NSCLC.
A Cell viability of A549 cells treated with CsA (8 μM) and CB-839 (0.08 μM) combination (Com) in presence of 2, 1, 0.5 mM glutamine (Gln). B 3D clonogenic assay of A549-mCherry cells treated with vehicle, CsA, CB-839, or their combination (n = 3 independent experiments). After growing for 2 weeks, formed clones were quantitated by using Image J. The synergistic anti-proliferative effect was evaluated by Combenefit. Blue indicates synergy, while red indicates antagonism between drugs. C Lung orthotopic model was established by tail-vein injection of A549-Luc cells. Mice were divided into four groups (n = 6 mice per group): vehicle control (p.o. twice daily), CB-839 (150 mg/kg, p.o. twice daily), CsA (20 mg/kg, i.p. every 3 days), and CB-839/CsA combination (150 mg/kg, p.o. twice daily; 20 mg/kg, i.p. every 3 days). Bioluminescence imaging was performed every 7 days using a PerkinElmer IVIS Spectrum CT system. D Statistics of lung metastatic nodules in the lung orthotopic model with different treatments (n = 6 mice per group). E Kaplan–Meier survival analysis of different groups in lung orthotopic model formed by tail-vein injection of A549-luc cells (n = 6 mice per group). F, G Tumor growth in NCG mice bearing MT−101 F or WT-201 G PDX xenograft treated with the vehicle (p.o. twice daily), CB-839 (150 mg/kg, p.o. twice daily), CsA (20 mg/kg, i.p. every 3 days), and CB-839/CsA combination (n = 6 mice per group). MT−101 PDX harbors concurrent KEAP1 and KRAS mutations (KEAP1G333C and KRASG12D). WT-201 PDX has KEAP1WT and KRASWT. A represents mean ± SD of three independent experiments. P values were analyzed using Two-tailed unpaired Student’s t-test for A and D, using Log-rank (Mantel-Cox) test for E, and using One-way ANOVA for (F, G). P < 0.05 was considered statistically significant. Source data are provided as a Source Data file.
Fig. 7
Fig. 7. Elevated PPIA and NRF2 accumulation is positively associated with poor prognosis in NSCLC patients.
A Representative immunohistochemical analysis of PPIA and NRF2 in human LUAD tissue microarray containing lung tumor tissues and adjacent normal lung tissues. Scale bar = 50 μm. B Scatter plots showing a positive correlation of PPIA and NRF2 expression in IHC analysis of human NSCLC cancer tissues (n = 69 samples). Linear regression with Pearson R and two-tailed P values are shown. C Kaplan-Meier survival curves of patients with NSCLC divided by high or low PPIA protein expression level according to IHC analysis (n = 69 samples). D Kaplan-Meier survival curves of patients with NSCLC divided by high or low NRF2 protein expression level according to IHC analysis (n = 69 samples). EH Kaplan–Meier survival curves of patients with NSCLC based on PPIA, NRF2, KLF5 and SLC1A5 gene expression level (for PPIA, n = 719 samples; for NRF2, n = 672 samples; for KLF5, n = 719 samples; for SLC1A5, n = 719 samples). Data are integrated from Kaplan–Meier plotter (http://kmplot.com/analysis/). Statistical significance for Kaplan–Meier survival curves (CH) was calculated by Log-rank (Mantel-Cox) test. Source data are provided as a Source Data file.

Similar articles

Cited by

References

    1. Ma Q. Role of nrf2 in oxidative stress and toxicity. Annu Rev. Pharm. Toxicol. 2013;53:401–426. doi: 10.1146/annurev-pharmtox-011112-140320. - DOI - PMC - PubMed
    1. Jaramillo MC, Zhang DD. The emerging role of the Nrf2-Keap1 signaling pathway in cancer. Genes Dev. 2013;27:2179–2191. doi: 10.1101/gad.225680.113. - DOI - PMC - PubMed
    1. Cuadrado A, et al. Therapeutic targeting of the NRF2 and KEAP1 partnership in chronic diseases. Nat. Rev. Drug Discov. 2019;18:295–317. doi: 10.1038/s41573-018-0008-x. - DOI - PubMed
    1. Rojo de la Vega M, Chapman E, Zhang DD. NRF2 and the hallmarks of Cancer. Cancer Cell. 2018;34:21–43. doi: 10.1016/j.ccell.2018.03.022. - DOI - PMC - PubMed
    1. Menegon S, Columbano A, Giordano S. The dual roles of NRF2 in Cancer. Trends Mol. Med. 2016;22:578–593. doi: 10.1016/j.molmed.2016.05.002. - DOI - PubMed

MeSH terms