. 2024 Jun 3;15(6):391.
doi: 10.1038/s41419-024-06773-9.

O-GlcNAcylation controls pro-fibrotic transcriptional regulatory signaling in myofibroblasts

Affiliations

O-GlcNAcylation controls pro-fibrotic transcriptional regulatory signaling in myofibroblasts

Ninon Very et al. Cell Death Dis. .

Abstract

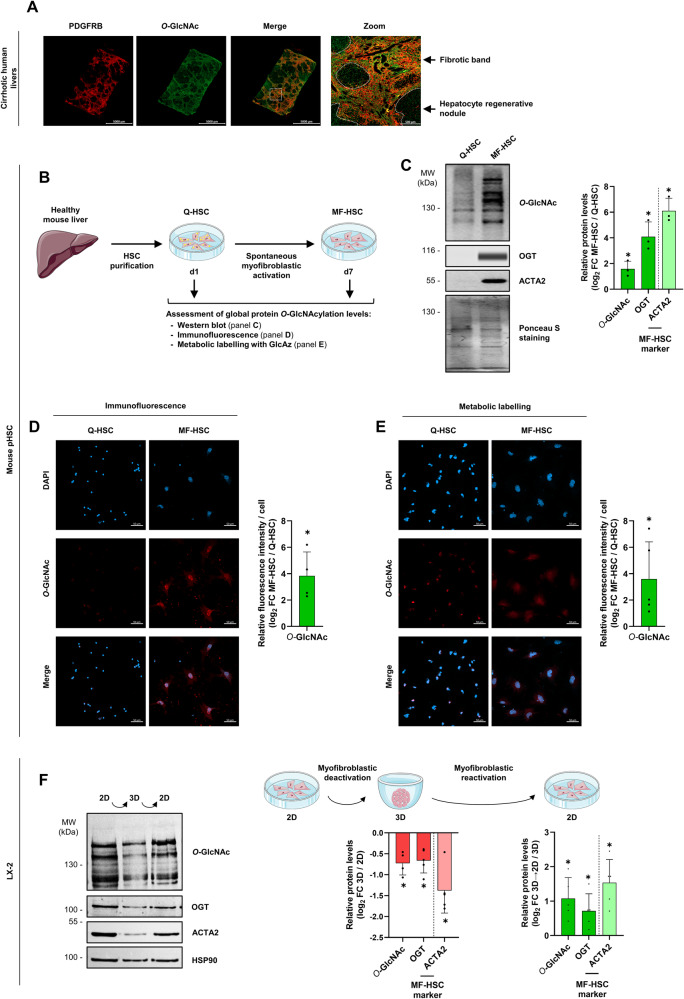
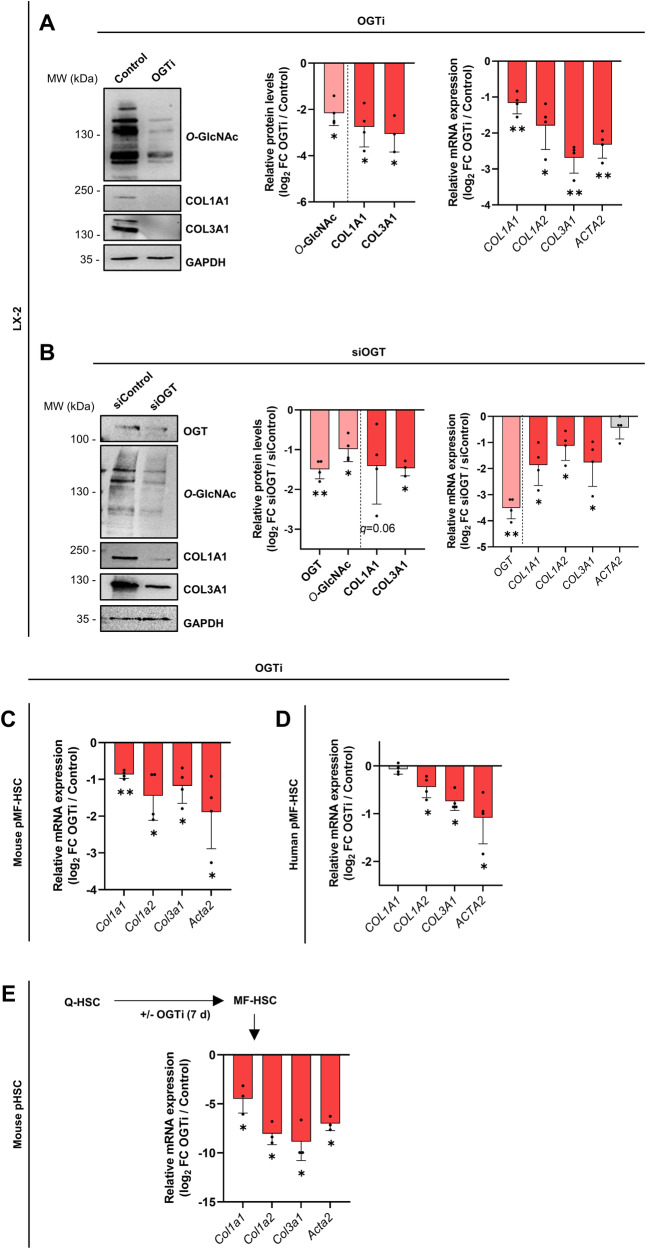
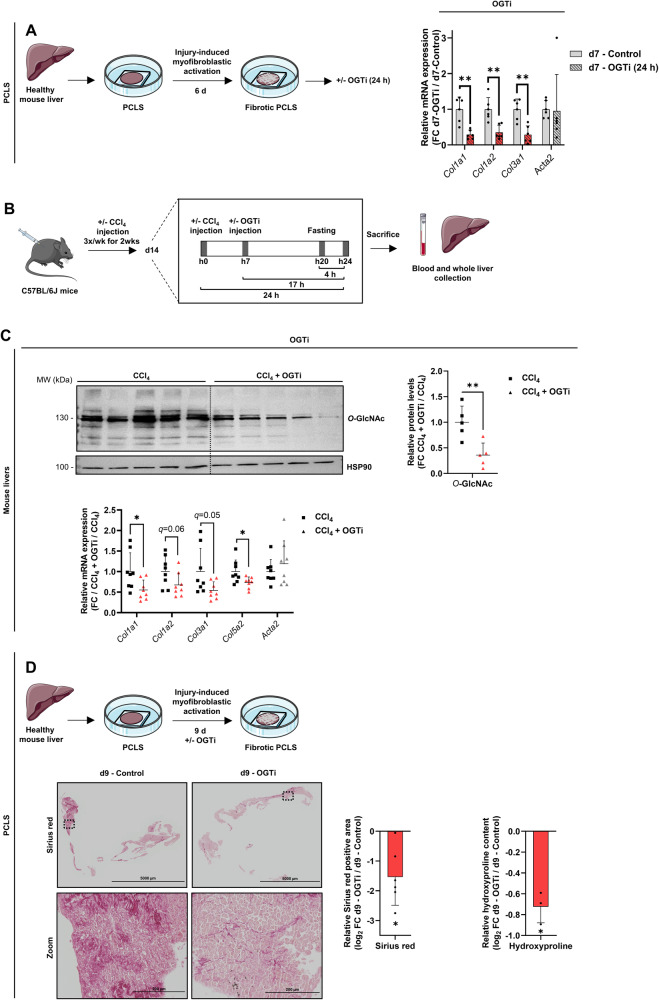
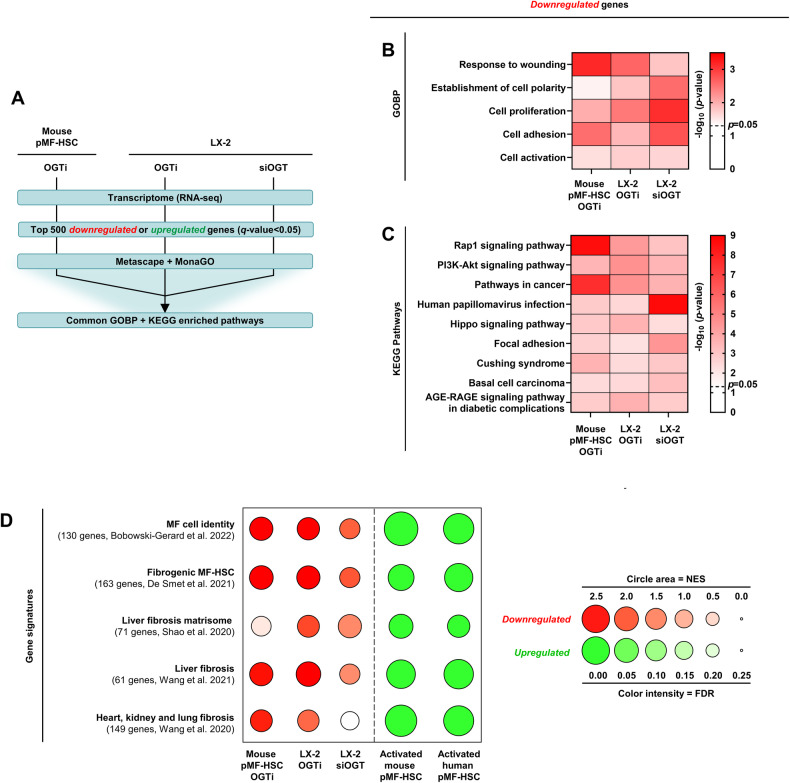
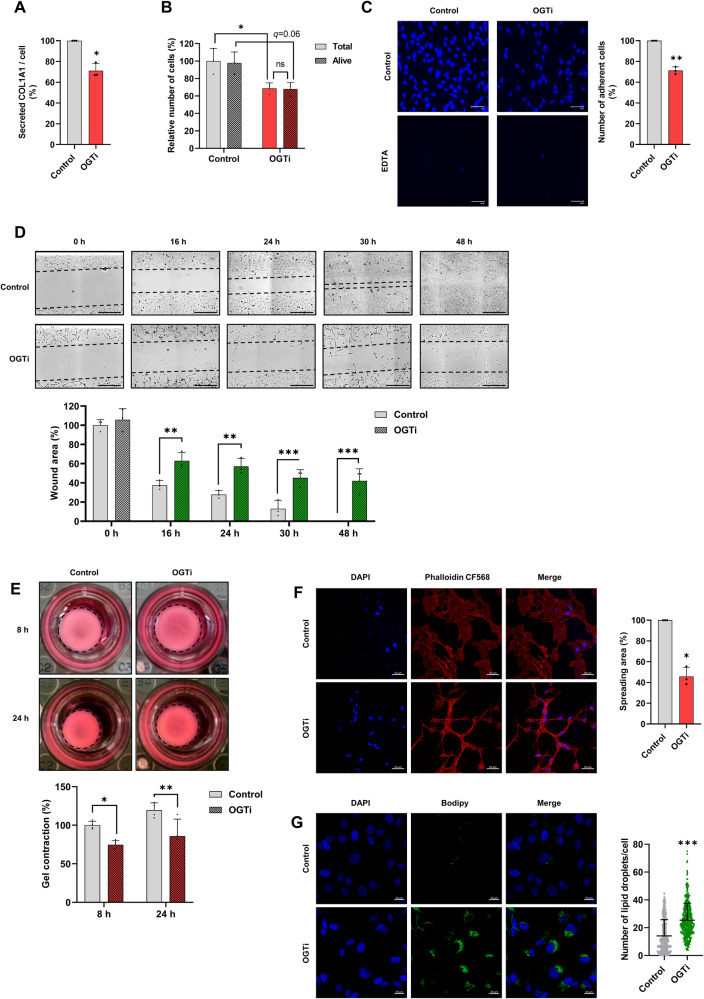
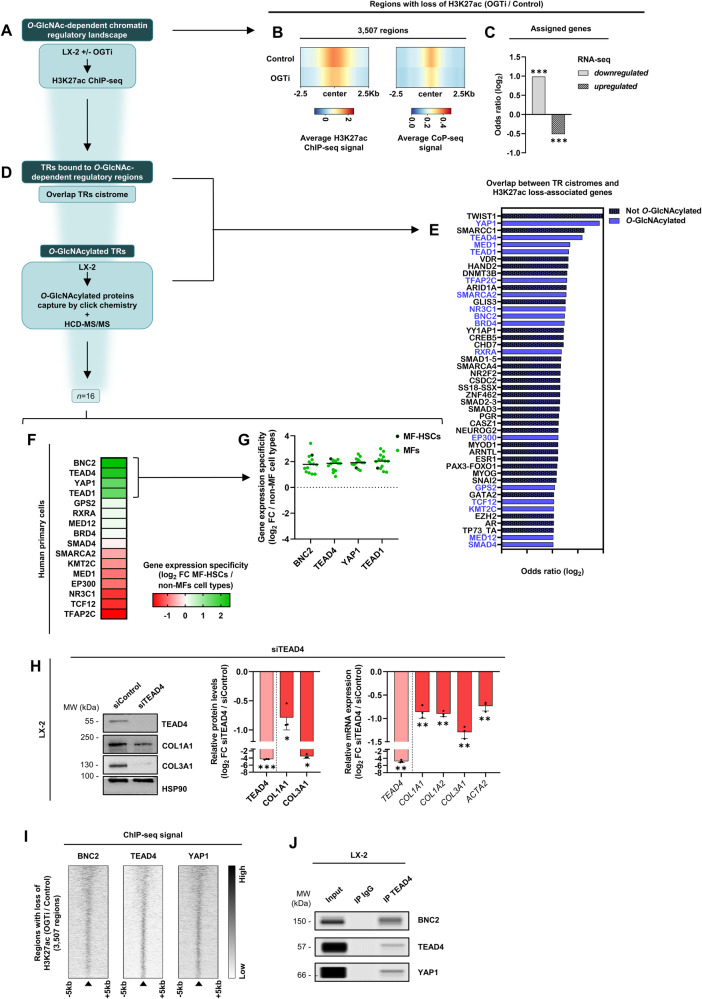
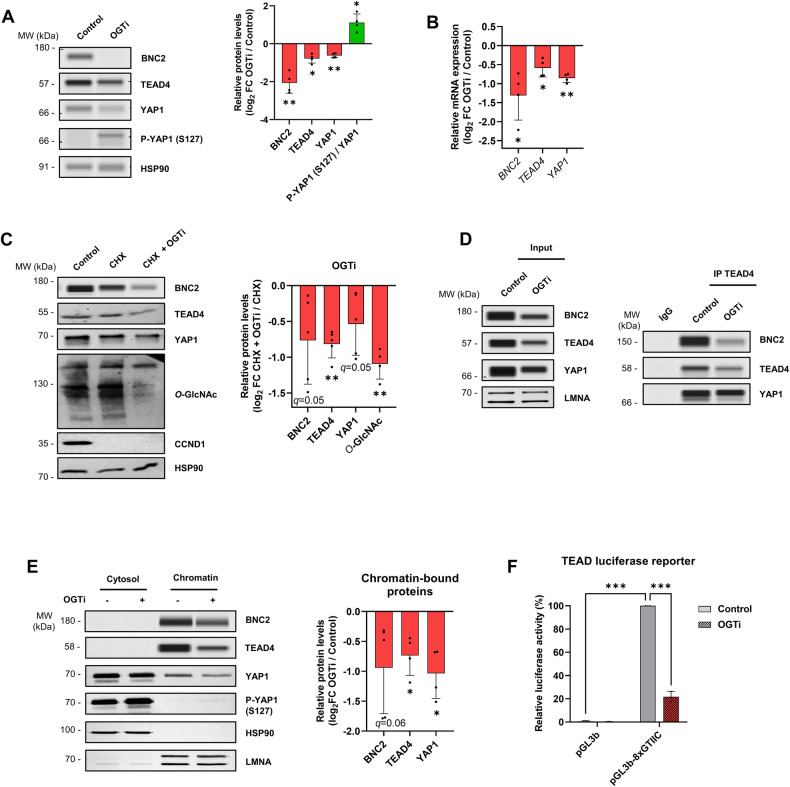
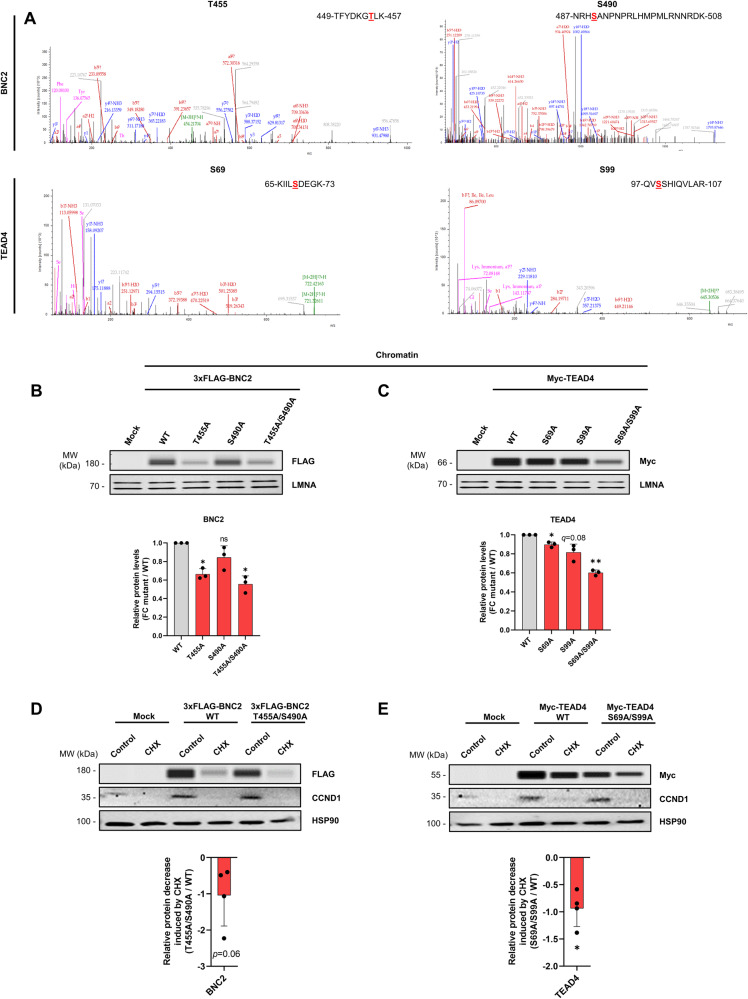
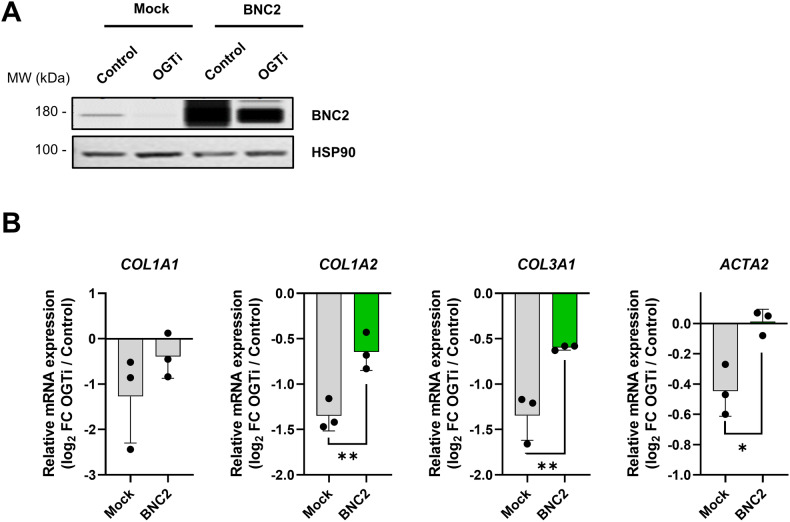
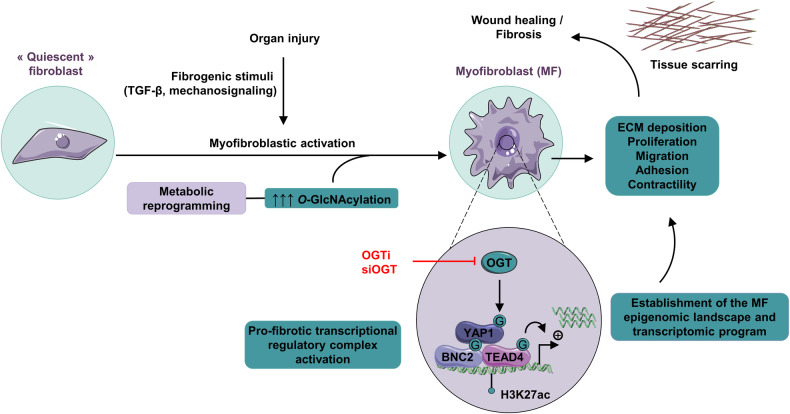
Tissue injury causes activation of mesenchymal lineage cells into wound-repairing myofibroblasts (MFs), whose uncontrolled activity ultimately leads to fibrosis. Although this process is triggered by deep metabolic and transcriptional reprogramming, functional links between these two key events are not yet understood. Here, we report that the metabolic sensor post-translational modification O-linked β-D-N-acetylglucosaminylation (O-GlcNAcylation) is increased and required for myofibroblastic activation. Inhibition of protein O-GlcNAcylation impairs archetypal myofibloblast cellular activities including extracellular matrix gene expression and collagen secretion/deposition as defined in vitro and using ex vivo and in vivo murine liver injury models. Mechanistically, a multi-omics approach combining proteomic, epigenomic, and transcriptomic data mining revealed that O-GlcNAcylation controls the MF transcriptional program by targeting the transcription factors Basonuclin 2 (BNC2) and TEA domain transcription factor 4 (TEAD4) together with the Yes-associated protein 1 (YAP1) co-activator. Indeed, inhibition of protein O-GlcNAcylation impedes their stability leading to decreased functionality of the BNC2/TEAD4/YAP1 complex towards promoting activation of the MF transcriptional regulatory landscape. We found that this involves O-GlcNAcylation of BNC2 at Thr455 and Ser490 and of TEAD4 at Ser69 and Ser99. Altogether, this study unravels protein O-GlcNAcylation as a key determinant of myofibroblastic activation and identifies its inhibition as an avenue to intervene with fibrogenic processes.


Conflict of interest statement

The authors declare no competing interests.

Figures

Fig. 1
Fig. 1. O-GlcNAcylation is increased during myofibroblastic HSC activation.
A Representative images from co-immunostaining for the fibroblast marker PDGFRB (red) and O-GlcNAcylated proteins (green) in paraffin-embedded human liver sections from patients with alcohol-related cirrhosis (n = 10 biologically independent samples). White squares indicate regions for which a zoom image is provided on the right. Scale bars=5,000 µm for images showing entire sections and 500 µm for zoom image. Data obtained with livers from additional donors are shown in Supplementary Fig. 1A. B Graphical representation of experimental set-ups used in panels CE to analyze O-GlcNAcylation in purified quiescent (Q-HSCs at 1 day (d) of culture) and spontaneously in vitro activated myofibroblastic HSCs (MF-HSCs at 7 d of culture). C Western blot and simple western immunoassays showing O-GlcNAcylation, OGT and ACTA2 protein levels in Q-HSCs and MF-HSCs. Ponceau S staining was used as protein loading control. The presented images are representative of 3 biologically independent experiments. MW, molecular weight markers. Log2 fold changes (log2 FC) between MF-HSCs and Q-HSCs are shown. D Immunofluorescence staining of protein O-GlcNAcylation with anti-O-GlcNAc antibody of Q-HSCs and MF-HSCs (shown images are representative of 4 biologically independent experiments). Scale bars=50 µm. Log2 FC between MF-HSCs and Q-HSCs is shown. E Immunofluorescence staining of protein O-GlcNAcylation in Q-HSCs and MF-HSCs revealed by metabolic labeling with GlcAz for 24 h followed by click chemistry with an alkyne-containing dye (shown images are representative of 5 biologically independent experiments). Scale bars = 50 µm. Log2 FC between MF-HSCs and Q-HSCs is shown. F Western blot assays showing O-GlcNAcylation, OGT and ACTA2 protein levels in LX-2 cells cultured in regular 2D conditions or grown as spheroids in 3D conditions for 72 h. A condition where spheroids were digested and cells put back into regular 2D culture plates (3D→2D) for 72 h is also shown. HSP90 was used as protein loading control. The presented images are representative of 5 biologically independent experiments. MW, molecular weight markers. Log2 FC between 3D and 2D cells (left panel), and between 3D→2D and 3D (right panel) are shown on the right. For all panels, the bar graphs show means + standard deviation (SD) together with individual biological replicates. Two-sided one-sample t-test with Benjamini–Hochberg correction for multiple testing was used to determine if the mean log2 FC was statistically different from 0.
Fig. 2
Fig. 2. O-GlcNAcylation is required for expression of fibrogenic collagen encoding genes in isolated MF-HSCs.
A LX-2 cells were treated or not with 50 µM of the OGT inhibitor OSMI-1 (referred to as OGTi) for 24 h. Western blot assays (left panel) and their quantifications (middle panel) of O-GlcNAcylation, COL1A1 and COL3A1 protein levels are shown. GAPDH was used as protein loading control. The presented images are representative of at least three biologically independent experiments. MW, molecular weight markers. RT-qPCR data showing indicated collagen encoding gene expression are also displayed (right panel, n = 4 biologically independent experiments). Log2 FC between OGTi and control (non-treated) conditions are shown. B LX-2 cells were transfected with 20 nM siControl or siOGT for 72 h. Western blot assays (left panel) and their quantifications (middle panel) of OGT, O-GlcNAcylation, COL1A1 and COL3A1 protein levels are shown. GAPDH was used as protein loading control. The presented images are representative of at least three biologically independent experiments. MW, molecular weight markers. RT-qPCR data showing gene expression (right panel, n = 4 biologically independent experiments). Log2 fold changes (log2 FC) between siOGT and siControl conditions are shown. C Mouse pMF-HSCs (7 d of culture) were treated or not with 50 µM OGTi for 24 h (n = 4 biologically independent experiments). RT-qPCR data show indicated collagen encoding gene expression. Log2 FC between OGTi and control (non-treated) conditions are shown. D Human pMF-HSCs were treated or not with 50 µM OGTi for 24 h. RT-qPCR data show indicated collagen encoding gene expression. Log2 FC between OGTi and control (non treated) conditions are shown. E Mouse pQ-HSCs (1 d of culture) were treated or not with 50 µM OGTi for 7 d (n = 3 biologically independent experiments). RT-qPCR data show indicated collagen encoding gene expression. Log2 FC between OGTi and control (non-treated) conditions are shown. For all panels, the bar graphs show means + SD together with individual biological replicates. Two-sided one-sample t-test with Benjamini–Hochberg correction for multiple testing was used to determine if the mean log2 FC was statistically different from 0.
Fig. 3
Fig. 3. O-GlcNAcylation is required for MF-HSC expression of fibrogenic collagen encoding genes in ex vivo and in vivo mouse models of liver injury.
A Mouse PCLS were cultured for 6 d to induce fibrosis and then subjected or not to OGTi (50 µM OSMI-1) for 24 h as depicted in the schematic. Bar graph shows RT-qPCR data monitoring changes in expression of indicated collagen encoding genes (n = 6 PCLS from independent mice). Fold changes (FC) relative to d7 non-treated (d7 – Control; arbitrarily set to 1) are shown. Batch effect was removed by setting the mean of d7 non-treated conditions for each series of experiments, i.e. performed at different times, to 1. One-tailed Mann-Whitney U test with Benjamini-Hochberg correction for multiple testing was used. B Graphical representation of the experimental set-up used to assess the effect of OGTi on CCl4-induced HSC activation in vivo. C57BL/6J mice were injected with olive oil (control mice) or 0.5 mL/kg CCl4 three times a wk for 2 wks. 7 h after the last injection, CCl4 mice were injected (CCl4 + OGTi mice) or not (CCl4 mice) with 1 mg OGTi for 17 h. C Western blot assays and their quantifications showing O-GlcNAcylation levels in livers of CCl4 (n = 5 mice) and CCl4 + OGTi mice (n = 5 mice; top). HSP90 was used as protein loading control. Bar graph at the bottom shows RT-qPCR data monitoring changes in collagen encoding gene expression in livers of mice treated with CCl4 (n = 8 mice) versus those treated with CCl4 + OGTi (n = 8 mice). FC between mice of the CCl4 + OGTi and CCl4 group (arbitrarily set to 1) are shown. One-tailed Mann-Whitney U test with Benjamini-Hochberg correction for multiple testing was used to assess the statistical significance of differences between the CCl4 + OGTi and CCl4 groups. D Mouse PCLS were cultured for 9 d to induce fibrogenic collagen deposition in presence or not of 50 µM OGTi as depicted in the schematic (top panel). Sirius red staining was performed to monitor collagen deposition (shown images are representative of n = 6 PCLS from independent mice, bottom left panel). Scale bars = 5000 µm for images showing entire sections and 200 µm for zoom image. Log2 FC between OGTi and control conditions are shown for relative Sirius red positive areas (bottom middle panel) and hydroxyproline content (n = 3 PCLS from independent mice, bottom right panel). Two-sided one-sample t-test was used to determine if the mean log2 FC was statistically different from 0. For all panels, the graphs show means + SD together with individual biological replicates or mice.
Fig. 4
Fig. 4. O-GlcNAcylation controls the MF transcriptomic program.
A Outline of the strategy used to define the role of protein O-GlcNAcylation in the control of the MF-HSC transcriptome. RNA-seq was performed on mouse pMF-HSCs (7 d of culture; n = 4 biologically independent experiments) and LX-2 cells (n = 4 biologically independent experiments) treated or not with OGTi (50 µM OSMI-1) for 24 h as well as LX-2 cells transfected or not with 20 nM siOGT for 72 h (n = 3 biologically independent experiments). For each one of the three models and spontaneous in vitro activation of murine [49] and human [50] pHSCs, pathway enrichment analyses (B, C) and GSEA (D) and were performed. B, C GO Biological Process (GOBP; B) and KEGG Pathway (C) enrichment analyses were performed using the top 500 downregulated genes upon treatment with OGTi or siOGT (see “Materials and methods” section) using Metascape. Enriched GOBP terms were clustered according to the Resnik similarity using MonaGO. Heatmaps show pathways commonly enriched in RNA-seq data from all three models. D Dot plot depicting the results of GSEA performed using MF cell identity [6], fibrogenic MF-HSCs [45], liver fibrosis matrisome [46], liver fibrosis [47] and heart, kidney and lung fibrosis [48] gene sets. Circle areas are proportional to the normalized enrichment score (NES), while color intensity indicates the false discovery rate (FDR). Red color indicates a negative NES (gene signature biased toward downregulated genes upon treatment with OGTi or siOGT), green color indicates a positive NES (gene signature biased toward upregulated genes upon in vitro activation of pHSCs) and white color indicates a lack of significance.
Fig. 5
Fig. 5. O-GlcNAcylation controls myofibroblastic activities of MF-HSCs.
A LX-2 cells were treated or not with OGTi (50 µM OSMI-1) for 24 h. Secreted COL1A1 was measured in the supernatant by ELISA and is reported relative to the number of cells evaluated by TC20 Automated Cell Counter (n = 3 biologically independent experiments). Secreted COL1A1 per cell is shown relative to that in the control (non-treated) condition arbitrarily set to 100. Two-sided one-sample t-test was used to determine if the mean log2 fold changes (log2 FC) between OGTi and control conditions were statistically different from 0. B LX-2 cells were treated as in A and number of total and alive (trypan blue-negative) cells were counted (n = 3 biologically independent experiments). Number of cells is shown relative to that in the control (total non-treated) condition arbitrarily set to 100. Two-way ANOVA with Sidak multiple comparison post-hoc test was used. ns, not significant. C LX-2 cells were treated as in A and Hoescht 33258 staining of adherent cells was performed to assess binding to collagen-coated matrix (shown images are representative of 3 biologically independent experiments). EDTA treatment was used a control of signal specificity. Scale bars = 50 µm. Number of adherent cells is shown relative to that in the control (non-treated) condition arbitrarily set to 100. Two-sided one-sample t-test was used to determine if the mean log2 FC between OGTi and control conditions was statistically different from 0. D LX-2 cells were grown to confluence, treated or not with 50 µM OGTi upon insert removal (shown images are representative of three biologically independent experiments) and wound area was measured 0, 16, 24, 30, and 48 h later. Scale bars = 300 µm. Wound area width is shown relative to that at of the control (non-treated) condition at 0 h arbitrarily set to 100. Two-way ANOVA with Sidak multiple comparison post-hoc test was used to assess the statistical significance of differences between the OGTi and control conditions. E. LX-2 cells were grown into a collagen matrix gel and treated or not with 50 µM OGTi for 16 h. Collagen gel contraction was defined by measuring the gel diameter (see “Materials and methods” section) 8 h and 24 h after release from the well (shown images are representative of 4 biologically independent experiments). Gel contraction is shown relative to that in the control (non-treated at 8 h) condition arbitrarily set to 100. Two-way ANOVA with Sidak multiple comparison post-hoc test was used to assess the statistical significance of differences between the OGTi and control conditions. F LX-2 cells were treated as in A and fluorescence staining of F-actin stress fibers was performed with CF® 568-conjugated phalloidin (shown images are representative of three biologically independent experiments). Scale bars=50 µm. Spreading area is shown relative to that in the control condition arbitrarily set to 100. Two-sided one-sample t-test was used to determine if the mean log2 FC between OGTi and control conditions were statistically different from 0. G LX-2 cells were treated as in A and fluorescence staining of lipid droplets was performed with BODIPY (shown images are representative of 3 biologically independent experiments). Scale bars = 20 µm. Number of lipid droplets per cell is shown (n = 150 cells per condition were counted in each replicate, i.e., n = 450 cells per condition were counted in total). Unpaired non-parametric Mann–Whitney test was used to assess if the difference between OGTi- and non-treated cells was statistically significant. For all panels, the graphs show means + SD together with individual biological replicates or cells.
Fig. 6
Fig. 6. Multi-omic analyses reveal a role for O-GlcNAcylation in controlling the myofibroblastic transcriptional regulatory landscape.
A Identification of transcriptional regulatory regions decommissioned upon treatment with OGT inhibitor OSMI-1 (referred to as OGTi) in LX-2 cells using mining of H3K27ac ChIP-seq data. B Characterization of O-GlcNAcylation-dependent transcriptional regulatory regions. Average H3K27ac ChIP-seq (n = 4 biologically independent experiments) and CoP-seq signals from LX-2 cells treated or not with 50 µM OGTi for 24 h. Heatmaps show the signals in ±2.5 kb windows around the center of regions identified as displaying a significant loss of H3K27ac in OGTi-treated cells (n = 3,507 regions). C Association between transcriptional regulatory regions losing H3K27ac (from B) and deregulated genes (RNA-seq from Fig. 4) in OGTi-treated LX-2 cells displayed as log2 Odds ratio. See “Materials and methods” section for the procedure used to assign H3K27ac regions to genes. Two-sided Fisher’s exact test was used to assess the statistical significance of the biased association with down- or upregulated genes. D Identification of TRs bound to O-GlcNAc-dependent regulatory regions (i.e. comparison of a database of TR cistromes with regions showing significant loss of H3K27ac in OGTi-treated cells) was performed along with identification of O-GlcNAcylated TRs in LX-2 cells using a click chemistry-based approach coupled to mass spectrometry as described in the “Materials and methods” section (n = 3 biologically independent experiments). E. TRs whose cistrome significantly overlaps with regions losing H3K27ac upon OGTi treatment of LX-2 cells were retrieved as detailed in the “Materials and methods” section and are reported here. Those identified in the LX-2 O-GlcNAcome were further highlighted in blue. F The 16 O-GlcNAcylated TRs (from E) were ranked according to their specificity of expression in MF-HSCs defined as log2 fold changes (log2 FC) in MF-HSCs compared to average expression in 112 other human non-MFs primary cell types. G. Specific expression of BNC2, TEAD4, YAP1 and TEAD1 in MFs is shown using log2 FC in MF-HSCs or MFs (n = 13) compared to average expression in 112 other human non-MFs primary cell types. H LX-2 cells were transfected with 20 nM siTEAD4 or siControl and cells were harvested 72 h later. Western blot assays (left panel) and TEAD4, COL1A1 and COL3A1 protein levels quantifications (middle panel) are shown. HSP90 was used as protein loading control. The presented images are representative of 3 biologically independent experiments. MW, molecular weight markers. The right graph shows RT-qPCR data (n = 3 biologically independent experiments). Log2 FC between siTEAD4 and siControl conditions are shown. The bar graph shows means + SD together with individual biological replicates. Two-sided one-sample t-test with Benjamini-Hochberg correction for multiple testing was used to determine if the mean log2 fold changes (log2 FC) were statistically different from 0. I. Heatmaps show the average BNC2, TEAD4 (LX-2 cells) as well as YAP1 (IMR90 cells) ChIP-seq signals in ±5 kb windows around the center of regions identified as displaying a significant loss of H3K27ac in OGTi-treated cells (n = 3507 regions from B). J Nuclear extracts from LX-2 cells were subjected to immunoprecipitation with an antibody against TEAD4 (ab58310, Abcam). Input and immunoprecipitated materials were analyzed by simple western immunoassay using antibodies directed against BNC2, TEAD4, and YAP1. The presented data are representative of two biologically independent experiments.
Fig. 7
Fig. 7. O-GlcNAcylation controls the myofibroblastic BNC2/TEAD4/YAP1 transcriptional regulatory complex.
A LX-2 cells were treated or not with 50 µM of the OGT inhibitor OSMI-1 (referred to as OGTi) for 24 h. Western blot assays and their quantifications of BNC2, TEAD4, YAP1, and phospho-YAP1 (S127) protein levels are shown. HSP90 was used as protein loading control. The presented images are representative of 4 biologically independent experiments. MW, molecular weight markers. Log2 fold changes (log2 FC) between OGTi treatment and control conditions (right panel) are shown. Two-sided one-sample t-test with Benjamini–Hochberg correction for multiple testing was used to determine if the mean log2 FC between OGTi and control conditions was statistically different from 0. B LX-2 cells were treated as in A. RT-qPCR was used to monitor gene expression (n = 4 biologically independent experiments). Log2 FC between OGTi treatment and control conditions are shown. Two-sided one-sample t-test with Benjamini–Hochberg correction for multiple testing was used to determine if the mean log2 FC between OGTi and control conditions was statistically different from 0. C. LX-2 cells were pre-treated with 20 µg/mL cycloheximide (CHX) for 1 h and then treated with CHX combined or not with OGTi (50 µM OSMI-1) for an additional 24 h. Western blot and simple western immunoassays for BNC2, TEAD4, YAP1, CCND1, and protein O-GlcNAcylation levels together with quantifications of BNC2, TEAD4, YAP1, and O-GlcNAcylation levels are shown. HSP90 was used as protein loading control. The presented images are representative of at least 4 biologically independent experiments. MW, molecular weight markers. Log2 FC between CHX + OGTi and CHX conditions are shown. Two-sided one-sample t-test with Benjamini-Hochberg correction for multiple testing was used to determine if the mean log2 FC between CHX + OGTi and CHX conditions was statistically different from 0. D LX-2 cells were treated as in A. Nuclear extracts were subjected to immunoprecipitation with an antibody against TEAD4 (ab58310, Abcam). Input and immunoprecipitated materials were analyzed by western blot and simple western immunoassay using antibodies directed against BNC2, TEAD4, or YAP1. LMNA was used as protein loading control. The presented data are representative of two biologically independent experiments. E LX-2 cells were treated as in A and sub-cellular fractionation was performed to obtain cytosolic and chromatin fractions. Western blot and simple western immunoassays of BNC2, TEAD4, YAP1, and P-YAP1 (S127) levels and quantifications of chromatin-bound BNC2, TEAD4 and YAP1 are shown. HSP90 and LMNA were used as protein loading controls. The presented images are representative of at least 4 biologically independent experiments. MW molecular weight markers. Two-sided one-sample t-test with Benjamini–Hochberg correction for multiple testing was used to determine if the mean log2 FC between OGTi and control conditions was statistically different from 0. F LX-2 cells were transfected with a control luciferase reporter vector (pGL3-basic (pGL3b) promoter) or a TEAD-responsive luciferase reporter vector (pGL3b-8xGTIIC-luciferase plasmid) for 68 h and then treated or not with OGTi (50 µM OSMI-1) for an additional 24 h (n = 3 biologically independent experiments). Luciferase activities relative to that obtained with the pGL3b-8xGTIIC untreated (control) condition arbitrarily set to 100 are shown. Two-way ANOVA with Sidak multiple comparison post-hoc test was used. For all panels, the bar graphs show means + SD together with individual biological replicates.
Fig. 8
Fig. 8. O-GlcNAcylation of BNC2 and TEAD4 regulates their stability and chromatin binding.
A LX-2 cells were treated with 2 µM Thiamet-G for 24 h before BNC2 and TEAD4 immunoprecipitations followed by HCD mass spectrometry. HCD-MS/MS spectra of peptides covering the T455 and S490 O-GlcNAcylated sites in BNC2 and the S69 and S99 O-GlcNAcylated sites in TEAD4 are shown. The identified O-GlcNAcylated amino-acid residues are indicated in red in the peptide sequence. B, C LX-2 cells were transfected for 24 h with a control plasmid (mock), or plasmids encoding wild-type (WT) or mutated versions of 3x-FLAG-BNC2 (B) and Myc-TEAD4 (C). Sub-cellular fractionation was performed to obtain cytosolic and chromatin fractions used for western blot or simple western immunoassays using anti-FLAG (B) or anti-Myc (C) antibodies. The presented images are representative of three biologically independent experiments. Bar graphs show relative levels of chromatin-bound 3xFLAG-BNC2 (B) and Myc-TEAD4 (C). LMNA was used as protein loading control. Fold changes (FC) relative to WT (arbitrarily set to 1) are shown. Two-sided one-sample t-test with Benjamini-Hochberg correction for multiple testing was used to determine if the mean log2 FC between individual mutants and control was statistically different from 0. MW, molecular weight markers. D, E LX-2 cells were transfected as in B, C and cells were treated or not with 50 µg/mL cycloheximide (CHX) for an additional 24 h. Extracts were analyzed by western blot or simple western immunoassays using anti-FLAG (D), anti-Myc (E) or anti-CCND1 antibodies. The presented images are representative of 4 biologically independent experiments. Bar graphs show quantification of 3xFLAG-BNC2 and Myc-TEAD4 levels. HSP90 was used as protein loading control. Bar graphs show relative protein decrease induced by CHX which were calculated by subtracting the log2 FC CHX / control of double mutants by that of WT proteins. Unpaired t-test was used to assess the statistical significance of differences in log2 FC CHX / control between double mutants and WT proteins. MW, molecular weight markers. For all panels, the bar graphs show means + SD together with individual biological replicates.
Fig. 9
Fig. 9. Forced expression of BNC2 dampens OGTi-mediated decrease in collagen-encoding gene expression in MF-HSCs.
A LX-2 cells were transfected with a control plasmid (mock) or 3x-FLAG-BNC2 encoding plasmid for 24 h. Then, cells were treated or not with 50 µM OSMI-1 (referred to as OGTi) for an additional 24 h and used to prepare extracts analyzed using western blot and simple western immunoassays. BNC2 levels were assessed and HSP90 was used as a protein loading control. The presented images are representative of 3 biologically independent experiments. MW, molecular weight markers. B LX-2 cells were transfected as in A and used for RT-qPCR analyses of indicated gene expression (n = 3 biologically independent experiments). The bar graphs show means + SD together with individual biological replicates. Log2 FC between OGTi and control conditions are shown. Unpaired t-test was used to assess the statistical significance between 3x-FLAG-BNC2 expressing cells and the control (mock) condition.
Fig. 10
Fig. 10. Summary of the key findings of this study.
Schematic depicting how O-GlcNAcylation connects metabolic and transcriptomic reprogramming driving myofibroblastic activation during organ repair or fibrosis by targeting key MF TRs such as BNC2, TEAD4, and YAP1. Notably, O-GlcNAcylation plays a critical role in stabilizing the BNC2, TEAD4, and YAP1 proteins, enabling the assembly of pro-fibrotic transcriptional regulatory complexes required for establishment of the active epigenome and transcriptome of MFs.

Similar articles

Cited by

References

    1. Schuster R, Younesi F, Ezzo M, Hinz B. The role of myofibroblasts in physiological and pathological tissue repair. Cold Spring Harb Perspect Biol. 2023;15:a041231. doi: 10.1101/cshperspect.a041231. - DOI - PMC - PubMed
    1. Rockey DC, Bell PD, Hill JA. Fibrosis-a common pathway to organ injury and failure. N Engl J Med. 2015;372:1138–49. doi: 10.1056/NEJMra1300575. - DOI - PubMed
    1. Distler JHW, Györfi A-H, Ramanujam M, Whitfield ML, Königshoff M, Lafyatis R. Shared and distinct mechanisms of fibrosis. Nat Rev Rheumatol. 2019;15:705–30. doi: 10.1038/s41584-019-0322-7. - DOI - PubMed
    1. Henderson NC, Rieder F, Wynn TA. Fibrosis: from mechanisms to medicines. Nature. 2020;587:555–66. doi: 10.1038/s41586-020-2938-9. - DOI - PMC - PubMed
    1. Pakshir P, Noskovicova N, Lodyga M, Son DO, Schuster R, Goodwin A, et al. The myofibroblast at a glance. J Cell Sci. 2020;133:jcs227900. doi: 10.1242/jcs.227900. - DOI - PubMed

Publication types

Substances

Associated data