. 2024 Jun 3;14(1):12725.
doi: 10.1038/s41598-024-59634-y.

Titers of IgG and IgA against SARS-CoV-2 proteins and their association with symptoms in mild COVID-19 infection

Affiliations

Titers of IgG and IgA against SARS-CoV-2 proteins and their association with symptoms in mild COVID-19 infection

Andrés G Abril et al. Sci Rep. .

Erratum in

Abstract

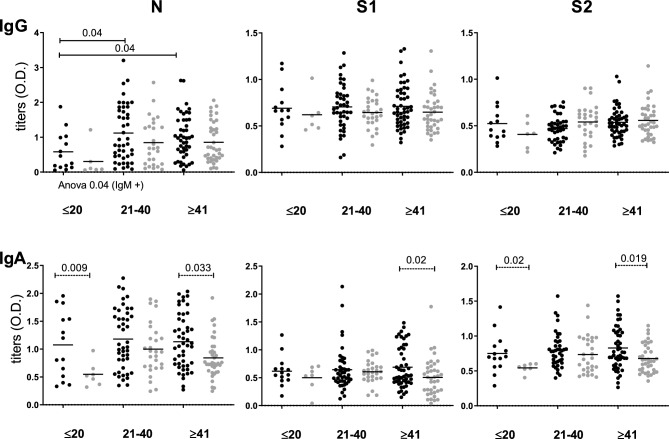
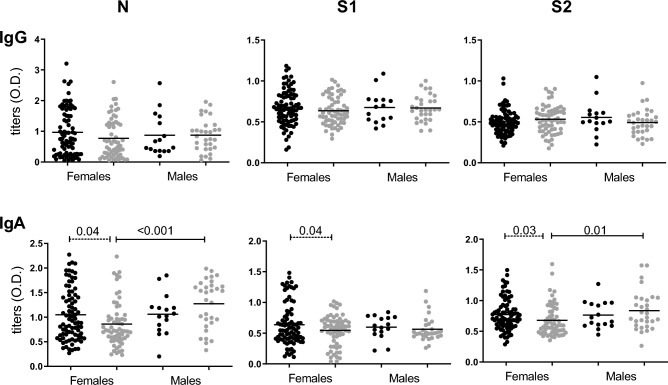
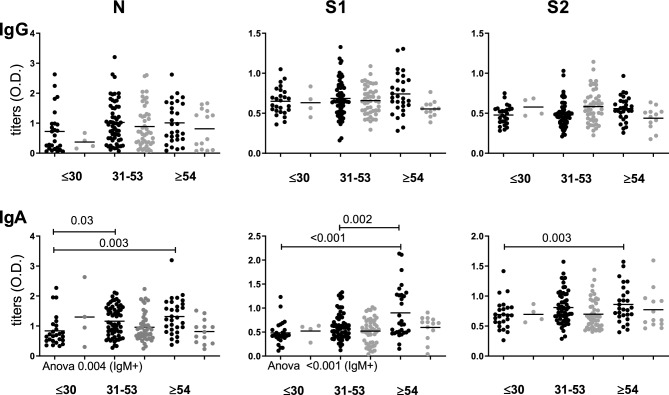
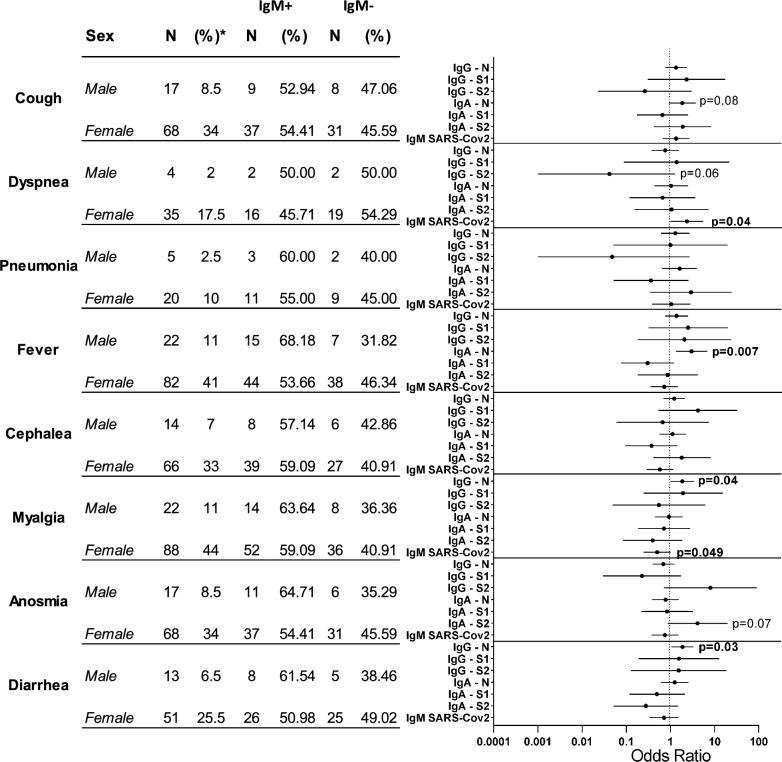
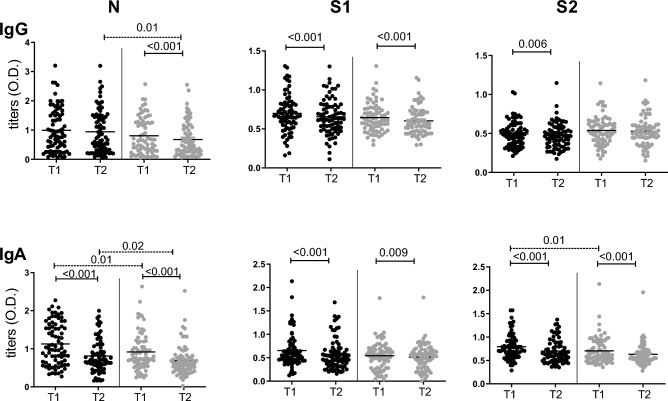
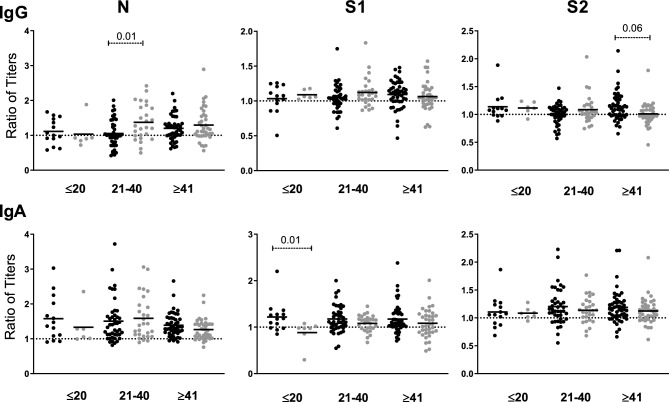
Humoral immunity in COVID-19 includes antibodies (Abs) targeting spike (S) and nucleocapsid (N) SARS-CoV-2 proteins. Antibody levels are known to correlate with disease severity, but titers are poorly reported in mild or asymptomatic cases. Here, we analyzed the titers of IgA and IgG against SARS-CoV-2 proteins in samples from 200 unvaccinated Hospital Workers (HWs) with mild COVID-19 at two time points after infection. We analyzed the relationship between Ab titers and patient characteristics, clinical features, and evolution over time. Significant differences in IgG and IgA titers against N, S1 and S2 proteins were found when samples were segregated according to time T1 after infection, seroprevalence at T1, sex and age of HWs and symptoms at infection. We found that IgM + samples had higher titers of IgG against N antigen and IgA against S1 and S2 antigens than IgM - samples. There were significant correlations between anti-S1 and S2 Abs. Interestingly, IgM + patients with dyspnea had lower titers of IgG and IgA against N, S1 and S2 than those without dyspnea. Comparing T1 and T2, we found that IgA against N, S1 and S2 but only IgG against certain Ag decreased significantly. In conclusion, an association was established between Ab titers and the development of infection symptoms.

Keywords: COVID-19; IgA; IgG; SARS-CoV-2; Seroprevalence.


Conflict of interest statement

The authors declare no competing interests.

Figures

Figure 1
Figure 1
Distribution of IgG and IgA titers according to time since infection (days). Titers were expressed in O.D.. Serum samples from IgM + HWs (black dots) and IgM--—HWs (gray dots) were grouped by time since infection (days) and compared by ANOVA test (significant values are shown under the X axis), followed by correction by the Bonferroni test (significant values shown as bars at the top of each figure). The Mann Whitney test was used to find differences between IgM + HWs titers versus IgM—HWs titers (discontinued lines at the top of each figure). Significant p value < 0.05.
Figure 2
Figure 2
Distribution of IgG and IgA titers according to sex. SARS-CoV-2 Ab titers are expressed as O.D. from serum samples separated by IgM + HWs (black dots) and IgM − HWs (gray dots) and by sex (male vs female). IgM + or IgM—female versus male Ab titers were compared (continuous lines over series with significant p values) by Mann Whitney test; also, IgM + vs IgM − males and females were also compared separately (discontinued lines over series). Significant p value < 0.05.
Figure 3
Figure 3
Distribution of IgG and IgA titers according to age. Titers expressed as O.D. from IgM + HWs (black dots) and IgM—HWs (gray dots) were split into three age groups (years old) and compared by ANOVA (significant values are shown under x axis) followed by post hoc Bonferroni test (significant p values are shown with continuous bars over dots series). Significant p value < 0.05.
Figure 4
Figure 4
Association of symtoms with serology in COVID19. Frequency of symptoms in patients by sex and the presence of IgM anti-SARS-CoV2 and Forest plot of output from the logistic regression model evaluating odds for each symptom. The variables identified in the final model, along with the corresponding odds ratios and confidence intervals, are shown in the figure.
Figure 5
Figure 5
Kinetics of IgG and IgA titers. Titers are expressed O.D. Serum samples from IgM + HWs (black dots) and IgM—HWs (gray dots) were analyzed separately over time. T1 versus T2 are compared by paired T student test (statistically significant p values are indicated over continuous capped lines); also, IgM + HWs versus IgM–HWs Ab titers were compared using Wilcoxon test (discontinuous lines). Significant p value < 0.05.
Figure 6
Figure 6
Distribution of ratios of titers T1/T2 according to time of infection (days). Dots represent the ratio of T1/T2 mean values (cut off value = 1). Values from IgM + HWs (black dots) and IgM—HWs (gray dots) were grouped by time (days) since infection. IgM + vs IgM—HWs titers were compared by Mann Whitney test (significant values are shown over discontinuous lines). Significant p value < 0.05.

Similar articles

Cited by

References

    1. Carrillo J, et al. Humoral immune responses and neutralizing antibodies against SARS-CoV-2; implications in pathogenesis and protective immunity. Biochem. Biophys. Res. Commun. 2021;538:187–191. doi: 10.1016/j.bbrc.2020.10.108. - DOI - PMC - PubMed
    1. Vabret N, et al. Immunology of COVID-19: Current state of the science. Immunity. 2020;52:910–941. doi: 10.1016/j.immuni.2020.05.002. - DOI - PMC - PubMed
    1. Guan WJ, Zhong NS. Clinical characteristics of covid-19 in China. Reply. N. Engl. J. Med. 2020;382:1861–1862. doi: 10.1056/NEJMc2005203. - DOI - PubMed
    1. Wang W, et al. Detection of SARS-CoV-2 in different types of clinical specimens. JAMA. 2020;323:1843–1844. doi: 10.1001/jama.2020.3786. - DOI - PMC - PubMed
    1. Pelleau S, et al. Kinetics of the severe acute respiratory syndrome coronavirus 2 antibody response and serological estimation of time since infection. J. Infect. Dis. 2021;224:1489–1499. doi: 10.1093/infdis/jiab375. - DOI - PMC - PubMed

MeSH terms