. 2024 Jun 3;7(1):676.
doi: 10.1038/s42003-024-06384-2.

Compound heterozygous mutations in a mouse model of Leber congenital amaurosis reveal the role of CCT2 in photoreceptor maintenance

Affiliations

Compound heterozygous mutations in a mouse model of Leber congenital amaurosis reveal the role of CCT2 in photoreceptor maintenance

Akiko Suga et al. Commun Biol. .

Abstract

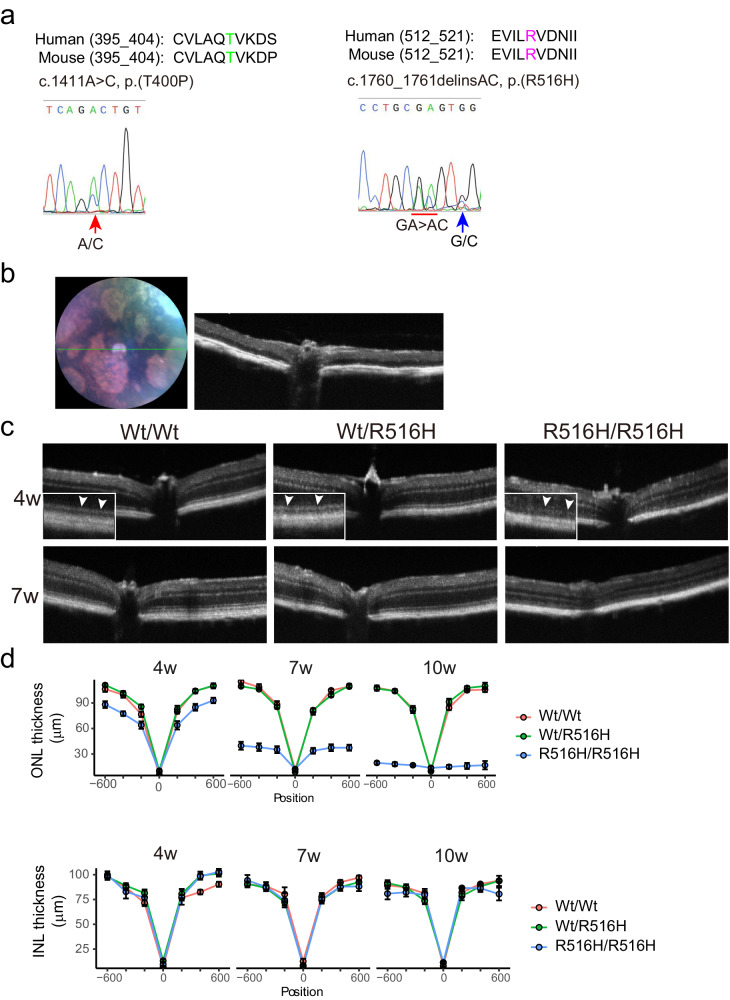
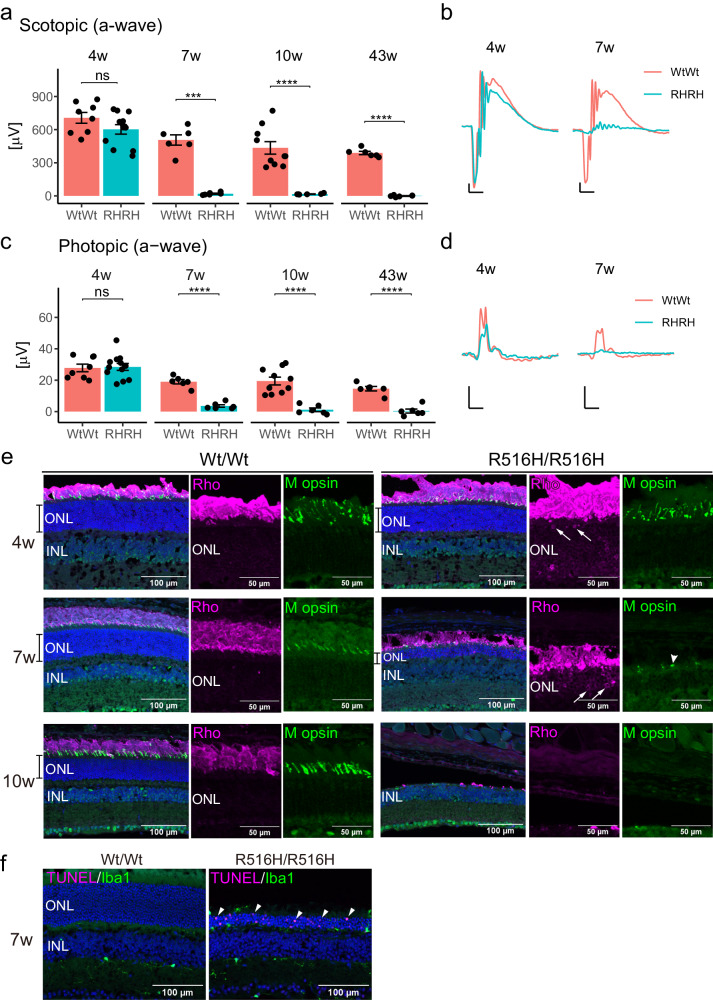
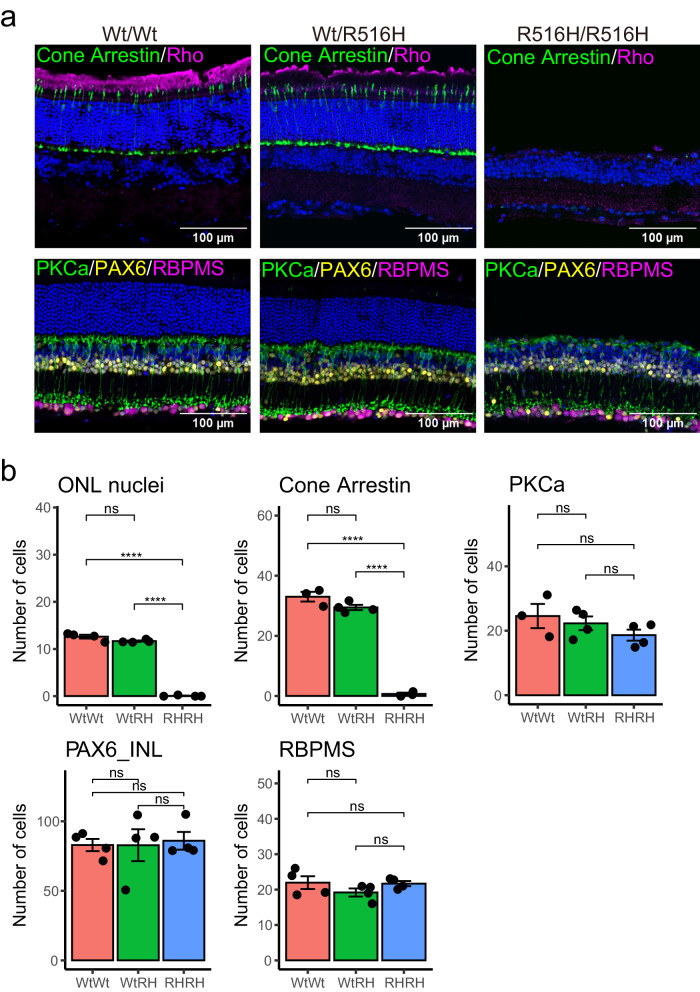
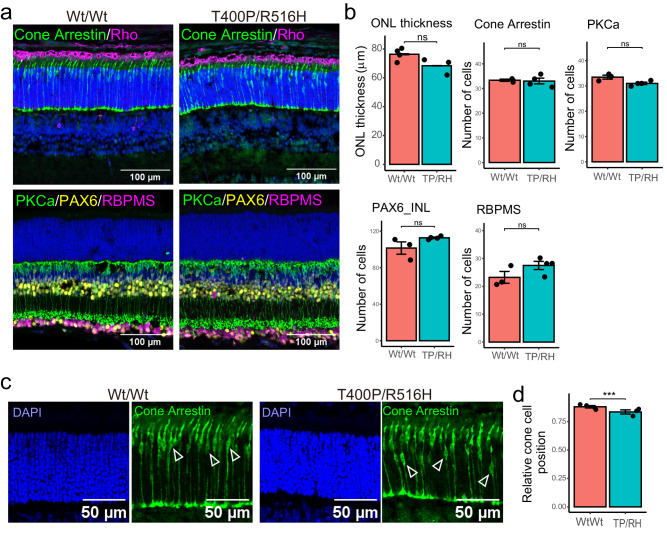
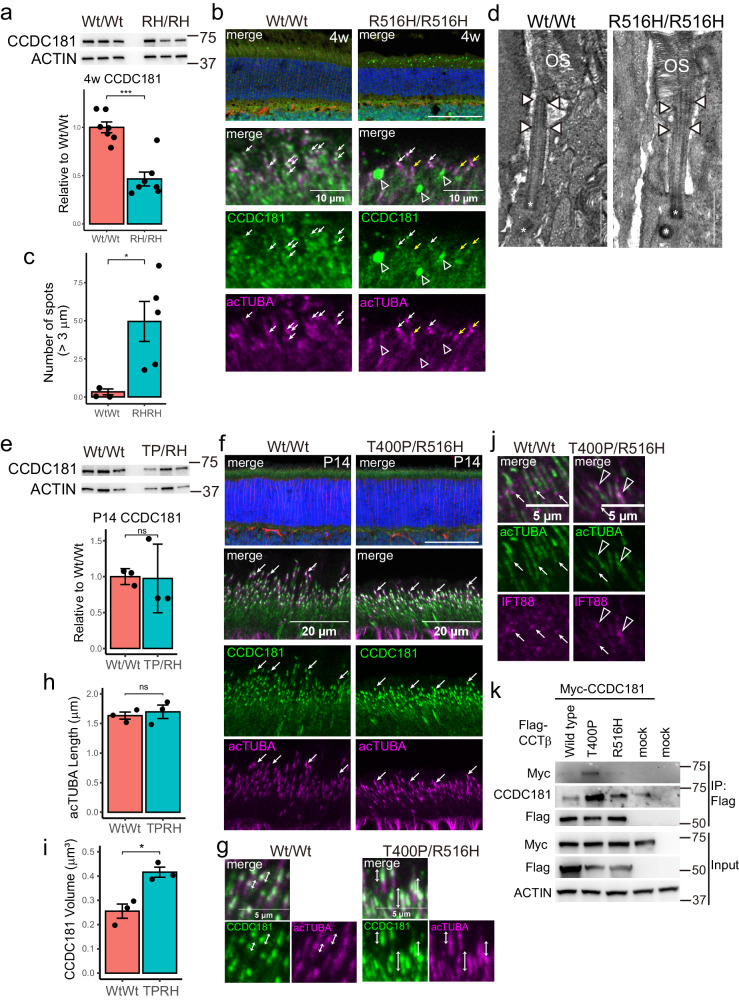
TRiC/CCT is a chaperonin complex required for the folding of cytoplasmic proteins. Although mutations in each subunit of TRiC/CCT are associated with various human neurodegenerative diseases, their impact in mammalian models has not yet been examined. A compound heterozygous mutation in CCT2 (p.[Thr400Pro]; p.[Arg516His]) is causal for Leber congenital amaurosis. Here, we generate mice carrying each mutation and show that Arg516His (R516H) homozygosity causes photoreceptor degeneration accompanied by a significant depletion of TRiC/CCT substrate proteins in the retina. In contrast, Thr400Pro (T400P) homozygosity results in embryonic lethality, and the compound heterozygous mutant (T400P/R516H) mouse showed aberrant cone cell lamination and died 2 weeks after birth. Finally, CCDC181 is identified as a interacting protein for CCTβ protein, and its localization to photoreceptor connecting cilia is compromised in the mutant mouse. Our results demonstrate the distinct impact of each mutation in vivo and suggest a requirement for CCTβ in ciliary maintenance.


Conflict of interest statement

The authors declare no competing interests.

Figures

Fig. 1
Fig. 1. Reduced retinal thickness in R516H mutant mouse.
a Human (NP_006422) and mouse (NP_001345696) CCTβ protein sequences around T400 (green) and R516 (magenta). Genomic DNA sequences showing the heterozygous c.1411a>c and c.1760_1761delinsAC mutations, respectively. G > C replacement (blue arrow) in R516H mutation is synonymous but makes TaqI enzyme recognition site. b Representative fundus and OCT images of R516H/R516H mouse at 43 weeks. c Representative OCT images of mice with indicated genotypes at 4 weeks and 7 weeks. Inserts shows magnified images of ellipsoid zone. d Quantification of ONL thickness and INL thickness from OCT images taken at the indicated time points. Distance from the optic nerve head is indicated on the x-axis (μm).
Fig. 2
Fig. 2. Functional and structural defects of photoreceptors in R516H mutant mouse.
a Quantification of ERG responses from rod and cone photoreceptors at 4 weeks, 7 weeks, 10 weeks, and 43 weeks. b Representative scotopic ERG responses at 4 weeks and 7 weeks. c Quantification of ERG responses from cone photoreceptors. d Representative photopic ERG responses. RH/RH: R516H/R516H. For (a, c), absolute value is indicated on y-axis (mean ± SEM). Each dot indicates the value from left or right eye of the individual animal. Averaged μV is compared using t-test between the genotypes. ****: p < 0.0001, ***: p < 0.001, ns: not significant. Number of animals (4 weeks- n = 4 for Wt/Wt, n = 6 for R516H/R516H; 7 weeks- n = 3 for Wt/Wt, n = 3 for R516H/R516H; 10 weeks- n = 5 for Wt/Wt, n = 3 for R516H/R516H; 43 weeks- n = 3 for Wt/Wt, n = 3 for R516H/R516H). For (b, d), x-axis of the scale indicates 40 ms, and y-axis of the scale indicates 100 μV. e Immunohistochemical analysis of photoreceptor opsins at indicated ages. scale bars: 100 μm for marged images, 50 μm for magnified images. f TUNEL staining of the retinal sections from indicated genotypes at 7 weeks. scale bars: 100 μm.
Fig. 3
Fig. 3. Photoreceptor-specific cell death in the R516H mutant mouse.
a Immunohistochemical analyses of retinal sections from indicated genotypes at 10 weeks. scale bars: 100 μm. b Quantification of the number of cells positive for each marker (mean ± SEM). Each dot indicates the average number of cells for six sections from each mouse. Mean cell number for each genotype was compared by ANOVA with Tukey-Kramer. Wt/RH: Wt/R516H, RH/RH: R516H/R516H. ****: p < 0.0001, ns: not significant. Number of animals (n = 3 or 4 for Wt/Wt, n = 4 for Wt/R516H, n = 3 or 4 for R516H/R516H).
Fig. 4
Fig. 4. Attenuated cone cell localization in T400P/R516H mouse at P14.
a Immunohistochemical analysis of retinal sections from indicated genotypes at P14. Scale bars: 100 μm. b Quantification of the ONL thickness and number of cells positive for each marker (mean ± SEM). Each dot indicates the average number of cells for six sections from each mouse. TP/RH: T400P/R516H. ns: not significant. c Retinal sections stained with cone arrestin and DAPI. Open triangles indicate cone cell bodies. Scale bars: 50 μm. d Comparison of the measured relative cone cell position between Wt/Wt and T400P/R516H (TP/RH) (mean ± SEM). Each dot indicates the mean value of relative cone cell position for each mouse. ***: p < 0.01, ns not significant. Number of animals (ONL thickness and relative cone cell position: n = 4 for Wt/Wt, n = 3 for T400P/R516H; others: n = 3 for Wt/Wt, n = 4 for T400P/R516H).
Fig. 5
Fig. 5. Protein expression changes in the R516H/R516H mouse retina at 4 weeks.
a Representative image of Western blotting of retinal lysates from indicated genotype mice at 4w for BBS2, BBS7, GNAT1, GNB1 and ACTIN. b Quantification of retinal proteins indicated in (a) (mean ± SEM). Protein amount was normalized against averaged amount in Wt/Wt for each experiment. Each dot indicates the normalized protein amount for each mouse. Average protein amount for each genotype was compared by ANOVA with Tukey-Kramer. *: p < 0.01 (0.05/5), ns not significant. Data from three independent experiments were summarized. Number of animals (n = 5 for Wt/Wt, n = 3 for Wt/R516H, n = 4 for R516H/R516H). For GNB1, n = 7 for Wt/Wt, n = 5 for Wt/R516H, and n = 6 for R516H/R516H. c Volcano plot showing the retinal proteins differentially expressed between Wt/Wt and R516H/R516H. Proteins with significant increase in R516H/R516H are in red, significant decrease in R516H/R516H are in blue. TRiC/CCT subunits are labeled. WD40 proteins with significant change are in cyan. CCDC181 protein is colored in red. d TUNEL staining (magenta) of mouse retinas at 4 weeks. Microglia was labeled for Iba1 (green). e Immunostaining of MHC class 1 receptor (H2K, green) and microglia (Iba1, magenta) on the retinal sections from indicated genotypes at 4 weeks. f Quantification of the number of cells positive for Iba1 or Iba1 and H2K (Iba1/H2K) located to the indicated retinal layers.
Fig. 6
Fig. 6. Mislocalization of CCDC181 in Cct2 mutant retinas before photoreceptor degeneration.
a Quantification of CCDC181 protein amount normalized to actin in the retinas from indicated genotypes at 4 weeks. Bar graph represents mean ± SEM. Each dot indicates the normalized protein amount for each mouse. b Immunostaining of CCDC181 on the retinal sections from indicated genotypes at 4 weeks. Arrows indicate co-localization of CCDC181 (green) and acTUBA (magenta). Open triangles indicate CCDC181-positive spots. Scale bars: 100 μm for the top panels, 10 μm for the lower panels. c Quantification of the number of CCDC181-positive spots larger than 3μm2 (mean ± SEM). Each dot indicates the number of spots averaged for six sections from each mouse. Number of animals (n = 4 for Wt/Wt, n = 5 for R516H/R516H). d Representative electron microscopy of the photoreceptor primary cilia at 4 weeks. White rectangles indicate the connecting cilia. OS: outer segment, asterisks indicate basal bodies. Scale bars: 1 μm. e Quantification of CCDC181 protein amount normalized to actin in the indicated genotypes at P 14. Bar graph represents mean ± SEM. TP/RH: T400P/R516H. Number of animals (n = 3 for Wt/Wt, n = 3 for T400P/r516H). f Immunostaining of CCDC181 (green) and acTUBA (magenta) on the retinal sections from indicated genotypes at P14. Stacked images are shown for the lower panels. Arrows indicate co-localization of CCDC181 and acTUBA. Scale bar: 100 μm for the top panels, 25 μm for the lower panels. g Magnified stacked image of connecting cilia stained for CCDC181 (green) and acTUBA (magenta). Bidirectional arrows indicate the co-localization of CCDC181 and acTUBA. h Quantification of connecting cilia length stained by acTUBA in stacked retinal sections from indicated genotypes (mean ± SEM). Each dot indicates the mean length for each animal. TP/RH: T400P/R516H. Number of animals (n = 3 for Wt/Wt, n = 3 for T400P/R516H). i Quantification of CCDC181 immunostained volume in stacked retinal sections from indicated genotypes (mean ± SEM). Each dot indicates the mean volume for each animal. TP/RH: T400P/R516H. Number of animals (n = 3 for Wt/Wt, n = 3 for T400P/R516H). j Immunostaining of acTUBA (green) and IFT88 (magenta) in the retinal sections from indicated genotypes. Arrows indicate IFT88 localized to the distal tip of connecting cilia. Open triangles indicate aberrant localization of IFT88 in T400P/R516H retinas (representative image for three mice for each genotype). k Immunoprecipitation of Flag-tagged CCTβ proteins and Myc-tagged CCDC181 in HEK293T cell lysate. Overexpressed proteins are indicated on the top. *: p < 0.05, **: p < 0.01, ***: p < 0.001, ns not significant.

Similar articles

Cited by

References

    1. Hein MY, et al. A human interactome in three quantitative dimensions organized by stoichiometries and abundances. Cell. 2015;163:712–723. doi: 10.1016/j.cell.2015.09.053. - DOI - PubMed
    1. Yam AY, et al. Defining the TRiC/CCT interactome links chaperonin function to stabilization of newly made proteins with complex topologies. Nat. Struct. Mol. Biol. 2008;15:1255–1262. doi: 10.1038/nsmb.1515. - DOI - PMC - PubMed
    1. Willison, K. R. The substrate specificity of eukaryotic cytosolic chaperonin CCT. Philos. Trans. R. Soc. Lond. B Biol. Sci.373. 10.1098/rstb.2017.0192 (2018). - PMC - PubMed
    1. Jin M, Liu C, Han W, Cong Y. TRiC/CCT chaperonin: structure and function. Subcell. Biochem. 2019;93:625–654. doi: 10.1007/978-3-030-28151-9_19. - DOI - PubMed
    1. Vallin J, Grantham J. The role of the molecular chaperone CCT in protein folding and mediation of cytoskeleton-associated processes: implications for cancer cell biology. Cell Stress Chaperones. 2019;24:17–27. doi: 10.1007/s12192-018-0949-3. - DOI - PMC - PubMed

Publication types

MeSH terms

Substances