. 2024 Jun;30(6):1732-1738.
doi: 10.1038/s41591-024-02976-x. Epub 2024 Jun 3.

Geographic sources of ozone air pollution and mortality burden in Europe

Affiliations

Geographic sources of ozone air pollution and mortality burden in Europe

Hicham Achebak et al. Nat Med. 2024 Jun.

Abstract

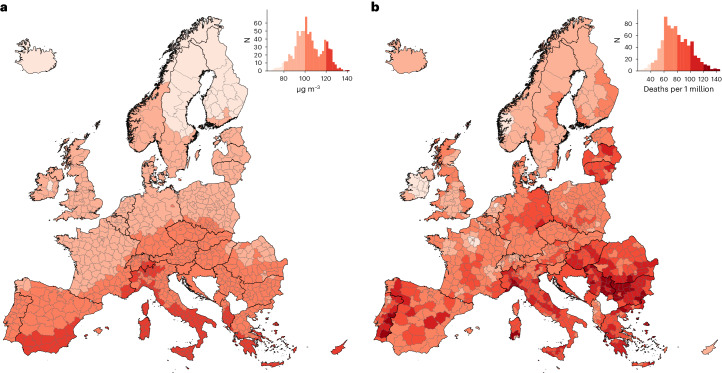
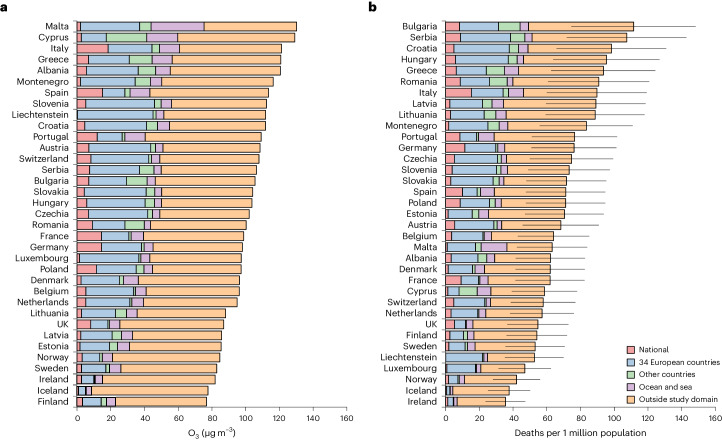
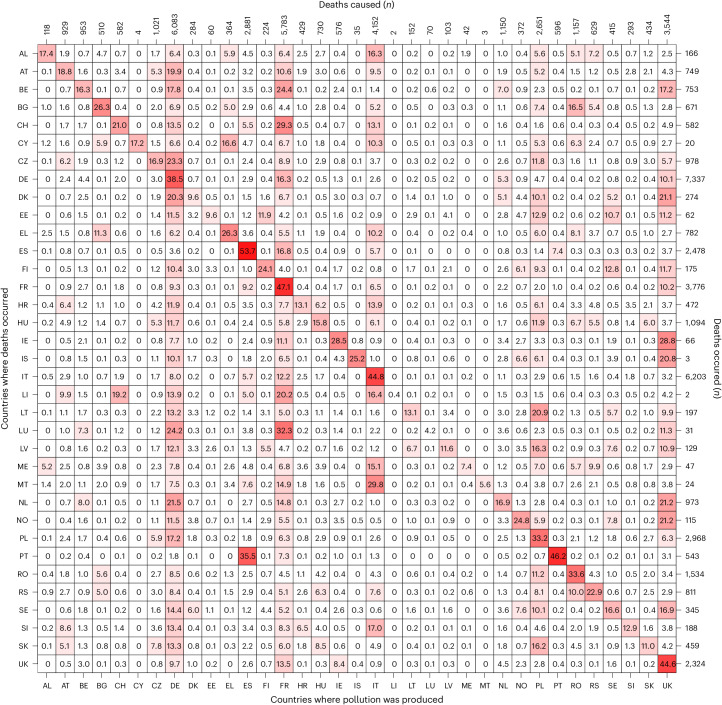
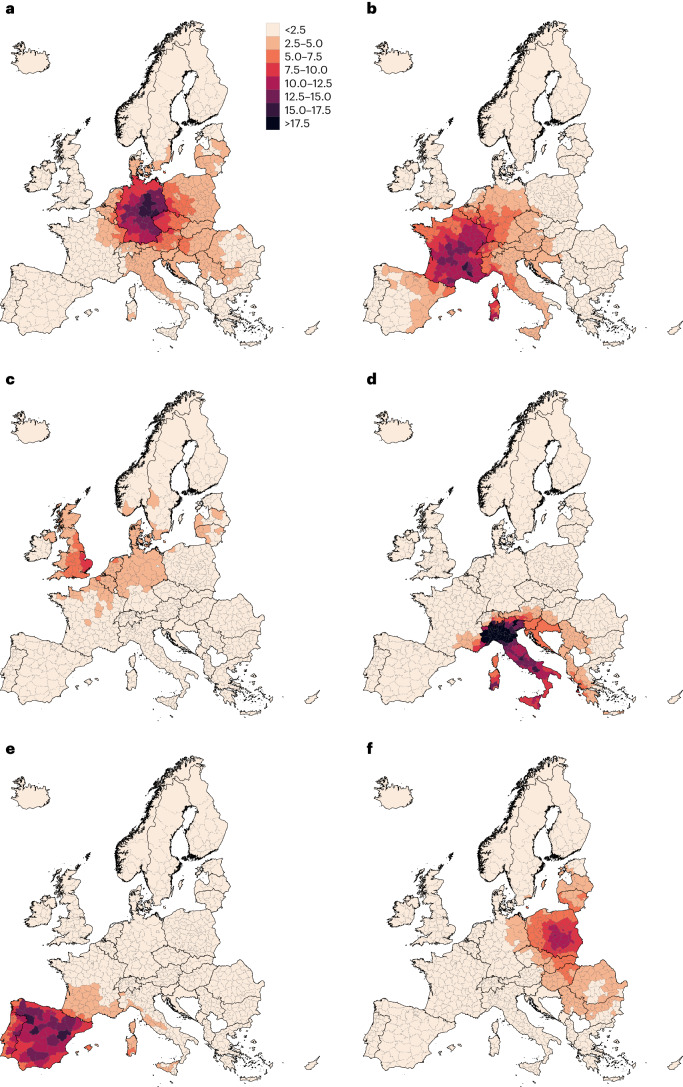
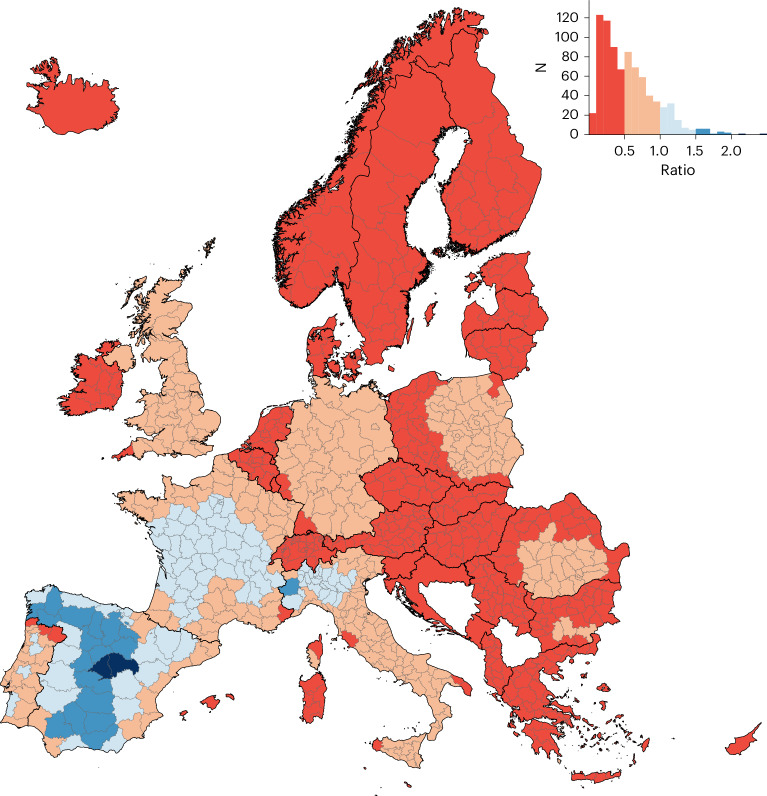
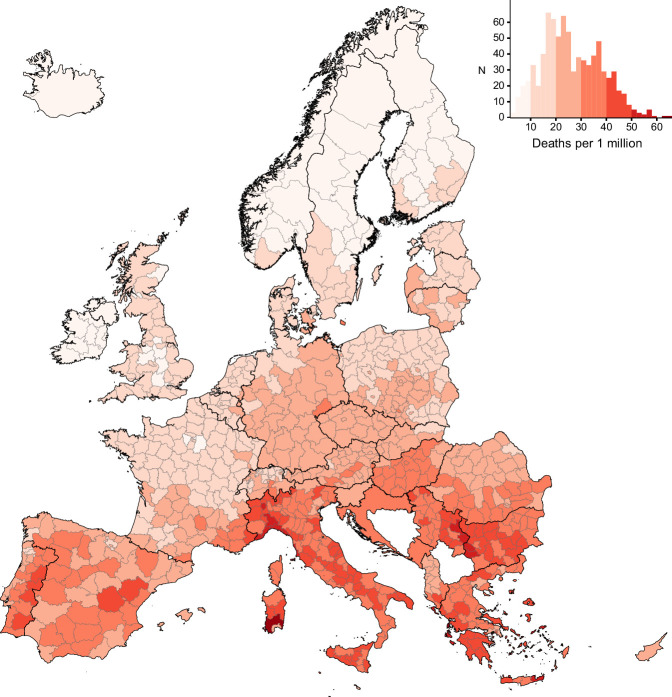
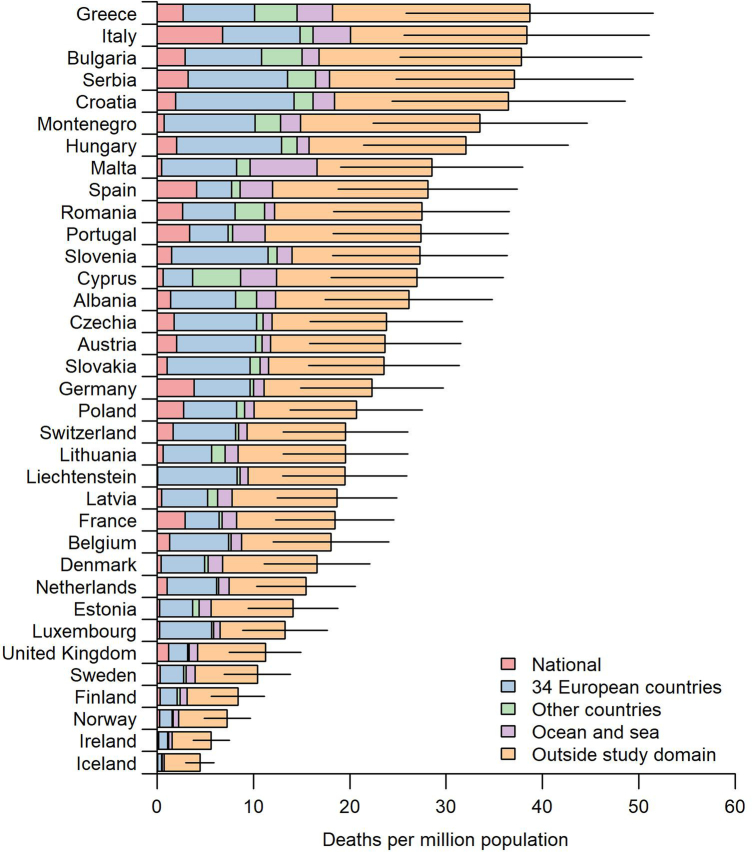
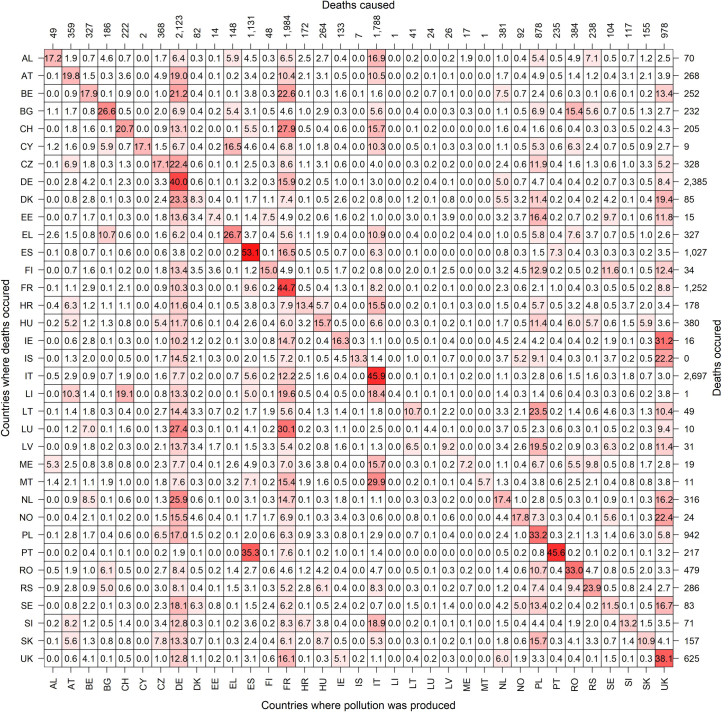
Ground-level ozone (O3) is a harmful air pollutant formed in the atmosphere by the interaction between sunlight and precursor gases. Exposure to current O3 levels in Europe is a major source of premature mortality from air pollution. However, mitigation actions have been mainly designed and implemented at the national and regional scales, lacking a comprehensive assessment of the geographic sources of O3 pollution and its associated health impacts. Here we quantify both national and imported contributions to O3 and their related mortality burden across 813 contiguous regions in 35 European countries, representing about 530 million people. Imported O3 contributed to 88.3% of all O3-attributable deaths (intercountry range 83-100%). The greatest share of imported O3 had its origins outside the study domain (that is, hemispheric sources), which was responsible for 56.7% of total O3-attributable mortality (range 42.5-87.2%). It was concluded that achieving the air-quality guidelines set out by the World Health Organization and avoiding the health impacts of O3 require not only the implementation of national or coordinated pan-European actions but also global strategies.


Conflict of interest statement

The authors declare no competing interests.

Figures

Fig. 1
Fig. 1. O3 levels and associated mortality during the warm season (May–September), 2015–2017.
a, Average daily mean 8-h maximum O3 (µg m3). b, Mortality (annual deaths per 1 million population) attributable to O3. a,b, Histograms depict both the color legend and the number of regions for each value.
Fig. 2
Fig. 2. O3 levels and associated mortality according to O3 emission sources in 35 European countries, 2015–2017.
a, Average daily mean 8-h maximum O3 (µg m3). b, Mortality attributable to O3 (annual deaths per 1 million population). Horizontal bars represent 95% eCI of overall O3-attributable mortality (that is, the sum of the five contribution sources).
Fig. 3
Fig. 3. Country-to-country O3-attributable mortality contribution in Europe, 2015–2017.
Each grid cell of the matrix shows the AF (%) in a country (row) due to O3 produced in another country (column). The diagonal represents mortality caused by national (that is, non-imported) O3. The number of attributable deaths that occurred in each country is shown on the right, and thus the sum of the grid cells in a row is always equal to 100% while the number of attributable deaths caused by each county is shown at the top. Country abbreviations used here are given in Methods.
Fig. 4
Fig. 4. O3-attributable mortality caused by major O3 precursor-emitting countries, 2015–2017.
af, Estimates are expressed as annual deaths per 1 million population: Germany (a); France (b); UK (c); Italy (d); Spain (e); and Poland (f).
Fig. 5
Fig. 5. Ratio of national to imported O3-attributable deaths, 2015–2017.
The histogram depicts both the color legend and the number of regions for each ratio, with a large number of regions where imported O3 deaths predominated over those nationally generated. The imported fraction refers to imports from the 34 other European countries.
Extended Data Fig. 1
Extended Data Fig. 1. O3 attributable mortality rate during the warm season (May-September), 2015–2017.
The mortality rate is expressed as annual deaths per million population. Only days with average 8-hour maximum O3 above 70 µg/m3 were considered in this analysis. The histogram depicts both the color legend and the number of regions for each value.
Extended Data Fig. 2
Extended Data Fig. 2. O3 associated mortality according to O3 emission sources in 35 European countries, 2015–2017.
Only days with average mean 8-hour maximum O3 above 70 µg/m3 were considered in this analysis. The horizontal bars represent the 95% empirical CI of the overall O3 attributable mortality (ie, the sum of the five contribution sources).
Extended Data Fig. 3
Extended Data Fig. 3. Country-to-country O3 attributable mortality contribution in Europe, 2015–2017.
Only days with average 8-hour maximum O3 above 70 µg/m3 were considered in this analysis. Each grid cell of the matrix shows the AF (%) in a country (row) due to the O3 produced in another country (column). The diagonal corresponds to the mortality caused by the national (ie, non-imported) O3. The number of attributable deaths that occurred in each country is shown on the right, and thus the sum of the grid-cells in a row is always equal to 100%, while the number of attributable deaths caused by each county is shown on the top.
Extended Data Fig. 4
Extended Data Fig. 4. Map of the study domain.
The study domain includes countries other than the 35 analysed countries (non-EU-35) along with the ocean and the sea, where both land and maritime emissions occur.
Extended Data Fig. 5
Extended Data Fig. 5. National contributions to total annual NOx and NMVOC anthropogenic emissions by country, 2015–2021.
Reference: Centre on Emissions Inventories and Projections. Officially reported emission data [https://www.ceip.at/webdab-emission-database/reported-emissiondata (last access: September 2023).
Extended Data Fig. 6
Extended Data Fig. 6. Normalized Mean Bias (NMB) for the O3 concentrations for the weeks 18–39 in 2015–2017.
EEA rural background stations below 1 000 m above sea level.

Similar articles

Cited by

References

    1. Zhang J, Wei Y, Fang Z. Ozone pollution: a major health hazard worldwide. Front. Immunol. 2019;10:2518. doi: 10.3389/fimmu.2019.02518. - DOI - PMC - PubMed
    1. Vicedo-Cabrera AM, et al. Short term association between ozone and mortality: global two stage time series study in 406 locations in 20 countries. Br. Med. J. 2020;368:m108. doi: 10.1136/bmj.m108. - DOI - PMC - PubMed
    1. Gu J, et al. Ambient air pollution and cause-specific risk of hospital admission in China: a nationwide time-series study. PLoS Med. 2020;17:e1003188. doi: 10.1371/journal.pmed.1003188. - DOI - PMC - PubMed
    1. Air quality in Europe 2020 (European Environment Agency, 2020); www.eea.europa.eu/publications/air-quality-in-europe-2020-report
    1. Chen Z-Y, et al. Population exposure to multiple air pollutants and its compound episodes in Europe. Nat. Commun. 2024;15:2094. doi: 10.1038/s41467-024-46103-3. - DOI - PMC - PubMed