. 2024 Jun 3;7(1):678.
doi: 10.1038/s42003-024-06342-y.

Correlations reveal the hierarchical organization of biological networks with latent variables

Affiliations

Correlations reveal the hierarchical organization of biological networks with latent variables

Stefan Häusler. Commun Biol. .

Abstract

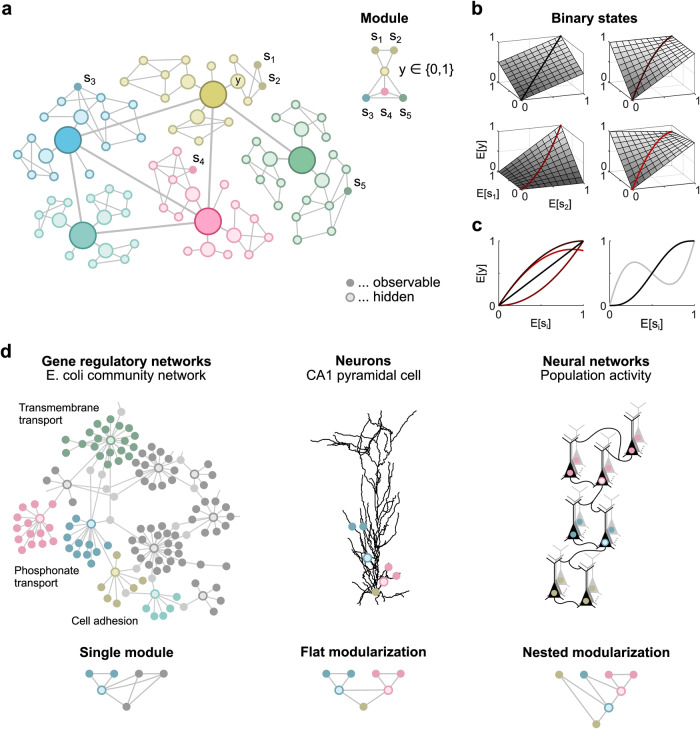
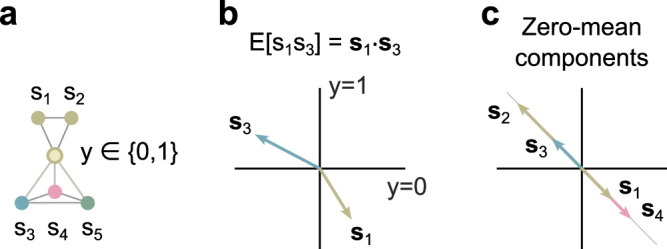
Deciphering the functional organization of large biological networks is a major challenge for current mathematical methods. A common approach is to decompose networks into largely independent functional modules, but inferring these modules and their organization from network activity is difficult, given the uncertainties and incompleteness of measurements. Typically, some parts of the overall functional organization, such as intermediate processing steps, are latent. We show that the hidden structure can be determined from the statistical moments of observable network components alone, as long as the functional relevance of the network components lies in their mean values and the mean of each latent variable maps onto a scaled expectation of a binary variable. Whether the function of biological networks permits a hierarchical modularization can be falsified by a correlation-based statistical test that we derive. We apply the test to gene regulatory networks, dendrites of pyramidal neurons, and networks of spiking neurons.


Conflict of interest statement

The author declares no competing interests.

Figures

Fig. 1
Fig. 1. Functional modules in undirected graphical models.
a Undirected graphical model representing dependencies between network components (left). Right: Functional module consisting of the observable components s1 and s2, which are independent of all other observable components given the interface variable y. b Examples of interface rate functions for the functional module shown in (a). c Left: Three of the interface rate functions shown in panel b are nonlinear, as illustrated for E[s1] = E[s2]. Right: Examples of nonlinear interface rate functions of three (black line) and five (gray line) arguments, illustrated for identical arguments E[si]. d Three scenarios used for statistical testing.
Fig. 2
Fig. 2. Vector representation of pairwise correlations.
a Components s1 and s3 of the undirected graphical model are conditionally independent given the interface variable y. b Their pairwise correlation, E[s1s3], corresponds to the scalar product of the vectors s1 and s3. c All vector pairs associated with zero-mean network components are either parallel or antiparallel.
Fig. 3
Fig. 3. Inference of direct interactions in gene regulatory networks.
a Undirected graphical model of a subnetwork consisting of four genes (top). Black edges represent putative direct interactions, which are elements of the set of most likely interactions. Red edges represent putative indirect interactions to be tested. Bottom: Example of a directed graphical model representing causal interactions between genes (arrows). Dashed lines indicate removable (gray) and nonremovable (black) indirect interactions. b Performance of the uncorrected method based on Pearson correlation coefficients (Corr. 1) for all interactions (light blue) or only for TF-TG interactions (blue) of the in-silico benchmark. The correction based on the test improves the performance by 50% (dark red rectangle). c Performance as a function of the size of the set of most likely interactions for the network inference methods Regression 5, MI 2, Corr. 1, Bayes 4, Other 1, Meta 2 and the community network (color code as in e). Dotted lines indicate the selected sizes of the sets, determined on a disjoint holdout set. d Cumulative distributions of removable, nonremovable and gold standard interactions as a function of the rank in the list of most likely interactions for the corrected (blue line) and uncorrected (dark red line) inference method Corr. 1. e Performance of all 36 inference methods of the DREAM5 challenge before (colored bars) and after their correction based on the test (dark red rectangles) for the in-silico benchmark (top). The dashed line indicates the performance of the community network (C). Bottom: Relative performance improvement in %. The dotted line indicates an improvement of 50%. f Same as (e), but for the Escherichia coli dataset. g Overall score summarizing the performance across networks and performance measures.
Fig. 4
Fig. 4. Moment ratios indicate functional modularizations.
a Left: The moment E[P3Q3] corresponds to the scalar product of the associated vectors p3 and q3. Middle: Vector p3 expressed in the skewed coordinate system with axes perpendicular to q1 and q2. Right: Vector q3 expressed in the skewed coordinate system with axes perpendicular to p1 and p2. b All vector pairs associated with zero-mean network components are either parallel or antiparallel. The vector q4 is associated with a mixed moment of order greater than one and can point in any direction. c Single functional module. d Example of a moment ratio matrix for the modularization shown in (c) (left). Right: Matrix elements with the same value due to the single functional module are shown as connected. e Flat modularization. f Example of a moment ratio matrix for the modularization shown in panel e (left). Right: Each of the two modules implies that different elements of the moment ratio matrix have the same value. The conditions for the moment ratio matrix resulting from the overall modularization are obtained by combining the conditions for the individual modules. g Nested modularization. h The conditions for the moment ratio matrix resulting from the nested modularization shown in (g) are obtained by combining the conditions for the individual modules.
Fig. 5
Fig. 5. Inference of functional modules in neural networks.
a Nested modularization consisting of five populations of neurons. b 12 out of 26 potential modularizations. Modularizations consistent with the modularization shown in panel a are marked with a red rectangle. c Spiking activity of all neurons and correlation matrix of observable components (top). Observable states are spike counts within populations and time intervals. Colored numbers represent samples of the observable component s1. Bottom: Boxplot showing the distribution of p values for testing each of the 26 modularizations. Boxes represent the first through third quartiles, and whiskers indicate the 2.5 and 97.5 percentiles. d Same as (c), but for a linear modularization with the same correlation matrix. Dashed lines represent overall significance levels of 0.01.
Fig. 6
Fig. 6. Inference of functional modules in dendrites of pyramidal neurons.
a Model of the apical dendrites of a CA1 pyramidal neuron (top). The investigated subtree is shown in color and black. Black circles indicate recording locations. Bottom: Undirected graphical model of the largest possible modularization consistent with the morphology of the investigated subtree. b Synaptic input to terminal branches (top). Bottom: Observable states are membrane potentials recorded at the corresponding locations shown in panel a, sampled every 50 ms. Spiking activity at the soma (gray traces) is excluded from the analysis. c Estimated moment ratio matrix. d p values for testing each of the 15 functional modules shown in panel a on a log scale (left). Right: Elements of the moment ratio matrix expected to have the same value according to the single module S7, represented as contiguous blocks. e p values for testing whether individual functional modules or dendritic branches originating from the trunk participate in a large linear somatic module (on log scales). All tests are repeated ten times on independent datasets obtained from 20 and 60 min recordings. Dotted lines represent overall significance levels of 0.01. Horizontal bars indicate medians. Right: Elements of the moment ratio matrix expected to have the same value according to a linear module consisting of S1, S14, S15, s3, s11, s22 and S¯4={s4,s7}. f Approximate flat modularization of the proximal apical and oblique dendrites.
Fig. 7
Fig. 7. All possible modularizations of a network consisting of five components.
All 25 modularizations M1 to M25 of an undirected graphical model consisting of five components s1 to s5, such that each functional model has at least two components.

Similar articles

Cited by

References

    1. Urai AE, Doiron B, Leifer AM, Churchland AK. Large-scale neural recordings call for new insights to link brain and behavior. Nat. Neurosci. 2022;25:11–19. doi: 10.1038/s41593-021-00980-9. - DOI - PubMed
    1. Paninski L, Cunningham JP. Neural data science: accelerating the experiment-analysis-theory cycle in large-scale neuroscience. Curr. Opin. Neurobiol. 2018;50:232–241. doi: 10.1016/j.conb.2018.04.007. - DOI - PubMed
    1. Bullmore E, Sporns O. Complex brain networks: graph theoretical analysis of structural and functional systems. Nat. Rev. Neurosci. 2009;10:186–198. doi: 10.1038/nrn2575. - DOI - PubMed
    1. Bullmore ET, Bassett DS. Brain graphs: graphical models of the human brain connectome. Annu. Rev. Clin. Psychol. 2011;7:113–140. doi: 10.1146/annurev-clinpsy-040510-143934. - DOI - PubMed
    1. Bassett DS, Sporns O. Network neuroscience. Nat. Neurosci. 2017;20:353–364. doi: 10.1038/nn.4502. - DOI - PMC - PubMed

Publication types