

A method for screening salt stress tolerance in Indian mustard (Brassica juncea) (L.) Czern & Coss at seedling stage
- PMID: 38831025
- PMCID: PMC11148084
- DOI: 10.1038/s41598-024-63693-6
A method for screening salt stress tolerance in Indian mustard (Brassica juncea) (L.) Czern & Coss at seedling stage
Abstract
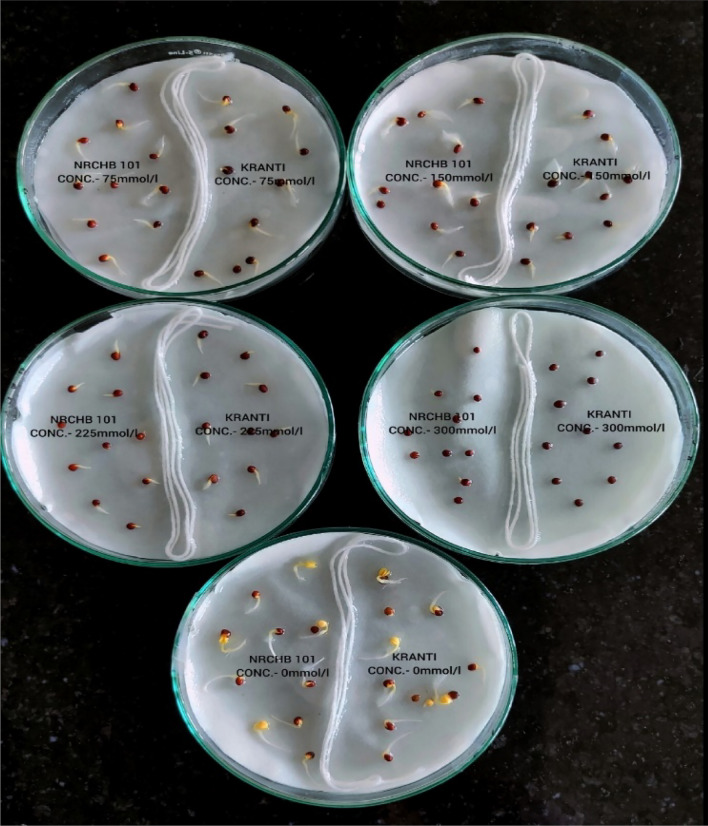
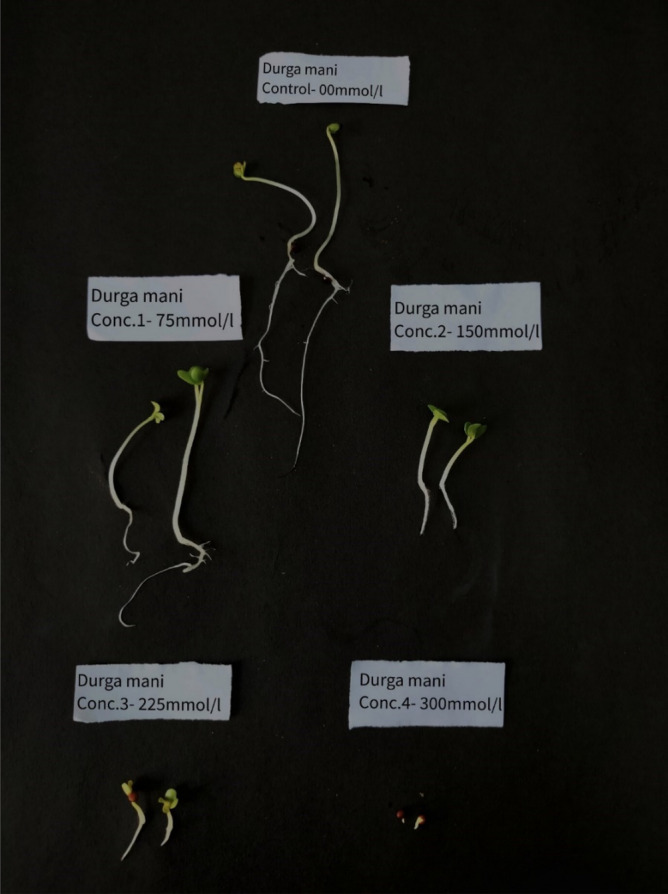
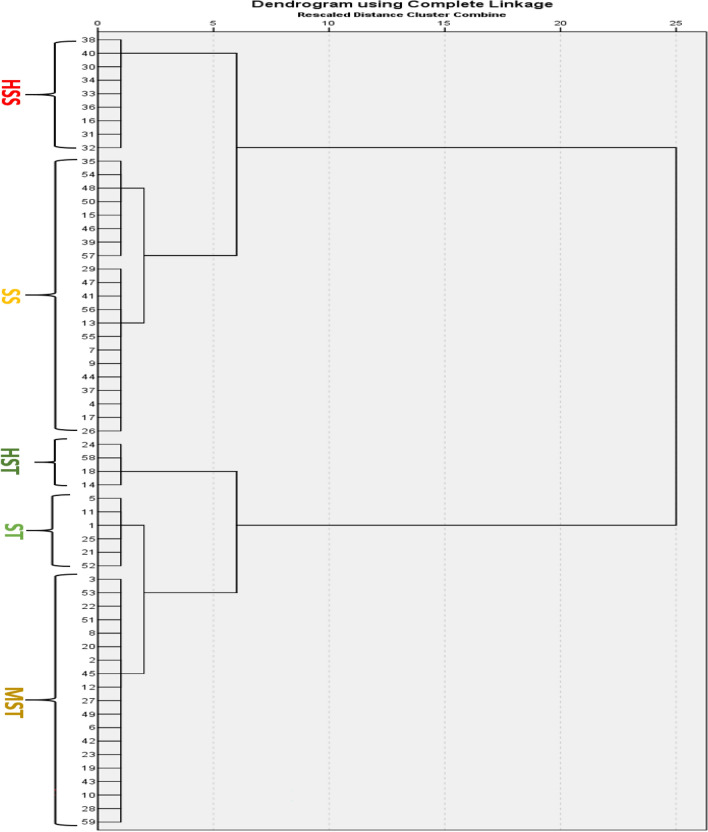
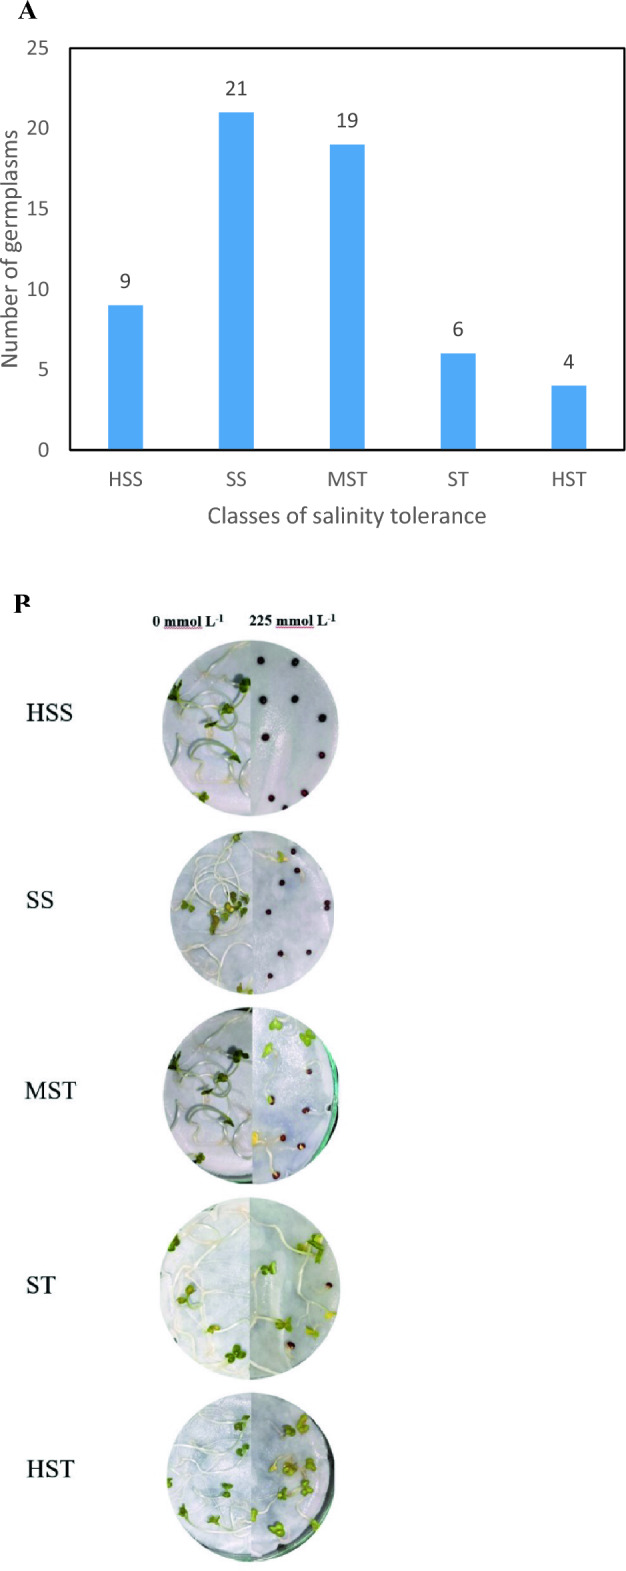
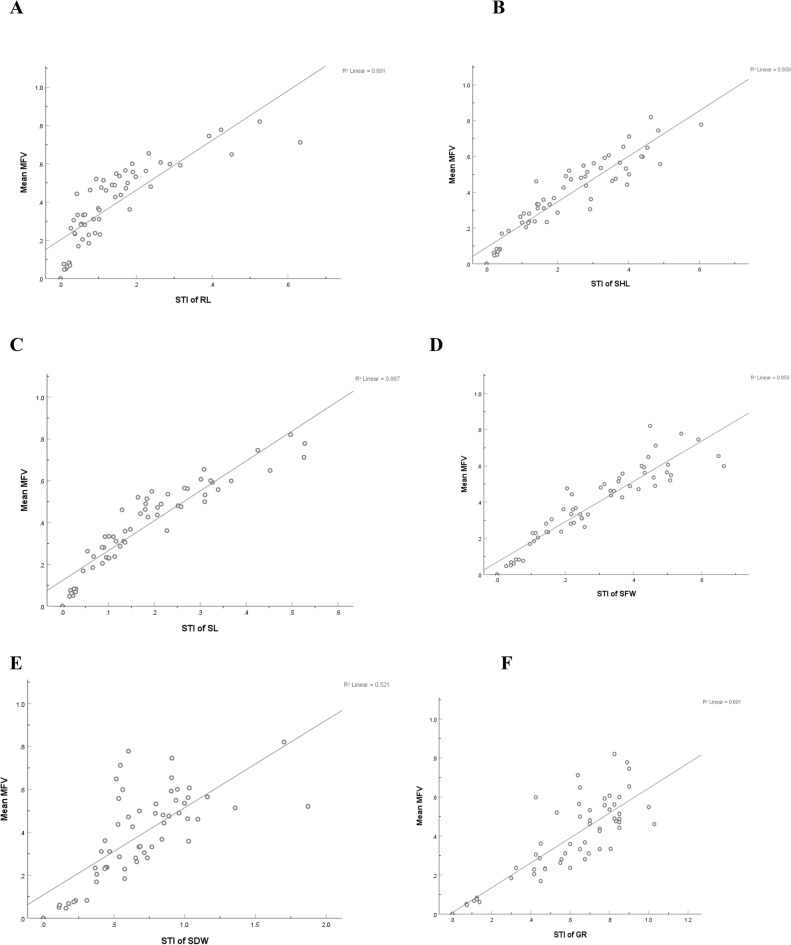
Fifty-nine diverse Brassica juncea (Indian mustard) genotypes were used to find an effective screening method to identify salt tolerance at the germination and seedling stages. Salinity stress limits crop productivity and is difficult to simulate on farms, hindering parental selection for hybridization programmes and the development of tolerant cultivars. To estimate an optimum salt concentration for screening, seeds of 15 genotypes were selected randomly and grown in vitro at 0 mM/L, 75 mM/L, 150 mM/L, 225 mM/L, and 300 mM/L concentrations of NaCl in 2 replications in a complete randomized design. Various morphological parameters, viz., length of seedling, root and shoot length, fresh weight, and dry weight, were observed to determine a single concentration using the Salt Injury Index. Then, this optimum concentration (225 mM/L) was used to assess the salt tolerance of all the 59 genotypes in 4 replications while observing the same morphological parameters. With the help of Mean Membership Function Value evaluation criteria, the genotypes were categorized into 5 grades: 4 highly salt-tolerant (HST), 6 salt-tolerant (ST), 19 moderately salt-tolerant (MST), 21 salt-sensitive (SS), and 9 highly salt-sensitive (HSS). Seedling fresh weight (SFW) at 225 mM/L was found to be an ideal trait, which demonstrates the extent to which B. juncea genotypes respond to saline conditions. This is the first report that establishes a highly efficient and reliable method for evaluating the salinity tolerance of Indian mustard at the seedling stage and will facilitate breeders in the development of salt-tolerant cultivars.
© 2024. The Author(s).
Conflict of interest statement
The authors declare no competing interests.
Figures

References
-
- Shahbaz M, Ashraf M. Improving salinity tolerance in cereals. Crit. Rev. Plant Sci. 2013;32:237–249. doi: 10.1080/07352689.2013.758544. - DOI
-
- Raza A, Ashraf F, Zou X, Zhang X, Tosif H. Plant adaptation and tolerance to environmental stresses: Mechanisms and perspectives. In: Hasanuzzaman M, editor. Plant Ecophysiology And Adaptation Under Climate Change: Mechanisms And Perspectives. Singapore; 2020.
-
- Ashraf M, McNeilly T. Responses of four Brassica species to sodium chloride. Environ. Exp. Bot. 1990;30:475–487. doi: 10.1016/0098-8472(90)90028-3. - DOI
-
- Chinnusamy V, Jagendorf A, Zhu JK. Understanding and improving salt tolerance in plants. Crop Sci. 2005;45:437–448. doi: 10.2135/cropsci2005.0437. - DOI
MeSH terms
Substances
LinkOut - more resources
Full Text Sources
