. 2024 Aug;5(8):1158-1175.
doi: 10.1038/s43018-024-00772-7. Epub 2024 Jun 3.

LORIS robustly predicts patient outcomes with immune checkpoint blockade therapy using common clinical, pathologic and genomic features

Affiliations

LORIS robustly predicts patient outcomes with immune checkpoint blockade therapy using common clinical, pathologic and genomic features

Tian-Gen Chang et al. Nat Cancer. 2024 Aug.

Abstract

Despite the revolutionary impact of immune checkpoint blockade (ICB) in cancer treatment, accurately predicting patient responses remains challenging. Here, we analyzed a large dataset of 2,881 ICB-treated and 841 non-ICB-treated patients across 18 solid tumor types, encompassing a wide range of clinical, pathologic and genomic features. We developed a clinical score called LORIS (logistic regression-based immunotherapy-response score) using a six-feature logistic regression model. LORIS outperforms previous signatures in predicting ICB response and identifying responsive patients even with low tumor mutational burden or programmed cell death 1 ligand 1 expression. LORIS consistently predicts patient objective response and short-term and long-term survival across most cancer types. Moreover, LORIS showcases a near-monotonic relationship with ICB response probability and patient survival, enabling precise patient stratification. As an accurate, interpretable method using a few readily measurable features, LORIS may help improve clinical decision-making in precision medicine to maximize patient benefit. LORIS is available as an online tool at https://loris.ccr.cancer.gov/ .


Conflict of interest statement

Competing interests

E.R. is a cofounder of MedAware, Metabomed and Pangea Biomed (divested) and an unpaid member of Pangea Biomed’s scientific advisory board. L.G.T.M. is listed as an inventor on intellectual property owned by MSK related to the use of TMB in cancer immunotherapy, unrelated to this work. The other authors declare no competing interests.

Figures
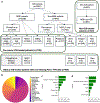
Extended Data Fig. 1 |
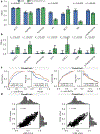
Extended Data Fig. 1 |. An illustration of cohorts used in this study (a-b) and feature importance by the logistic LASSO regression model (c-d).
a. The relationship between cohorts used in this study, the number of participants in each cohort, and the number of participants with complete data for the pan-cancer model and the NSCLC-specific model. The cohorts shaded in light grey represent the training cohorts for the pan-cancer and NSCLC-specific models, respectively. In the figure, ‘n’ represents the number of participants. b. The cancer composition of the non-ICB cohort. Note that three cancer types, mesothelioma, cancer of unknown primary, and central nervous system cancer are not present in this cohort. c-d. Feature importance of from the 8-feature logistic regression classifier using features commonly measured across most participants (c) and feature importance of the final 6-feature logistic regression classifier LLR6 (d). Feature importance is calculated as the absolute values of the corresponding coefficients in the logistic regression models. Importance for cancer type is calculated as the average importance of individual cancer types.
Extended Data Fig. 2 |
Extended Data Fig. 2 |. Comparison between the pan-cancer LLR6 model and the RF16 (Chowell et al.) model.
a. Comparison of the predictive power between the two models on 2,000-repeated 5-fold cross-validation sets using multiple metrics (n = 10,000 repetitions). Error bars, mean ± s.d. P values, two-tailed Mann-Whitney U test. Note that p values are only shown when values for LLR6 (blue bars) are significantly higher than RF16 (Chowell et al.) (green bars). b. Same as panel a, but the metrics represent the difference between those on the training sets and those on the corresponding cross-validation sets (n = 10,000 repetitions). Error bars, mean ± s.d. P values, two-tailed Mann-Whitney U test. c. Receiver operating characteristic curves and corresponding AUCs of LLR6 (blue curves) and RF16 (Chowell et al.) (orange curves) on the training (n = 964 participants) and unseen test (n = 515 participants) sets. Note that while the performance of RF16 (Chowell et al.) is better on the training set, the performance of the much simpler LLR6 model is better on the unseen test set. d. Correlation between the scores from LLR6 and RF16 (Chowell et al.) on both training and unseen test sets, respectively. Spearman correlation coefficients are shown.
Extended Data Fig. 3 |
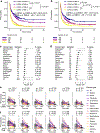
Extended Data Fig. 3 |. LORIS predicts PFS following immunotherapy for both pan-cancer and individual cancer types.
a. Kaplan–Meier analysis of PFS. TMB is binned at 10 mutations per Mb and LORIS is binned at 0.5. HRs with 95% confidence intervals are shown. P values, univariable Cox proportional hazards regression. H, high; L, low. In the risk table, the numbers represent the number of participants. b. Same as panel a, but TMB is binned at the highest 20th percentile and LORIS is binned at the 50th percentile for each cancer type. HRs with 95% confidence intervals are shown. P values, univariable Cox proportional hazards regression. H, high; L, low. c, d. Forest plot of HRs of PFS within each cancer type using LORIS (binned at the 50th percentile; c) or TMB (binned at the highest 20th percentile; d). P values, multivariable Cox proportional hazards regression with adjustment for cancer type, age, ICB drug class, and year of ICB start. Squares positioned at midpoints symbolize point estimates of HRs, and the accompanying bars indicate 95% confidence intervals. e,f. Comparison of half-year, 1-year, 2-year, 3-year, 4-year, and 5-year PFS stratified by cancer type for high versus low LORIS (binned at the 50th percentile; e) and high versus low TMB (binned at the highest 20th percentile; f). Median survival probability differences (Δ) are displayed. P values, two-tailed paired Wilcoxon rank sum test. Box boundaries represent the first and third quartiles; the central line marks the median. Whiskers extend to the furthest non-outlier points within 1.5 times the interquartile range. Data are from combined Chowell test and MSK1 sets (n = 968 participants).
Extended Data Fig. 4 |
Extended Data Fig. 4 |. LORIS has better prediction power of immunotherapy than TMB (a-d) and has enhanced predictive power over prognosis (e).
a-b. Kaplan–Meier analysis of PFS (a) and OS (b). Both TMB and LORIS are binned at the 50th percentile for each cancer type. HRs with 95% confidence intervals are shown. P values, univariable Cox proportional hazards regression. H, high; L, low. Data are from combined Chowell test and MSK1 sets (n = 968 participants). c-d. Kaplan–Meier analysis of LORIS (c) or TMB (d) binned at the different percentiles in each cancer type. P values next to the legend indicate pairwise single-tail comparisons testing against the hypothesis that ‘higher scored participants do not have better survival than lower scored participants’ with univariable Cox proportional hazards regression. HRs with 95% confidence intervals are shown for the lowest-percentile (0–10%) and the highest-percentile groups (90–100%) with univariable Cox proportional hazards regression. Data are from combined Chowell test and MSK1 sets (n = 968 participants). e. Receiver operating characteristic curves and corresponding AUCs with 95% confidence intervals of LORIS on 0.5-year OS, 1-year OS, 2-year OS, and 3-year OS of participants treated with ICB (blue curves) or non-ICB (orange curves) therapies. P values, two-tailed DeLong’s test. ICB data are from combined Chowell test and MSK1 sets (n = 968 participants). Non-ICB data are from the MSK non-ICB cohort (n = 841 participants). The dashed lines represent random performance, serving as a baseline with an AUC of 0.5. This indicates the performance expected from a classifier making random guesses.
Extended Data Fig. 5 |
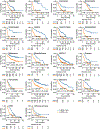
Extended Data Fig. 5 |. Kaplan–Meier analysis of survival in individual cancer types.
Patients are grouped into LORIS-high (orange curves) and LORIS-low (blue curves) risk groups. LORIS is binned at the 50th percentile for each cancer type. HRs with 95% confidence intervals are shown. P values, univariable Cox proportional hazards regression. In the risk tables, the numbers represent the number of participants. Data are from combined Chowell et al., MSK1, and MSK2 sets (n = 2032 participants). Abbreviations: SCLC, small-cell lung cancer; CNS, central nervous system tumor; Unknown primary, cancer of unknown primary.
Extended Data Fig. 6 |
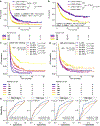
Extended Data Fig. 6 |. Comparison of predictive performance between the NSCLC-specific LLR6, pan-cancer LLR6, and NSCLC-specific LLR2 models.
a. Receiver operating characteristic curves and corresponding AUCs with 95% confidence intervals of the NSCLC-specific (blue curves) and pan-cancer (orange curves) LLR6 models. P values are from DeLong’s test. In the figure, ‘n’ represents the number of participants. b-c. Forest plots of HRs of PFS (b) and OS (c) within each data set using pan-cancer LORIS (binned at 0.5, which maximizes the Youden’s index on the training data) in a multivariable Cox model with adjustment for sex, age and ICB drug class. P values, multivariable Cox proportional hazards regression with adjustment for sex, age, and ICB drug class. Squares positioned at midpoints symbolize point estimates of HRs, and the accompanying bars indicate 95% confidence intervals. In the figure, the samples represent the number of participants. d. Receiver operating characteristic curves and corresponding AUCs with 95% confidence intervals of the LLR6 (blue curves) and LLR2 (orange curves) models. P values, two-tailed DeLong’s test. The LLR2 model takes two variables, that is, patient TMB and PD-L1 TPS, as the input. In the figure, ‘n’ represents the number of participants. The dashed lines in a and d represent random performance, serving as a baseline with an AUC of 0.5. This indicates the performance expected from a classifier making random guesses. e-f. Forest plots of HRs of PFS (e) and OS (f) within each data set using LLR2 LORIS (binned at 0.46, which maximizes the Youden’s index on the training data). P values, multivariable Cox proportional hazards regression with adjustment for cancer type and age. Squares positioned at midpoints symbolize point estimates of HRs, and the accompanying bars indicate 95% confidence intervals. In the figure, the samples represent the number of participants.
Extended Data Fig. 7 |
Extended Data Fig. 7 |. Comparison of predictive performance of the pan-cancer LLR6 model, the RF6 model and TMB biomarker on non-NSCLC participants.
a. Receiver operating characteristic curves and corresponding AUCs with 95% confidence intervals of LLR6 (blue curves), RF6 (green curves), and the TMB biomarker (yellow curves) on the training set and across multiple unseen test sets. In the figure, ‘n’ represents the number of participants. The dashed lines represent random performance, serving as a baseline with an AUC of 0.5. This indicates the performance expected from a classifier making random guesses. b. Distribution of LORIS, RF6 score, and TMB alone in responders and non-responders on the training set and across multiple unseen test sets. P values, two-tailed Mann–Whitney U test. Box boundaries represent the first and third quartiles; the central line marks the median. Whiskers extend to the furthest non-outlier points within 1.5 times the interquartile range. Outliers are shown as points beyond the whiskers. c-d. Kaplan–Meier analysis of OS. TMB is binned at 10 mutations per Mb and LORIS is binned at 0.5 for panel c; TMB is binned at the highest 20th percentile and LORIS is binned at the 50th percentile for each cancer type for panel d. HRs with 95% confidence intervals are shown. P values, univariable Cox proportional hazards regression. H, high; L, low. In the risk tables, the numbers represent the number of participants. Data are from combined Chowell test and MSK1 sets, with all NSCLC patients excluded from the analysis (n = 633 participants).
Extended Data Fig. 8 |
Extended Data Fig. 8 |. Monotonic relationship between pan-cancer LORIS and patient objective response probability & survival following immunotherapy among non-NSCLC participants.
a, b. Relationship between LORIS (a) or TMB (b) and ICB objective response probability. The average participant response probabilities with 95% confidence intervals are shown using 1,000-replicate bootstrapping. The grey region represents participants with an unlikely response to immunotherapy (with a response probability below 10%), while the green regions represent participants with a likely response (with a response probability exceeding 50%). The arrows indicate the LORIS and TMB threshold values. c, d. Kaplan–Meier analysis of OS. LORIS (c) and TMB (d) are binned at the different percentiles in each cancer type. P values next to the legend indicate pairwise single-tail comparisons testing against the hypothesis that ‘higher scored participants do not have better survival than lower scored participants’ with univariable Cox proportional hazards regression. HRs with 95% confidence intervals are shown for the lowest-percentile (0–10%) and the highest-percentile groups (90–100%) with univariable Cox proportional hazards regression. In the risk tables, the numbers represent the number of participants. Data are from combined Chowell test and MSK1 sets, with all NSCLC participants excluded from the analysis (n = 633 participants).
Extended Data Fig. 9 |
Extended Data Fig. 9 |. LORIS performance is maintained after removing NSCLC participants (a) or removing cancer type information (b).
a. Comparison of predictive performance among non-NSCLC participants between the original pan-cancer LLR6 model and a new LLR6 model trained without including NSCLC participants. Receiver operating characteristic curves and corresponding AUCs with 95% confidence intervals of the original pan-cancer LLR6 model (w/; blue curves) and a new LLR6 model trained without including NSCLC participants (w/o; orange curves). Number of participants in different cohorts is displayed in the figure. In the figure, ‘n’ represents the number of participants. P values, two-tailed DeLong’s test. Note that all NSCLC participants are excluded from the analysis. b. Comparison of predictive performance between the pan-cancer LLR6 model with and without the utilization of the cancer type calibration term. Receiver operating characteristic curves and corresponding AUCs with 95% confidence intervals of the original pan-cancer LLR6 model (LLR6; blue curves) and; orange curves). Number of participants in different cohorts is displayed in the figure. In the figure, ‘n’ represents the number of participants. P values, two-tailed DeLong’s test. The dashed lines represent random performance, serving as a baseline with an AUC of 0.5. This indicates the performance expected from a classifier making random guesses.
Extended Data Fig. 10 |
Extended Data Fig. 10 |. Comparison of predictive performance between the LLR6 models and the LLR5 models that exclude a patient′s systemic therapy history.
a. Receiver operating characteristic curves and corresponding AUCs with 95% confidence intervals of the pan-cancer LLR6 (blue curves) and LLR5 (orange curves) models. Number of participants in different cohorts is displayed in the figure. In the figure, ‘n’ represents the number of participants. P values, two-tailed DeLong’s test. b. Receiver operating characteristic curves and corresponding AUCs with 95% confidence intervals of the NSCLC-specific LLR6 (blue curves) and LLR5 (orange curves) models. Number of participants in different cohorts is displayed in the figure. In the figure, ‘n’ represents the number of participants. P values, two-tailed DeLong’s test.
Fig. 1 |
Fig. 1 |. Overview of the study.
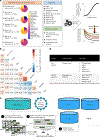
a, Description of the study aims and data used. The study aimed to develop and validate machine learning models to predict patient objective response probability and survival benefit following immunotherapy. b, Correlation among features measured on a continuous scale at the pan-cancer level (n = 2,881 participants). P values were determined by Spearman’s rank test, adjusted by Bonferroni correction. *, adjusted P < 0.05; **, adjusted P < 0.01; ***, adjusted P < 0.001. c, Schematic representation of the training, validation and independent testing procedures used to develop and evaluate the predictive models. For each machine learning architecture, the hyperparameter was tuned with fivefold cross-validation. After determination of the hyperparameters, the models were evaluated using various performance metrics with 2,000 repeats of fivefold cross-validation. Lastly, the selected models were tested on multiple unseen test cohorts to assess their generalizability. d, The two types of models built, that is, the pan-cancer and NSCLC-specific models, and the corresponding training and test data used.
Fig. 2 |
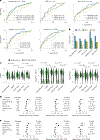
Fig. 2 |. Robust prediction of pan-cancer objective response to immunotherapy by a six-variable LLR model.
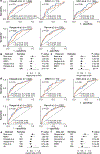
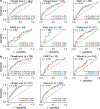
a, Receiver operating characteristic curves and corresponding AUCs with 95% CIs of LLR6 (blue curves), RF6 (green curves) and the TMB biomarker (yellow curves) on the training set and across multiple unseen test sets. In the figure, n represents the number of participants. The dashed lines represent random performance, serving as a baseline with an AUC of 0.5. This indicates the performance expected from a classifier making random guesses. b, Distribution of LORIS, RF6 score and TMB alone in responders and nonresponders on the training set and across multiple unseen test sets. P values were determined by a two-tailed Mann–Whitney U test. Box boundaries represent the first and third quartiles; the central line marks the median. Whiskers extend to the furthest nonoutlier points within 1.5 times the interquartile range. Outliers are shown as points beyond the whiskers. c, AUPRCs and odds ratios of the ICB objective response of LLR6 (blue bars), RF6 (green bars) and the TMB biomarker (yellow bars) on the training set and across multiple unseen test sets. The number of participants in different cohorts is displayed in a.
Fig. 3 |
Fig. 3 |. LORIS predicts patient outcomes following immunotherapy for both pan-cancer and individual cancer types.
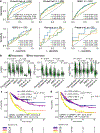
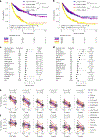
a, Kaplan–Meier analysis of OS. TMB is binned at 10 mutations per Mb and LORIS is binned at 0.5. HRs with 95% CIs are shown. P values were determined by univariable Cox proportional hazards regression. H, high; L, low. In the risk table, the numbers represent the numbers of participants. b, Same as a but TMB is binned at the highest 20th percentile and LORIS is binned at the 50th percentile for each cancer type. HRs with 95% CIs are shown. P values were determined by univariable Cox proportional hazards regression. c,d, Forest plot of HRs of OS within each cancer type using LORIS (binned at the 50th percentile) (c) or TMB (binned at the highest 20th percentile) (d). P values were determined by multivariable Cox proportional hazards regression with adjustment for cancer type, age, ICB drug class and year of ICB start. Squares positioned at midpoints symbolize point estimates of HRs and the accompanying bars indicate 95% CIs. e,f, Comparison of half-year, 1-year, 2-year, 3-year, 4-year and 5-year OS stratified by cancer type for high versus low LORIS (binned at the 50th percentile) (e) and high versus low TMB (binned at the highest 20th percentile) (f). Median survival probability differences (Δ) are displayed. P values were determined by two-tailed paired Wilcoxon rank sum test. Box boundaries represent the first and third quartiles; the central line marks the median. Whiskers extend to the furthest nonoutlier points within 1.5 times the interquartile range. Data are from the combined Chowell test and MSK1 sets (n = 968 participants).
Fig. 4 |
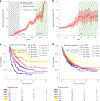
Fig. 4 |. Monotonic relationship between LORIS and patient objective response probability and survival following immunotherapy.
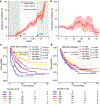
a,b, Relationship between LORIS (a) or TMB (b) and ICB objective response probability. The average patient response probabilities with 95% CIs are shown using 1,000 bootstrap replicates. The gray region represents participants with an unlikely response to immunotherapy (with a response probability below 10%), while the green regions represent participants with a likely response (with a response probability exceeding 50%). The arrows indicate the LORIS and TMB threshold values. c,d, Kaplan–Meier analysis of LORIS (c) or TMB (d) binned at the different percentiles in each cancer type. P values next to the legend indicate pairwise single-tail comparisons testing against the hypothesis that ‘higher-scored participants do not have better survival than lower-scored participants’ with univariable Cox proportional hazards regression. HRs with 95% CIs are shown for the lowest-percentile (0–10%) and the highest-percentile (90–100%) groups with univariable Cox proportional hazards regression. Data are from the combined Chowell test and MSK1 sets (n = 968 participants).
Fig. 5 |
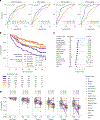
Fig. 5 |. LORIS exhibits enhanced predictive efficacy for immunotherapy with respect to its prognostic value in the context of non-ICB treatments.
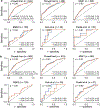
a, Receiver operating characteristic curves and corresponding AUCs with 95% CIs of LORIS on 0.5-year, 1-year, 2-year and 3-year OS of participants treated with ICB (blue curves) or non-ICB (orange curves) therapies. P values were determined by two-tailed DeLong’s test (non-ICB, n = 841 participants; ICB, n = 968 participants). The dashed lines represent random performance, serving as a baseline with an AUC of 0.5. This indicates the performance expected from a classifier making random guesses. b, Kaplan–Meier analysis of LORIS binned at the different percentiles in each cancer type for the non-ICB cohort. P values were determined by univariable Cox proportional hazards regression (single tail). HRs with 95% CIs are shown for the lowest-percentile (0–10%) and the highest-percentile (90–100%) groups (n = 841 participants). c, Forest plot of HRs of OS within each cancer type using LORIS (binned at the 50th percentile) for the non-ICB cohort. P values were determined by multivariable Cox proportional hazards regression with adjustment for cancer type and age. Squares positioned at midpoints symbolize the point estimates of HRs and the accompanying bars indicate the 95% CIs. d, Comparison of half-year, 1-year, 2-year, 3-year, 4-year and 5-year OS stratified by cancer type for high versus low LORIS (binned at the 50th percentile) for the non-ICB cohort. Median survival probability differences (Δ) are displayed. P values were determined by two-tailed paired Wilcoxon rank sum test. Box boundaries represent the first and third quartiles; the central line marks the median. Whiskers extend to the furthest nonoutlier points within 1.5 times the interquartile range. ICB data are from the combined Chowell test and MSK1 sets (n = 968 participants). Non-ICB data are from the MSK non-ICB cohort (n = 841 participants; Extended Data Fig. 1).
Fig. 6 |
Fig. 6 |. Robust prediction of response to immunotherapy in NSCLC with LLR.
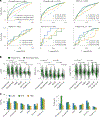
a, Receiver operating characteristic curves and corresponding AUCs with 95% CIs of LLR6 (blue curves), PD-L1 TPS (green curves) and TMB (yellow curves) on the training set and across multiple unseen test sets. In the figure, n represents the number of participants. The dashed lines represent random performance, serving as a baseline with an AUC of 0.5. This indicates the performance expected from a classifier making random guesses. b, Odds ratio of ICB objective response of LLR6 (blue bars), PD-L1 TPS (green bars) and TMB (yellow bars) on the training set and across multiple unseen test sets. c, Distribution of LORIS, PD-L1 TPS and TMB in responders and nonresponders on the training set and across multiple unseen test sets. P values were determined by a two-tailed Mann–Whitney U test. Box boundaries represent the first and third quartiles; the central line marks the median. Whiskers extend to the furthest nonoutlier points within 1.5 times the interquartile range. Outliers are shown as points beyond the whiskers. d,e, Forest plots of HRs of PFS (d) and OS (e) within each dataset using LORIS (binned at 0.44, which maximized Youden’s index on the training data), PD-L1 TPS (binned at 50%) or TMB (binned at 10 mutations per Mb). P values were determined by multivariable Cox proportional hazards regression with adjustment for sex, age and ICB drug class. Squares positioned at midpoints symbolize the point estimates of HRs and the accompanying bars indicate the 95% CIs. The number of participants in different cohorts is displayed in a.
Fig. 7 |
Fig. 7 |. LORIS facilitates more precise ICB response prediction.
a, Receiver operating characteristic curves and corresponding AUCs of the NSCLC-specific LLR6 model (blue curves), the PD-L1 TPS biomarker (green curves) and the TMB biomarker (yellow curves) on gastric cancer, esophageal cancer and mesothelioma. In the figure, n represents the number of participants. The dashed lines represent random performance, serving as a baseline with an AUC of 0.5. This indicates the performance expected from a classifier making random guesses. b, A summary of this study. LORIS, a clinical score derived from this study, estimates ICB response probabilities using LLR that identifies and integrates a few key features from three categories: tumor molecular data, blood measurements and patient clinical information. LORIS provides precise, patient-specific predictions of ICB therapy efficacy.

References

    1. Topalian SL, Taube JM, Anders RA & Pardoll DM Mechanism-driven biomarkers to guide immune checkpoint blockade in cancer therapy. Nat. Rev. Cancer 16, 275–287 (2016). - PMC - PubMed
    1. Morad G, Helmink BA, Sharma P & Wargo JA Hallmarks of response, resistance, and toxicity to immune checkpoint blockade. Cell 184, 5309–5337 (2021). - PMC - PubMed
    1. Nishino M, Ramaiya NH, Hatabu H & Hodi FS Monitoring immune-checkpoint blockade: response evaluation and biomarker development. Nat. Rev. Clin. Oncol. 14, 655–668 (2017). - PMC - PubMed
    1. Goodman AM et al. Tumor mutational burden as an independent predictor of response to immunotherapy in diverse cancers. Mol. Cancer Ther. 16, 2598–2608 (2017). - PMC - PubMed
    1. Samstein RM et al. Tumor mutational load predicts survival after immunotherapy across multiple cancer types. Nat. Genet. 51, 202–206 (2019). - PMC - PubMed

Publication types

Substances