. 2024 Jul;5(7):1045-1062.
doi: 10.1038/s43018-024-00775-4. Epub 2024 Jun 3.

Tumor-associated macrophages restrict CD8+ T cell function through collagen deposition and metabolic reprogramming of the breast cancer microenvironment

Affiliations

Tumor-associated macrophages restrict CD8+ T cell function through collagen deposition and metabolic reprogramming of the breast cancer microenvironment

Kevin M Tharp et al. Nat Cancer. 2024 Jul.

Abstract

Tumor progression is accompanied by fibrosis, a condition of excessive extracellular matrix accumulation, which is associated with diminished antitumor immune infiltration. Here we demonstrate that tumor-associated macrophages (TAMs) respond to the stiffened fibrotic tumor microenvironment (TME) by initiating a collagen biosynthesis program directed by transforming growth factor-β. A collateral effect of this programming is an untenable metabolic milieu for productive CD8+ T cell antitumor responses, as collagen-synthesizing macrophages consume environmental arginine, synthesize proline and secrete ornithine that compromises CD8+ T cell function in female breast cancer. Thus, a stiff and fibrotic TME may impede antitumor immunity not only by direct physical exclusion of CD8+ T cells but also through secondary effects of a mechano-metabolic programming of TAMs, which creates an inhospitable metabolic milieu for CD8+ T cells to respond to anticancer immunotherapies.


Conflict of interest statement

Competing interests

The authors declare no competing interests.

Figures

Extended Data Fig. 1 |
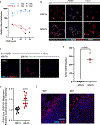
Extended Data Fig. 1 |. Tumor progression is associated with ECM synthetic myeloid programming.
a. H&E-stained histological sections of 8 week and 11 week FVB/N PyMT mammary tumors, quantification of the grade of stromal fibrosis (n = 10 or 9 mice). b. Quantification of pathological assessment for area of hyperplasia, DCIS with early invasion (DCIS) and advanced invasion (invasion) within H&E-stained histological sections of 8 week and 11 week FVB/N PyMT mammary tumors (n = 10 or 9 mice). c. Representative second-harmonic generation (SHG) images of collagen fibers in 11 week old FVB/N PyMT mammary tumors, treated with anti-CSF1 blocking antibody or IgG control weekly from 4 weeks of age until 11 weeks of age (n = 3 mice), (scale bar: 100 µm). d. Relative expression of macrophage polarization-associated gene expression of TAMs derived from 11 week old FVB/N PyMT mammary tumors, relative to TAMs derived from 8 week old PyMT mammary tumors, (n = 5 mice). e. Representative immunofluorescence microscopy of Collagen VI (white) and DNA (blue) of 11 week old FVB/N PyMT mammary tumors treated with or without LOX-inhibition, representative of the effect observed in 2 independent experiments (n = 4 mice) (scale bar: 100 µm). f. Representative immunofluorescence microscopy of F4/80 (red) and DNA (blue) in 11 week old FVB/N PyMT mammary tumors, representative localization of every tumor-stroma border assessed (n = >10 mice from > 10 independent experiments) (scale bar: 40 µm). g. Representative immunofluorescence microscopy of Collagen VI (white) and DNA (blue) of BMDMs treated with or without 5 ng/mL IL4 and 1 ng/mL TGFβ1 on fibroblast synthesized ECM surfaces for 24 h, representative of the effect observed in 3 independent experiments (scale bar: 40 µm). Data shown represent ± SEM via two-tailed unpaired Student t test (b).
Extended Data Fig. 2 |
Extended Data Fig. 2 |. ECM-synthetic stage II and IIIA tumors are associated with poor survival.
Kaplan-Meier survival curves of 2506 stage II and IIIA breast tumors, stratified for the top and bottom quartile expression level of the genes comprising the top GO category identified in d (Cox Proportional Hazard model: p = 0.0364, z = 2.092432; LogRank: p = 0.0346).
Extended Data Fig. 3 |
Extended Data Fig. 3 |. TGFβ1 signaling and production is mechanosensitive.
a. Relative gene expression of IL4-polarized BMDMs cultured on soft (400 Pa) or stiff (60k Pa) collagen I-coated polyacrylamide hydrogel surfaces treated with 0, 0.1, 1, or 10 ng/mL TGFβ1 for 4 h, qPCR-ΔΔCT normalized to BMDMs treated without IL4 (housekeeping gene: 18 s), (n = 3 independent experiments). b. Representative immunofluorescence microscopy for RETNLA (red) and DNA (blue) of IL4-polarized BMDMs cultured on soft (400 Pa) or stiff (60k Pa) collagen I-coated polyacrylamide hydrogel surfaces, treated with 1 ng/mL TGFβ1 with or without 10 µg/mL TGFβ1-blocking antibody (1D.11) for 24 h, representative of the effect observed in 3 independent experiments (scale bar: 20 µm). c. Representative immunofluorescence microscopy for phosphorylated-SMAD2/3 (red) and DNA (blue) of IL4-polarized BMDMs cultured on soft (400 Pa) or stiff (60k Pa) collagen I-coated polyacrylamide hydrogel surfaces, treated with 1 ng/mL TGFβ1 with or without 10 µg/mL TGFβ1-blocking antibody (1D.11) for 24 h, representative of the effect observed in 3 independent experiments (scale bar: 40 µm). d. Active TGFβ1 in culture medium after 48 h of culture of IL4-polarized BMDMs cultured on soft (400 Pa) or stiff (60k Pa) collagen I-coated polyacrylamide hydrogel surfaces. (n = 4 independent experiments) e. Relative luminescent intensity of TGFβ1-reporter (PAI-1 Luc) expressing mink lung epithelial cells when cultured for 24 h in 1:1 conditioned media from IL4-polarized BMDMs cultured on soft (400 Pa) or stiff (60k Pa), (n = 9, 3 independent experiments of 3 technical replicates). f. Representative immunofluorescence microscopy of f4/80 (red), and DNA (blue) of stiff collagen orthotopic C57BL/6J PyMT mammary after 3 weeks of growth in Tgfbr2MyeKO or control animals, (n = 3 mice) (scale bar: 100 µm). Data shown represent ± SEM via two-tailed unpaired Student t test (d-e).
Extended Data Fig. 4 |
Extended Data Fig. 4 |. Arginine, TGFβ1, and ECM stiffness affect myeloid ECM synthesis and metabolism.
a. Relative arginine concentrations of stiff collagen orthotopic C57BL/6J PyMT mammary tumors in Tgfbr2MyeKO or control animals for 3 weeks, LC-MS analysis, (n = 7 or 6 mice). b. Representative immunofluorescence microscopy of Collagen VI (orange) and DNA (blue) of IL4-polarized WT or Arg1KO BMDMs cultured with or without 0.4 mM arginine on stiff (60k Pa) collagen I-coated polyacrylamide hydrogel surfaces treated with 1 ng/mL TGFβ1 for 24 h, representative of the effect observed in 3 independent experiments (scale bar:40 µm). c. Relative hydroxyproline (Pro-OH) concentration in BMDMs cultured on soft (400 Pa) or stiff (60k Pa) collagen I-coated polyacrylamide hydrogel surfaces with or without 1 ng/mL TGFβ1 for 24 h, measured via LC-MS, (n = 3 independent experiments). d. Fractional contributions (all isotopologues, m + 5 or m + 3) of 13C derived from 13C5-glutamine in BMDMs cultured on soft (400 Pa) or stiff (60k Pa) collagen I-coated polyacrylamide hydrogel surfaces in medium containing 12C5-glutamine, treated with 1 ng/mL TGFβ1 for 22 h, swapped for fresh medium containing 13C5-glutamine for 2 h, BMDMs were harvested and measured via LC-MS, (n = 3 independent experiments). e. Fractional contributions (all isotopologues, m + 5 or m + 3) of 13C derived from 13C5-glutamine in WT or Tgfbr2MyeKO BMDMs cultured on soft (400 Pa) or stiff (60k Pa) collagen I-coated polyacrylamide hydrogel surfaces in medium containing 12C5-glutamine, treated with or without 1 ng/mL TGFβ1 for 22 h, swapped for fresh medium containing 13C5-glutamine for 2 h, BMDMs were harvested and measured via LC-MS, (n = 3 independent experiments). f. Cellular respirometry of BMDMs cultured with or without 1 ng/mL TGFβ1 for 24 h or 100 ng/mL LPS for 1 h along with sequential additions via injection ports of Oligomycin [1 µM final], FCCP [1 µM final], and Antimycin A/Rotenone [1 µM final] during respirometry measurements, measured with an SeahorseXF24, (n = 5 wells, repeated 3 times) g-i. Relative g. NADH h. NAD i. NADH/NAD ratio in BMDMs cultured on soft (400 Pa) or stiff (60k Pa) collagen I-coated polyacrylamide hydrogel surfaces with or without 1 ng/mL TGFβ1 for 24 h, measured via LC-MS, (n = 3). Data shown represent ± SEM via two-tailed unpaired Student t test (a, d, and f) or one-way ANOVA with Tukey test for multiple comparisons (c, e, g-i) and **P < 0.01 via, ns indicates statistically not significant.
Extended Data Fig. 5 |
Extended Data Fig. 5 |. Arginine improves CTL tumor infiltration.
a. LC-MS based metabolomics of medium after 3 h of culture of Arg-ECN or ECN metabolizing a modified M9 medium, lacking ammonia, supplemented with ornithine [3 mM], (n = 3 independent experiments). b. Using the BRCA1 dataset from the Cancer Atlas of Metabolic Profiles we compared the levels of arginine and proline in 61 breast tumor to 47 normal adjacent tissues. c. Graphical description of the experimental setup for c-d. d. Tumor mass after 3 weeks of growth in C57BL/6J mice gavaged daily with 2 g/kg glycine, ornithine, arginine, or water, (n = 8 mice) e. Relative serum metabolites derived from retro-orbital isolated blood from mice containing PyMT tumors after 3 weeks of growth in C57BL/6J mice gavaged daily with 2 g/kg glycine, ornithine, arginine, or water (100 µL), 4 h prior to isolation of blood/serum, measured with LC-MS (n = 8 mice pooled and measured as 2 technical replicates). f. Quantitation of cleaved-caspase 3+ %-area per field view of tumor border zone of 3 week old tumors from C57BL/6J mice gavaged daily with 2 g/kg glycine, ornithine, arginine, or water (n = 5 mice). g. Quantitation of CD8+ %-area per field view from the core of 3 week old tumors from C57BL/6J mice gavaged daily with 2 g/kg glycine, ornithine, arginine, or water (n = 4 mice). h. Representative thesholded-area mask for CD8+ from the core of 3 week old tumors from C57BL/6J mice gavaged daily with 2 g/kg glycine, ornithine, arginine, or water (n = 4 mice) (scale bar: 100 µm). i. Representative immunofluorescence microscopy for CD8+ from the core of 3 week old tumors from C57BL/6J mice gavaged daily with 2 g/kg glycine, ornithine, arginine, or water (n = 4 mice) (scale bar: 100 µm). j. Representative immunofluorescence microscopy of CD8+ morphologies observed in orthotopic PyMT mammary tumors in Tgfbr2MyeKO mice gavaged daily with 2 g/kg ornithine (n = 5 mice) (scale bar: 10 µm). Data shown represent ± SEM via two-tailed unpaired Student t test (a) or one-way ANOVA with Tukey test for multiple comparisons (c-e, & f-g).
Extended Data Fig. 6 |
Extended Data Fig. 6 |. Ornithine alters CTL metabolism.
a. Heat map of relative metabolite levels of CD3/CD28-activated CD8+ CTLs cultured for 24 h in medium containing a molar ratio of 1:1 [0.5 mM], 3:1 [1.5 mM], and 9:1 [4.5 mM] ornithine:arginine, LC-MS analysis. (n = 3 independent experiments). b. Graphical description of the experimental setup and fractional contribution of 13C5-ornithine to intracellular ornithine in CD3/CD28-activated CD8+ CTLs cultured for 24 h with and without 1 mM Arginine (12C) present in medium, LC-MS analysis, (n = 3 independent experiments). c. Heat map of differentially abundant metabolite levels in b, LC-MS analysis. (n = 3 independent experiments). d. Representative immunofluorescence microscopy of OVA-PyMT tumor cells challenged with GFP+-OTI CTLs (green) for 24 h in medium containing a molar ratio of 1:1 [0.5 mM] or 3:1 [1.5 mM] ornithine:arginine, cleaved-caspase 3 (red) and DNA (blue), representative of the effect observed in 4 independent experiments (scale bar: 40 µm).
Fig. 1 |
Fig. 1 |. Tumor fibrosis and ECM stiffening promote a collagen ECM-synthetic phenotype in myeloid cells.
a, Representative birefringence of collagen fibers through polarized light microscopy of PS-red-stained 8- and 11-week-old FVB/N PyMT mammary tumors; related quantification in b (scale bar, 100 µm). b, Percentage area of the PyMT tumor determined to be fibrillar collagen with PS-red staining (n = 13 or 15 mice). c, Quantification of TAMs found within PyMT mammary tumors from 8- or 11-week-old FVB/N mice, using a FACS gating strategy (Supplementary Fig. 1) (n = 9 mice). d, Quantitation of the percentage of CD11clow/CD11bhigh and CD11chigh/CD11blow tumor-infiltrating CD45+ cell types in PyMT mammary tumors from 8- or 11-week-old FVB/N mice (n = 9 mice). e, Graphical representation of the experimental setup for f. f, GO enriched in TAMs derived from 11-week-old FVB/N PyMT mammary tumors relative to TAMs derived from 8-week-old tumors (n = 5 mice). g, Relative gene expression comparing the top GO category identified in f for TAMs derived from mammary tumors from 11-week-old FVB/N PyMT mice treated with or without LOXi in the drinking water (~3 mg kg−1 per day) (n = 5 mice). Data shown represent ±s.e.m. by two-tailed unpaired Student t test (bd), Benjamini–Hochberg corrected one-tailed t test (f) or edgeR-determined differential expression of transcript abundance (g).
Fig. 2 |
Fig. 2 |. Immune-rich tumors have less ECM-synthetic myeloid cells.
a, Bubble plot of collagen gene expression of the tumor-associated myeloid compartment from the Immunoprofiler cohort (IPI) containing 12 different solid tumor types, grouped by cluster/archetype identified in the IPI cohort. Mo, monocyte; Mp, macrophage; DC dendritic cell; DC2, type 2 dendritic cell. b, Spearman rank correlation of the gene set variation analysis of the top GO category identified in Fig. 1f and macrophage polarization signatures of tumor transcriptomes collected from TCGA repository (TCGA projects: pancreatic adenocarcinoma, lung adenocarcinoma, glioblastoma multiforme, breast invasive carcinoma, kidney renal clear cell carcinoma). LPS, lipopolysaccharide.
Fig. 3 |
Fig. 3 |. ECM-synthetic TAMs affect tumor growth and T cell composition.
a, An xy plot of relative genes comprising the GO category ‘collagen-containing ECM’ in TAMs derived from 11-week-old FVB/N PyMT mammary tumors relative to TAMs derived from 8-week-old PyMT mammary tumors. TRRUST (transcriptional regulatory relationships unraveled by sentence-based text mining) transcription factor enrichment analysis: P value—SMAD1 (10−6) and SP1 (10−2.8); combined scores—SMAD1 (127.699827), SMAD4 (90.48497202), SMAD3 (48.37819162), SMAD2 (46.66904886) and SP1 (6.551517203). b, Representative immunofluorescence microscopy of collagen VI (ColVI, white) and DNA (blue) in IL-4-polarized BMDMs cultured on soft (400 Pa) or stiff (60,000 Pa) collagen I-coated polyacrylamide hydrogel surfaces treated with 1 ng ml−1 TGFβ1 for 24 h; representative effect of every replicate experiment (n = >10 independent experiments) (scale bar, 20 µm). c, Graphical representation of the experimental setup for dj. d, Representative immunofluorescence microscopy of collagen VI or XII (white) and DNA (blue) in stiff-collagen orthotopic C57BL/6J PyMT mammary tumors after 3 weeks of growth in Tgfbr2MyeKO or control animals; related quantification in e (scale bar, 100 µm). e, Quantitation of immunofluorescence microscopy of collagen VI (top) or XII (bottom) in stiff-collagen orthotopic C57BL/6J PyMT mammary tumors after 3 weeks of growth in Tgfbr2MyeKO or control animals; each trace represents the mean fluorescence intensity (MFI) of collagen VI or XII across four transverse sections of the tumor–stromal border (starting ~50 µm into the stroma and 125–300 µm into the tumor) (n = 5 mice averaged in each trace). f, Quantification of tumor masses accumulated after 3 weeks of in vivo growth of stiff-collagen orthotopic C57BL/6J PyMT mammary tumors in Tgfbr2MyeKO or control animals (n = 13 or 11 mice). g, Representative immunofluorescence microscopy of cleaved caspase-3 (green) and DNA (blue) in stiff-collagen orthotopic C57BL/6J PyMT mammary tumors after 3 weeks of growth in Tgfbr2MyeKO or control animals; related quantification in h (scale bar, 100 µm). h, Quantitation of cleaved caspase-3 percentage area per field view in the representative image in g (n = 5 mice). i, Quantification of tumor-infiltrating CD8+ T cells as a percentage of CD45+ cell types found in stiff-collagen C57BL/6J orthotopic PyMT mammary tumors after 3 weeks of growth in Tgfbr2MyeKO or control animals (n = 8 or 6 mice). j, Ratio of tumor-infiltrating CD8+ to CD4+ cell types in stiff-collagen orthotopic C57BL/6J PyMT mammary tumors after 3 weeks of growth in Tgfbr2MyeKO or control animals (n = 8 or 6 mice). Data shown represent ±s.e.m. by two-tailed unpaired Student t test (f, hj).
Fig. 4 |
Fig. 4 |. Arginine metabolism in ECM-synthetic myeloid cells affects tumor ECM and T cell abundance.
a, Relative arginine concentration in mammary tumors from 11-week-old C57BL/6J PyMT mice treated with or without LOXi in the drinking water (~3 mg kg−1 per day); LC–MS analysis (n = 3 mice). b, Relative ornithine and proline concentrations in mammary tumors from 11-week-old C57BL/6J PyMT mice treated with or without LOXi in the drinking water (~3 mg kg−1 per day); LC–MS analysis (n = 3 mice). c, Relative ornithine and proline concentrations in stiff-collagen orthotopic C57BL/6J PyMT mammary tumors after 3 weeks of growth in Tgfbr2MyeKO or control animals; LC–MS analysis (n = 7 or 6 mice). d, Relative medium concentrations of arginine and ornithine from a culture with IL-4-polarized BMDMs treated with or without 1 ng ml−1 TGFβ1 for 22 h, swapped for fresh medium for 2 h, which was measured by LC–MS analysis (n = 3 independent experiments). e, Graphical depiction of the observed relationship between TGFβ1 signaling and ECM stiffness in the context of collagen synthesis and proline metabolism. f, Graphical representation (top) of the experimental setup for gj and Kaplan–Meier survival curve (bottom) of Arg1MyeKO or LysM-Cre tumor-bearing C57BL/6J mice (time until the tumor reached 2 cm in diameter) (n = 16 mice, two separate cohorts of 8 mice per genotype). Mantel–Cox test: χ2 = 25.30, degree of freedom (d.f.) = 1 and P < 0.0001. g, Representative immunofluorescence microscopy of collagen VI (white) and DNA (blue) in Arg1MyeKO or LysM-Cre C57BL/6J tumors; related quantification in h (scale bar, 100 µm). h, Quantitation of collagen VI percentage area per field view in the representative image in g (n = 5 animals and two images of each). i, Representative immunofluorescence microscopy of cleaved caspase-3 (red), CD8 (white) and DNA (blue) in Arg1MyeKO or LysM-Cre C57BL/6J tumors; related quantification in j (scale bar, 100 µm). j, Quantitation of cleaved caspase-3 percentage area per field view in the representative image in i (n = 5 animals and two images of each). Data shown represent ±s.e.m. by two-tailed unpaired Student t test (ad and hj) or Mantel–Cox (f).
Fig. 5 |
Fig. 5 |. TGFβ1 and ECM stiffness regulate arginine-to-ornithine metabolism in myeloid cells.
a, Graphical representation of the experimental setup for bd. b, 13C tracing of [13C6]arginine metabolism into [13C5]proline in BMDMs cultured on soft (400 Pa) or stiff (60,000 Pa) collagen I-coated polyacrylamide hydrogel surfaces in a medium containing [12C6]arginine, treated with or without 1 ng ml−1 TGFβ1 for 20 h then swapped for fresh medium containing [13C6]arginine for 4 h; BMDMs were harvested and measured by LC–MS (n = 3 independent experiments). c, Relative ornithine concentration in BMDMs cultured on soft (400 Pa) or stiff (60,000 Pa) collagen I-coated polyacrylamide hydrogel surfaces with or without 1 ng ml−1 TGFβ1 for 24 h, measured by LC–MS (n = 3 independent experiments). d, Relative proline concentration in BMDMs cultured on soft (400 Pa) or stiff (60,000 Pa) collagen I-coated polyacrylamide hydrogel surfaces with or without 1 ng ml−1 TGFβ1 for 24 h, measured by LC–MS (n = 3 independent experiments). e, Relative concentrations of metabolites in the culture medium of IL-4-polarized BMDMs cultured on soft (400 Pa) or stiff (60,000 Pa) collagen I-coated polyacrylamide hydrogel surfaces treated with or without 1 ng ml−1 TGFβ1 for 24 h and then swapped for fresh serum-free medium for 24 h, measured by LC–MS analysis (n = 3 independent experiments). f, Graphical representation of the experimental setup for g. g, Relative concentrations of ornithine in the culture medium of IL-4-polarized BMDMs cultured on stiff (60,000 Pa) collagen I-coated polyacrylamide hydrogel surfaces treated with 1 ng ml−1 TGFβ1 for 24 h with or without 1 µM CB-1158, measured by LC–MS analysis (n = 3 independent experiments). h, Graphical representation of the experimental setup for i. i, Relative concentrations of ornithine in the culture medium of IL-4-polarized Arg1KO BMDMs cultured on soft (400 Pa) or stiff (60,000 Pa) collagen I-coated polyacrylamide hydrogel surfaces treated with 1 ng ml−1 TGFβ1 for 24 h, measured by LC–MS analysis (n = 3 independent experiments). Data shown represent ±s.e.m. by one-way analysis of variance (ANOVA) with Tukey test for multiple comparisons (be) or two-tailed unpaired Student t test (g and i).
Fig. 6 |
Fig. 6 |. Ornithine alters CTL function.
a, Graphical description of the experimental setup for bf. b, Percentage of CD8+ CTLs among CD45+ cells isolated from stiff-collagen PyMT tumors after 3 weeks of growth in C57BL/6J mice gavaged daily with 2 g kg−1 glycine, ornithine, arginine or water (100 µl) (n = 8 mice). c, Percentage of CD44+PD-1+ cells among CD8+ CTLs isolated from stiff-collagen PyMT tumors after 3 weeks of growth in C57BL/6J mice gavaged daily with 2 g kg−1 glycine, ornithine, arginine or water (100 µl) (n = 8 mice). d, MFI of PD-1 staining of endogenous CD8+ CTLs isolated from stiff-collagen PyMT tumors after 3 weeks of growth in C57BL/6J mice gavaged daily with 2 g kg−1 glycine, ornithine, arginine or water (100 µl) (n = 8 mice). gMFI, geometric MFI. e, MFI of CD69 staining of endogenous CD8+ CTLs isolated from stiff-collagen PyMT tumors after 3 weeks of growth in C57BL/6J mice gavaged daily with 2 g kg−1 glycine, ornithine, arginine or water (100 µl) (n = 8 mice). f, Quantification of Ki-67 incorporation into endogenous CD8+ CTLs isolated from stiff-collagen PyMT tumors after 3 weeks of growth in C57BL/6J mice gavaged daily with 2 g kg−1 glycine, ornithine, arginine or water (100 µl) and stimulated ex vivo with PMA (50 ng ml−1) and ionomycin (500 ng ml−1) (n = 8 mice). g, Graphical description of the experimental setup for h. h, Quantification of tumor masses accumulated after 3 weeks of in vivo growth of soft- or stiff-collagen orthotopic PyMT mammary tumors in Tgfbr2MyeKO or control mice gavaged daily with 2 g kg−1 ornithine (n = 9 or 10 mice). i, Heat map of relative metabolite levels in CD3/CD28-activated CD8+ CTLs cultured for 72 h in a medium containing a molar ratio of 3:1 ornithine/arginine; the medium was refreshed every 24 h, and samples were analyzed by LC–MS (n = 3 independent experiments). GSSG, oxidized glutathione; UDP-GlcNAc, uridine diphosphate N-acetylglucosamine; GABA, γ-aminobutyric acid; AMP, adenosine monophosphate; NADPH, nicotinamide adenine dinucleotide phosphate. j, Representative immunofluorescence microscopy of stiff-collagen OVA-PyMT tumor organoids challenged with GFP+ OT-I CTLs (green) for 24 h in a medium containing a molar ratio of 1:1 (0.5 mM) or 3:1 (1.5 mM) ornithine/arginine, cleaved caspase-3 (red) and DNA (blue), representative of the effect observed in four independent experiments (scale bar, 40 µm). Data shown represent ±s.e.m. by one-way ANOVA with Tukey test for multiple comparisons (bf) or two-tailed unpaired Student t test (h).
Fig. 7 |
Fig. 7 |. Ornithine impairs anti-PD-1 therapy in stiff-collagen PyMT tumor models.
a, Kaplan–Meier survival curve of PyMT tumor-bearing C57BL/6J mice gavaged daily with 2 g kg−1 ornithine or water (100 µl) and treated with isotype control or anti-PD-1 blocking antibodies on days 5, 9 and 13 (time until the tumor reached 2 cm in diameter) (n = 8). Mantel–Cox test, isotype (water) versus anti-PD-1 (water): χ2 = 5.925, d.f. = 1 and P = 0.0149. Mantel–Cox test, isotype (water) versus anti-PD-1 (ornithine): χ2 = 2.282, d.f. = 1 and P = 0.1309. b, Tumor volume measurements of stiff-collagen PyMT tumors in C57BL/6J mice gavaged daily with 2 g kg−1 ornithine or water (100 µl) and treated with isotype control or anti-PD-1 blocking antibodies on days 5, 9 and 13 (n = 8 mice, error bars indicate the s.d.). cf, Concentration of ornithine (c), arginine (d), proline (e) and glutamine (f) in TIF derived from PyMT tumors in C57BL/6J mice gavaged daily with 2 g kg−1 ornithine or water (100 µl) at the terminal endpoint; LC–MS analysis (n = 7 mice). g, Heat map of relative amino acid concentrations in TIF derived from PyMT tumors in C57BL/6J mice gavaged daily with 2 g kg−1 ornithine or water (100 µl) at the terminal endpoint, grayscale intensity indicates fold change; LC–MS analysis (n = 7 mice). h, Graphical description of the experimental setup for i and j. i, Tumor volume measurements of stiff-collagen PyMT tumors over 4 weeks of growth in C57BL/6J mice gavaged daily with 2 g kg−1 glycine, ornithine or arginine (100 µl) for the first 14 days and treated with isotype control or anti-PD-1 blocking antibodies on days 5, 9 and 13 (n = 8 mice, error bars indicate the s.d.). j, Kaplan–Meier survival curves for the experiment depicted in h. Mean survival of mice supplemented with glycine and treated with isotype control and mice supplemented with ornithine and treated with anti-PD-1 blockade: 21 days. Mean survival of mice supplemented with glycine and arginine and treated with anti-PD-1 blockade: 28 days. Mantel–Cox test, anti-PD-1 (arginine) versus anti-PD-1 (ornithine): χ2 = 5.644, d.f. = 1 and P = 0.0175. k, Graphical representation of the identified relationship between the TME, infiltrating myeloid cells, mechano-metabolic programming and CTLs in the TME. Data shown represent ±s.e.m. or s.d. (b and i) by Mantel–Cox (a and j) or one-way ANOVA with Tukey test for multiple comparisons (c, e and f) or two-tailed unpaired Student t test (b, d and i).

References

    1. Galon J et al. Type, density, and location of immune cells within human colorectal tumors predict clinical outcome. Science 313, 1960–1964 (2006). - PubMed
    1. Tumeh PC et al. PD-1 blockade induces responses by inhibiting adaptive immune resistance. Nature 515, 568–571 (2014). - PMC - PubMed
    1. Bagaev A et al. Conserved pan-cancer microenvironment subtypes predict response to immunotherapy. Cancer Cell 39, 845–865 (2021). - PubMed
    1. Sun X et al. Tumour DDR1 promotes collagen fibre alignment to instigate immune exclusion. Nature 599, 673–678 (2021). - PMC - PubMed
    1. Nicolas-Boluda A et al. Tumor stiffening reversion through collagen crosslinking inhibition improves T cell migration and anti-PD-1 treatment. eLife 10, e58688 (2021). - PMC - PubMed

MeSH terms