. 2024 Jun;25(6):969-980.
doi: 10.1038/s41590-024-01846-5. Epub 2024 Jun 3.

Genetic variants in UNC93B1 predispose to childhood-onset systemic lupus erythematosus

Affiliations

Genetic variants in UNC93B1 predispose to childhood-onset systemic lupus erythematosus

Mahmoud Al-Azab et al. Nat Immunol. 2024 Jun.

Erratum in

Abstract

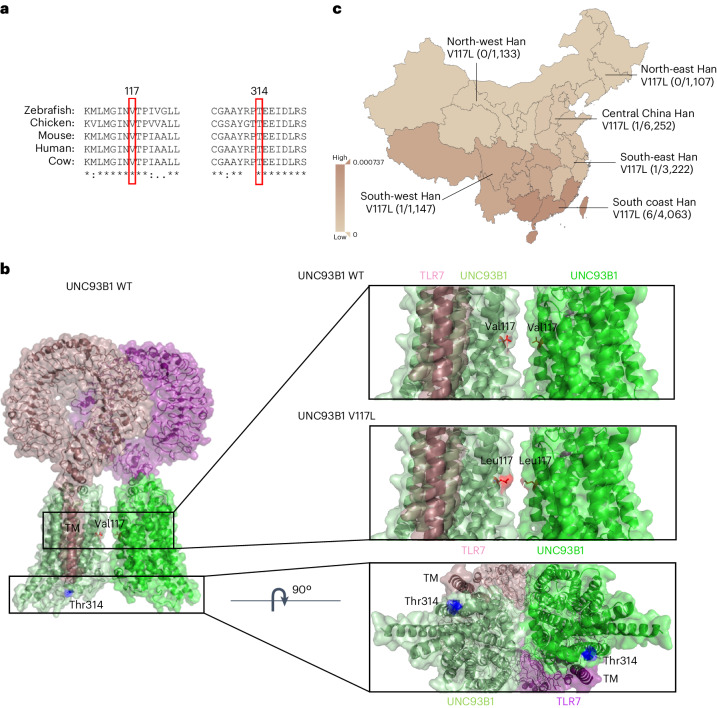
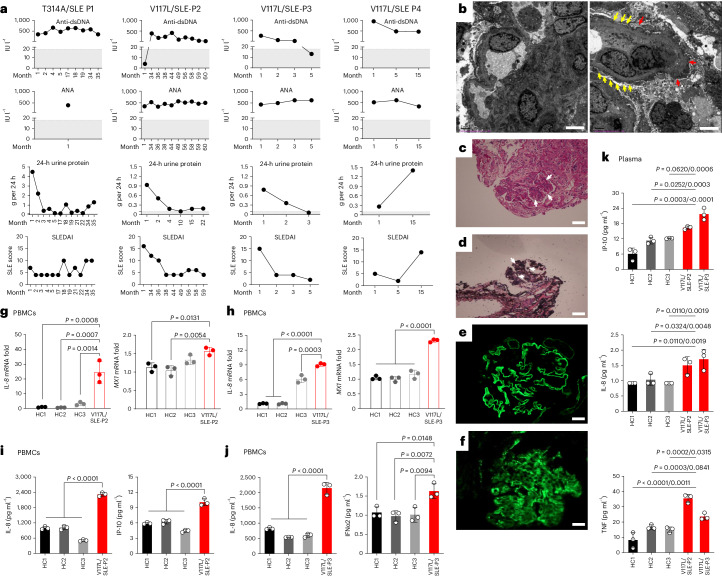
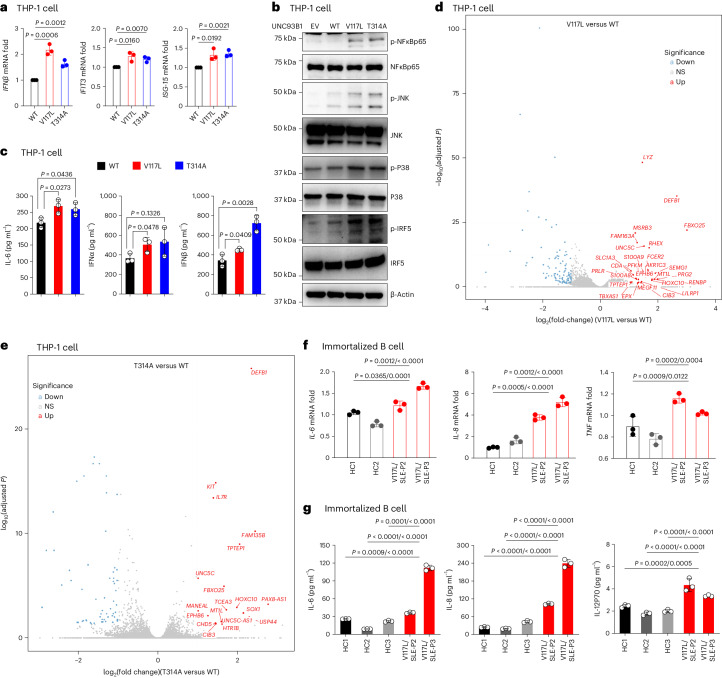
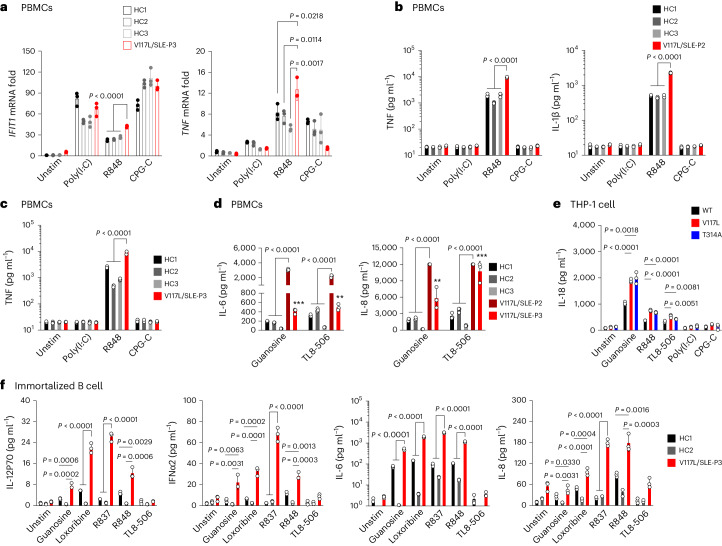
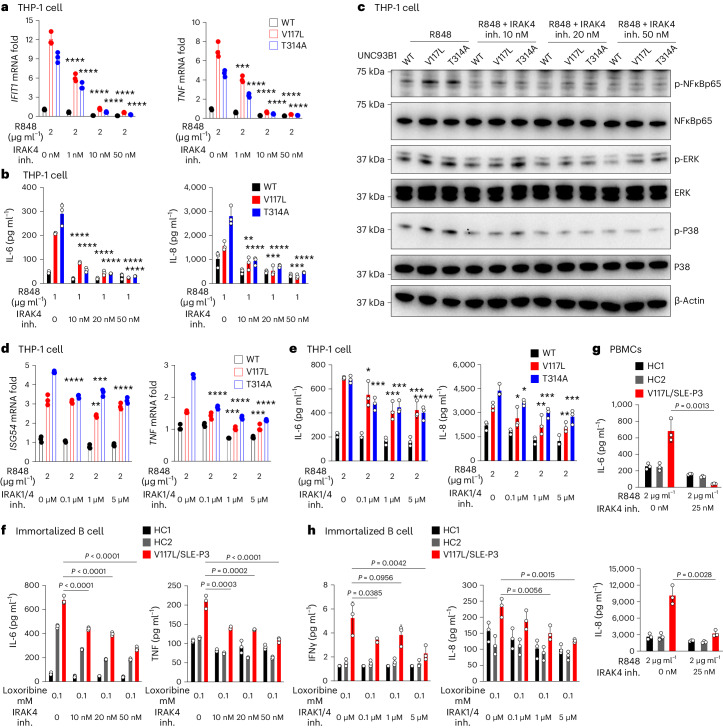
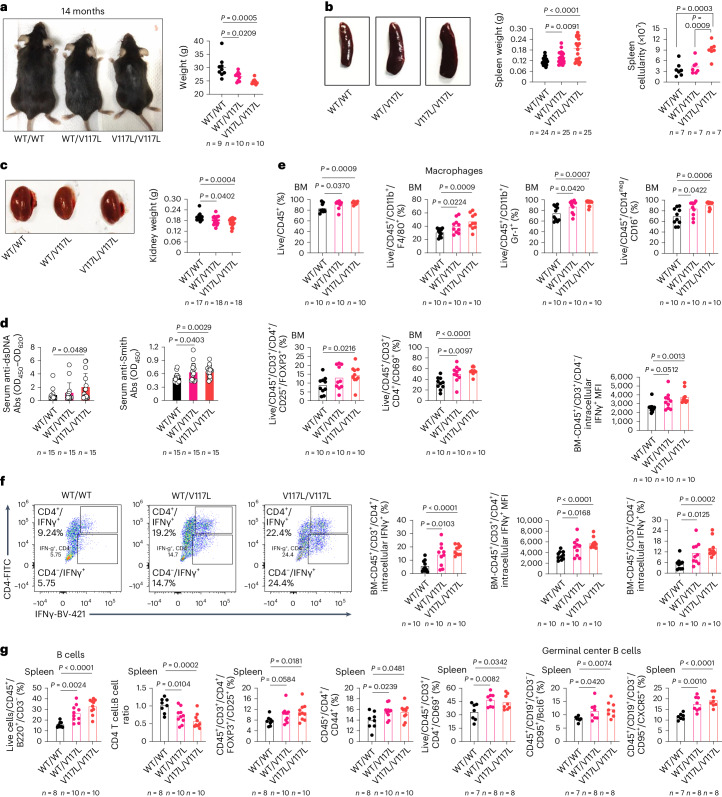
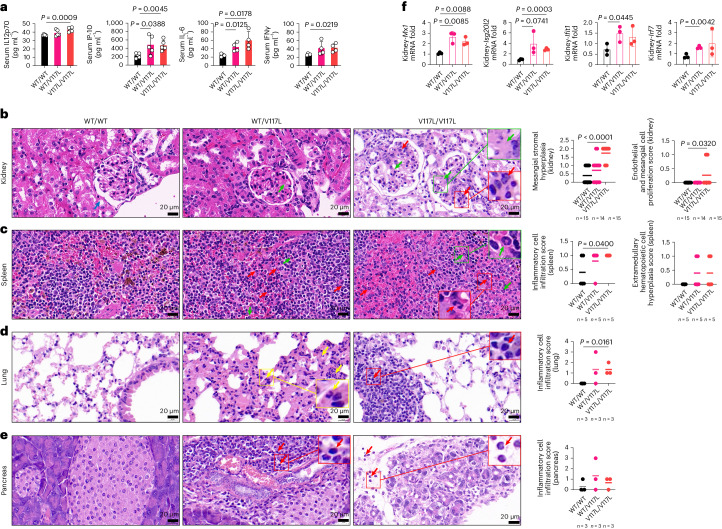
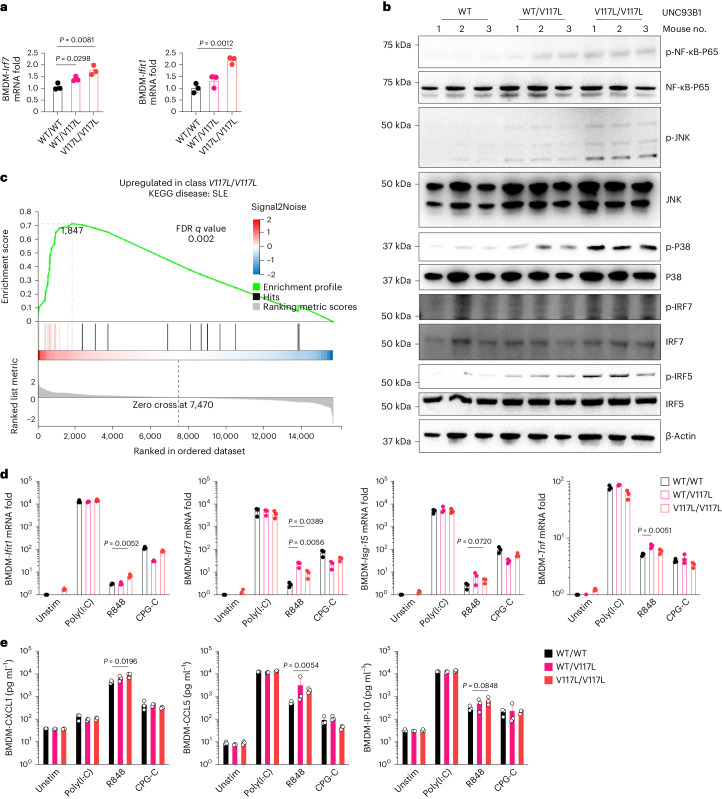
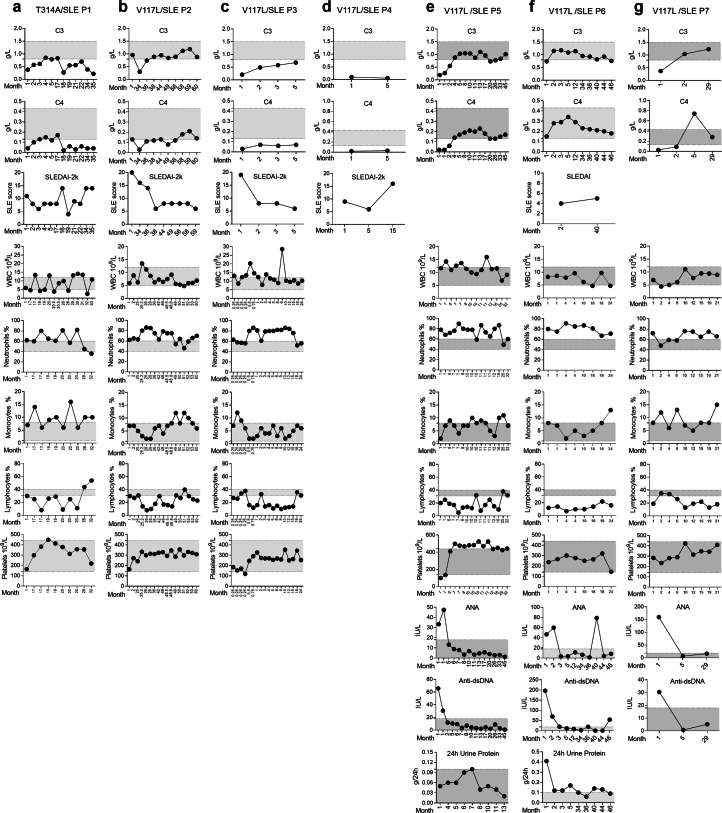
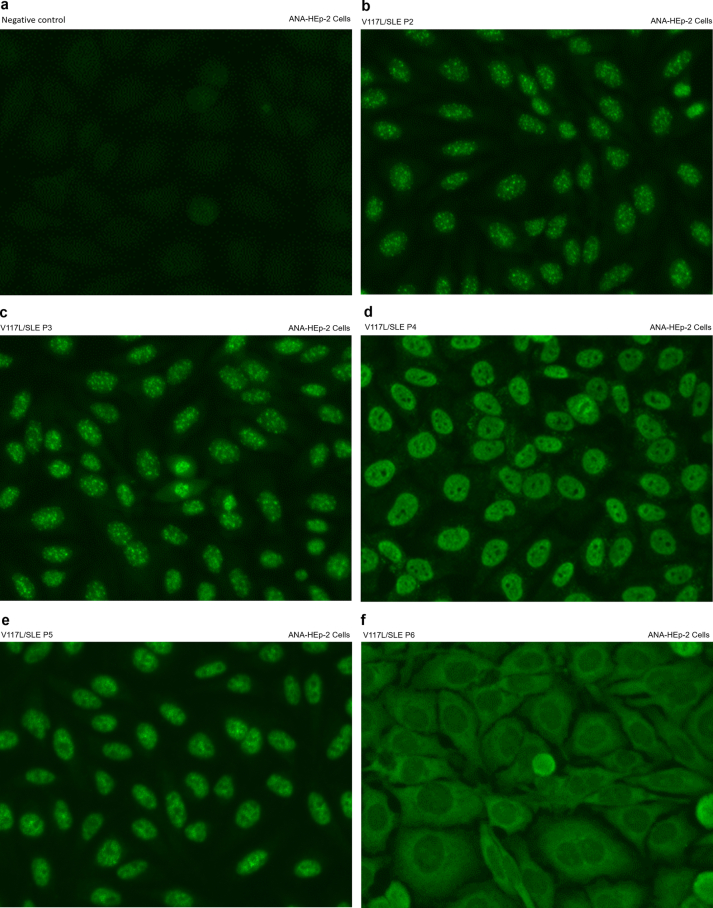
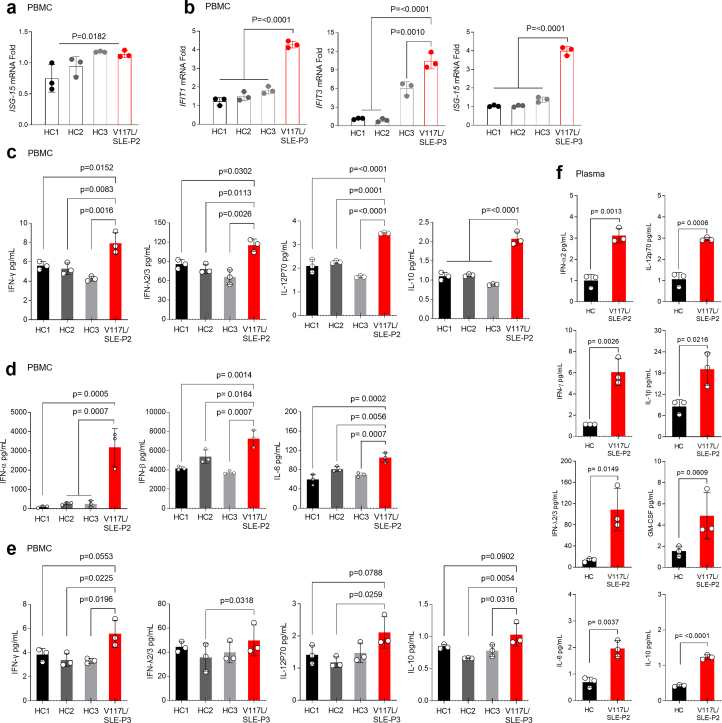
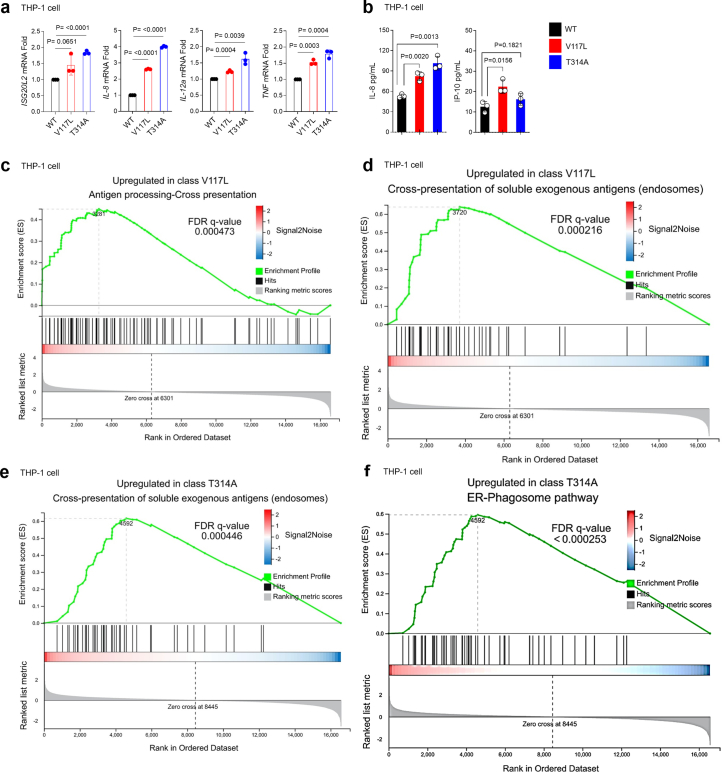
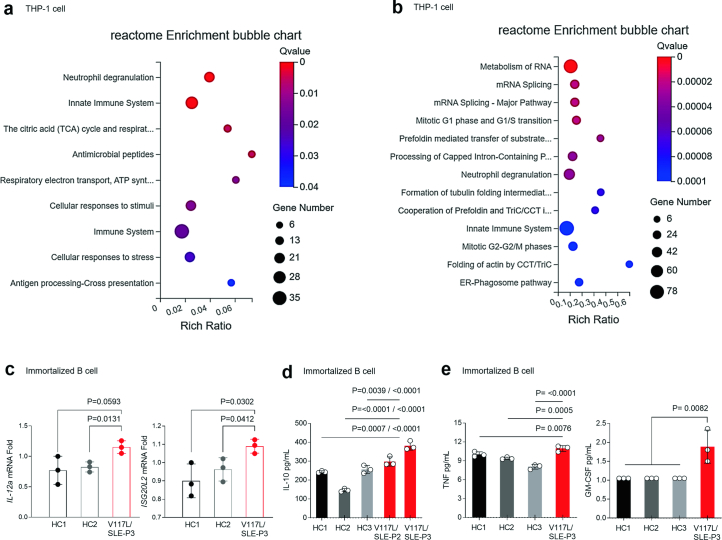
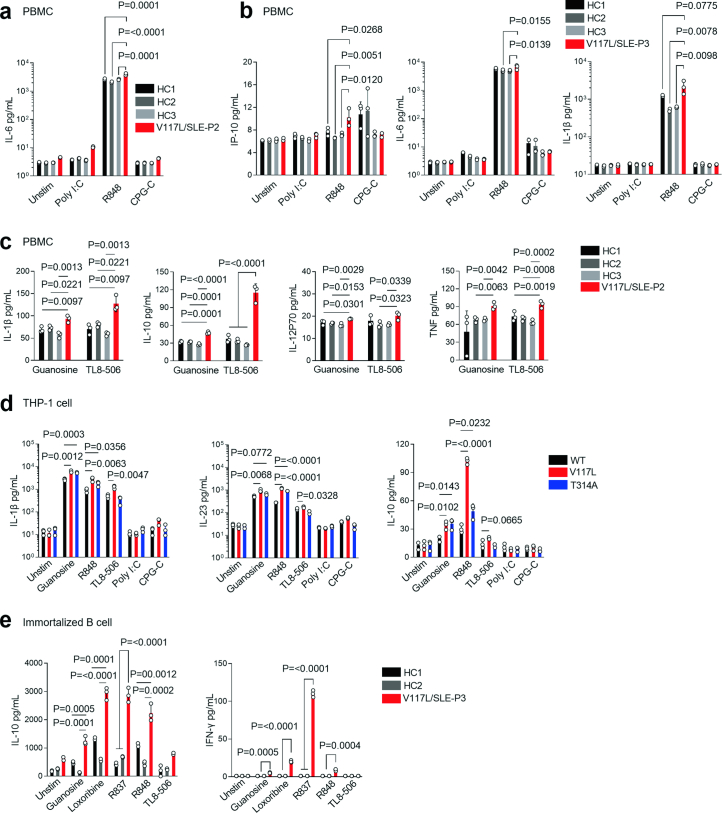
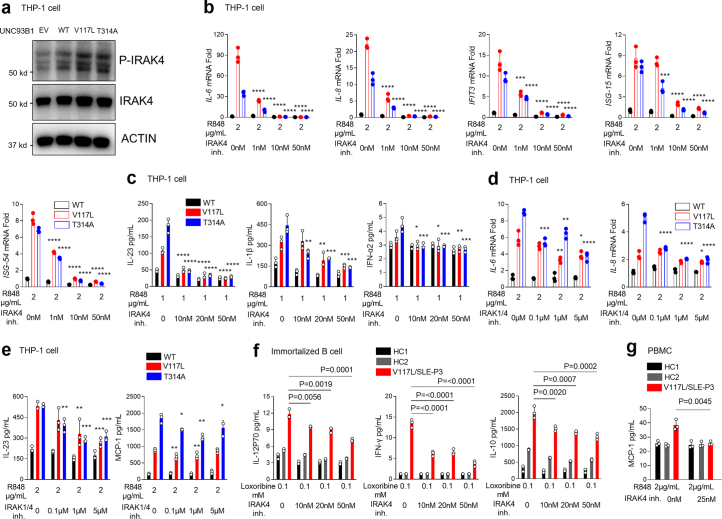
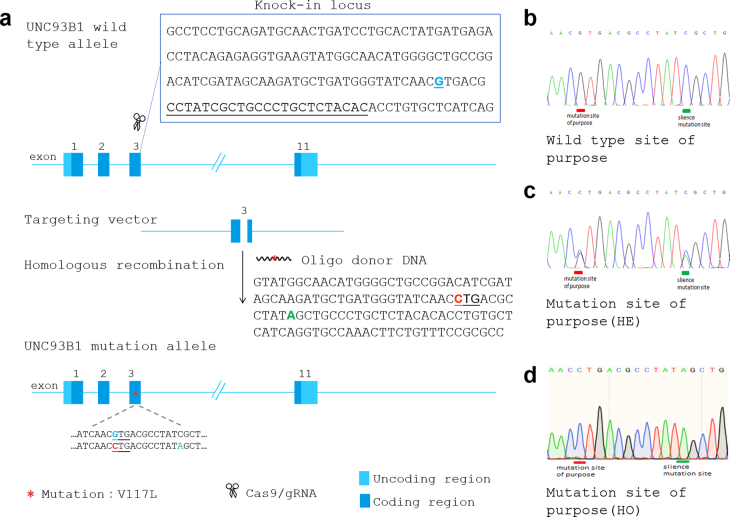
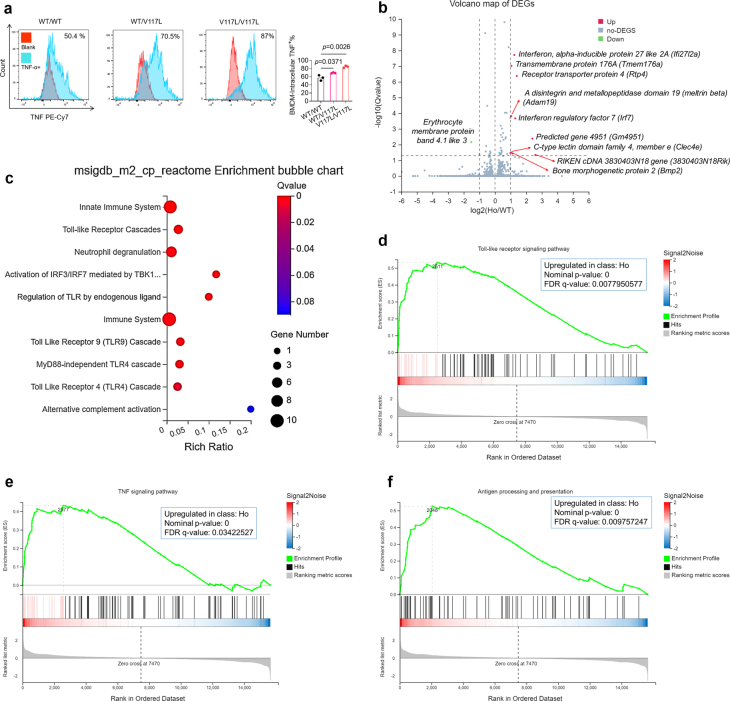
Rare genetic variants in toll-like receptor 7 (TLR7) are known to cause lupus in humans and mice. UNC93B1 is a transmembrane protein that regulates TLR7 localization into endosomes. In the present study, we identify two new variants in UNC93B1 (T314A, located proximally to the TLR7 transmembrane domain, and V117L) in a cohort of east Asian patients with childhood-onset systemic lupus erythematosus. The V117L variant was associated with increased expression of type I interferons and NF-κB-dependent cytokines in patient plasma and immortalized B cells. THP-1 cells expressing the variant UNC93B1 alleles exhibited exaggerated responses to stimulation of TLR7/-8, but not TLR3 or TLR9, which could be inhibited by targeting the downstream signaling molecules, IRAK1/-4. Heterozygous mice expressing the orthologous Unc93b1V117L variant developed a spontaneous lupus-like disease that was more severe in homozygotes and again hyperresponsive to TLR7 stimulation. Together, this work formally identifies genetic variants in UNC93B1 that can predispose to childhood-onset systemic lupus erythematosus.


Conflict of interest statement

S.L.M. is a scientific advisor for Odyssey therapeutics and NRG therapeutics. The other authors declare no competing interests.

Figures

Fig. 1
Fig. 1. Conservation, structural location and geographical distribution of UNC93B1 SLE variants.
a, Amino acid conservation across five species, as indicated, for residues surrounding the variants of interest in UNC93B1. b, UNC93B1 (Protein Data Bank (PDB) 7CYN) shown in light green and green (surface and cartoon representations) with Thr314 shown as blue sticks on H2. TLR7 protomers are shown in purple and magenta (surface and cartoon representations). Val117 and Leu117 are shown as red sticks between the interface of two UNC93B1 protomers. The structural analysis software used was Pymol v.2.5.8. c, UNC93B1 V117L variant local geographical distribution.
Fig. 2
Fig. 2. Clinical characteristics related to UNC93B1 T314A and V117L variants.
a, Anti-dsDNA autoantibodies (normal range (NR), <18 IU l−1), ANA autoantibodies (NR, <18 IU l−1), 24-h urinary protein (NR, 0–0.1 g per 24 h) and SLEDAI score of disease for P1 (T314A), P2, P3 and P4 (all V117L). Data are for monthly visits postdiagnosis. NR is highlighted in gray. bf, Kidney pathology for patient with UNC93B1 T314A. b, Transmission electron microscopy showing two glomeruli, capillary endothelial cell proliferation, vacuolar degeneration, RBCs, monocytes and neutrophil aggregation in little vascular loops. The podocyte foot process has diffuse effacement (yellow arrows), with the cell swollen and cavitated. The basement membrane has diffuse thickening up to 1,300 nm (red arrows), P1. Scale bar, 4 μm. c, Periodic acid–Schiff (PAS) stain showing thickening of the basement membrane and mesangial and endothelial cell proliferation (white arrows), P1. Scale bar, 50 μm. d, PAS methenamine (PASM) stain showing thickening of the basement membrane and a small number of platinum ear-like structures (white arrows), P1. Scale bar, 50 μm. e, Immunofluorescence for collagen IV of the glomerular basement membrane showing α3+ve, α5+ve, P1. Scale bar, 20 μm. f, Immunofluorescence of kidney tissue showing complement 3 deposition, P1. Scale bar, 20 μm. g, RT–qPCR analysis of IL-8 and MX1 mRNA expression in the PBMCs of P2 compared with healthy controls. h, RT–qPCR analysis of IL-8 and MX1 mRNA expression in the PBMCs of P3 compared with healthy controls. i, Production of IL-8 and IP-10 in the supernatant of PBMCs isolated from P2 and healthy controls measured by CBA. j, Production of IL-8 and IFNα2 in the supernatant of PBMCs isolated from P3 and healthy controls measured by CBA. PBMCs in gj were isolated from patients’ whole blood and incubated in media for 12 h before analysis without stimulation. k, Levels of IP-10, IL-8 and TNF in the plasma from P2 and P3 compared with healthy controls measured by CBA. For gk, n = 3 biological samples; indicated P values were determined by two-way ANOVA, multiple comparisons, Padj value; data are presented as mean with s.d. Source data
Fig. 3
Fig. 3. V117L and T314A UNC93B1 variants spontaneously induce IFN and NF-κB signaling pathways.
a, RT–qPCR analysis of IFNβ, IFIT3 and ISG-15 expression in the indicated THP-1 cell lines (n = 3 biological replicates). There were three independent experiments. b, Levels of phosphorylated NF-κB, JNK, p38 and IRF5, as measured by immunoblotting, in lysates of the indicated THP-1 cells. Data are representative of three independent experiments. c, Production of IL-6, IFNα and IFNβ in the indicated THP-1 cell lines (n = 3, three independent experiments measured by ELISA). The indicated P values in a and c were determined using unpaired, two-tailed Student’s t-test; the data are presented as the mean with s.d. d,e, RNA-seq was performed for UNC93B1V117L (d) and UNC93B1T314A (e) THP-1 cells compared with WT. DEGs are presented as a volcano plot and mRNA was extracted from THP-1 of UNC93B1WT, UNC93B1V117L and UNC93B1T314A (n = 3 biological replicates). f, RT–qPCR analysis of IL-6, IL-8 and TNF expression in the indicated immortalized B cell lines (baseline) (n = 3 biological replicates). g, Production of IL-6, IL-8 and IL-12p70 in the indicated immortalized B cell lines (baseline) (n = 3 biological replicates, measured by CBA). The indicated P values in f and e were determined by two-way ANOVA, multiple comparison, Padj value; data are presented as mean with s.d. Source data
Fig. 4
Fig. 4. UNC93B1 genetic variation drives inflammation via TLR7/-8.
a, RT–qPCR analysis of IFIT1 and TNF mRNA expression in the PBMCs of P3 compared with healthy controls after stimulation by 10 μg ml−1 of HMW poly(I:C), 1 μg ml−1 of R848 and 4 μg ml−1 of CPG-C for 12 h (n = 3 biological samples). Unstim, Unstimulated. b, Production of TNF and IL-1β in the supernatant of PBMCs of P2 compared with healthy controls after stimulation by 10 μg ml−1 of HMW poly(I:C), 1 μg ml−1 of R848 and 4 μg ml−1 of CPG-C for 8 h (n = 3 biological samples). c, Production of TNF in the supernatant of PBMCs of P3 compared with healthy controls after stimulation by 10 μg ml−1 of HMW poly(I:C), 1 μg ml−1 of R848 and 4 μg ml−1 of CPG-C for 12 h (n = 3 biological samples). d, Production of IL-6 and IL-8 in the supernatant of PBMCs of P2 and P3 compared with healthy controls after stimulation by 1 mM guanosine and 200 ng ml−1 of TL8-506 for 24 h (n = 3 biological samples). The P value in IL-6, P3 (guanosine set), was 0.0001 compared with HC1 and <0.0001 with HC2 and HC3, and in the TL8-506 set it was 0.0034 compared with HC1 and <0.0001 with HC3. The P value in IL-8, P3 (guanosine set), was 0.0053 compared with HC1, 0.0065 with HC2 and 0.0008 with HC3 and, in the TLR8-506 set, was 0.0001 compared with HC1, 0.0003 with HC2 and <0.0001 with HC3. The indicated P values in ad were determined by two-way ANOVA, multiple comparisons, Padj value; data are presented as the mean with s.d. e, Production of IL-18 in the supernatant of THP-1 of indicated variants after stimulation by 0.7 mM guanosine, 1 μg ml−1 of R848, 200 ng ml−1 of TL8-506, 100 μg ml−1 of HMW poly(I:C) and 5 μg ml−1 of CPG-C for 24 h (n = 3 biological replicates); the indicated P values were determined by unpaired, two-tailed Student’s t-test and data are presented as the mean with s.d. f, Production of IL-12p70, IFNα2, IL-6 and IL-8 in the supernatant of indicated immortalized B cell lines after stimulation by 0.5 mM guanosine, 0.1 mM loxoribine, 2.5 μg ml−1 of R837, 1 μg ml−1 of R848 and 200 ng ml−1 of TL8-506 for 24 h (n = 3 biological replicates). The indicated P values in f were determined by two-way ANOVA, multiple comparisons, Padj value; data are presented as the mean with s.d. Production of cytokines in the cells supernatant was measured by CBA. Source data
Fig. 5
Fig. 5. UNC93B1 genetic variation drives inflammation via IRAK1/-4.
a, RT–qPCR analysis of IFIT1 and TNF expression in the indicated THP-1 cell lines, stimulated by R848 for 24 h after being incubated with IRAK4 inhibitor (inh.) for 30 min. ***P = 0.0002, ****P < 0.0001. b, Production of IL-6 and IL-8 in the supernatant of the indicated THP-1 cell lines, stimulated by R848 for 24 h after being incubated with IRAK4 inhibitor for 30 min. ****P < 0.0001, **P = 0.0021, ***P = 0.0003 (20 nM set), ***P = 0.0001 (50 nM set). c, Levels of phosphorylated NF-κB, ERK and P38, as measured by immunoblotting using lysates of the indicated THP-1 cells, stimulated by 1 μg ml−1 of R848 for 24 h after being incubated with IRAK4 inhibitor for 30 min. Data are representative of three independent experiments. d, RT–qPCR analysis of ISG54 and TNF expression in the indicated THP-1 cell lines, stimulated by R848 for 24 h after being incubated with IRAK1/-4 inhibitor for 30 min. In ISG54, **P = 0.0025, ***P = 0.0001, ****P < 0.0001, and in TNF, ***P = 0.0002, ***P = 0.0003, ****P < 0.0001, respectively. e, Production of IL-6 and IL-8 in the supernatant of the indicated THP-1 cell lines, stimulated by R848 for 24 h after being incubated with IRAK1/-4 inhibitor for 30 min. In IL-6: *P = 0.0212, ***P = 0.0002, ***P = 0.0008, ***P = 0.0001, ***P = 0.0009, ****P < 0.0001, respectively, and in IL-8, *P = 0.0334, *P = 0.0107, **P = 0.0041, ***P = 0.0005, **P = 0.0024, ***P = 0.0002, respectively. f, Production of IL-6 and TNF in the supernatant of the indicated immortalized B cell lines, stimulated by loxoribine for 24 h after being incubated with IRAK4 inhibitor for 30 min. g, Production of IL-6 and IL-8 in the supernatant of the indicated PBMCs, stimulated by R848 for 24 h after being incubated with and without IRAK4 inhibitor for 30 min. The indicated P values were determined by unpaired, two-tailed Student’s t-test (n = 3 biological samples). h, Production of IFNγ and IL-8 in the supernatant of the indicated immortalized B cell lines, stimulated by loxoribine for 24 h after being incubated with IRAK1/-4 inhibitor for 30 min. Production of cytokines in the cell supernatant was measured by CBA. For all experiments, data are presented as the mean with s.d. For a, b, df and h, n = 3 biological replicates; the indicated P values were determined by two-way ANOVA, multiple comparisons, Padj value. Source data
Fig. 6
Fig. 6. UNC93B1V117L mice develop lupus-like disease.
a, Appearance and weight of UNC93B1WT/WT, UNC93B1WT/V117L and UNC93B1V117L/V117L mice. b, Spleen weight (data pooled from three independent experiments) and splenocyte count of indicated mice. Mice were age matched to 8–14 months. c, Kidney weight of indicated mice. Mice were age matched to 8–14 months and the data pooled from two independent experiments. d, Serum autoantibodies to dsDNA or Smith for the indicated mice. Mice were age matched to 8–14 months and the data pooled from three independent experiments. e, Flow cytometric analysis of indicated immune cell populations in BM of UNC93B1WT/WT, UNC93B1WT/V117L and UNC93B1V117L/V117L mice. Mice were age matched to 8 months. f, Intracellular cytokine staining of IFNγ in BM CD4+ T cells and CD3+/CD4 cells of the indicated mice. MFI, mean fluorescence intensity. Mice were age matched to 8 months. g, Flow cytometric analysis of indicated immune cell populations in spleen of UNC93B1WT/WT, UNC93B1WT/V117L and UNC93B1V117L/V117L mice (n as indicated). Mice were age matched to 8 months (for B cells, CD4 T cell:B cell ratio, regulatory T cells and CD45+/CD4+/CD44+ cells) or 14 months (for activated T cells, germinal center B cells and CD45+/CD19+/CD3/CD95+/CXCR5+ cells). n as indicated. Statistical analysis was done using unpaired, two-tailed Student’s t-tests and data are presented as the mean with s.d. The exact P values are shown. Abs, absorbance; OD, optical density. Source data
Fig. 7
Fig. 7. UNC93B1V117L mice develop systemic inflammation and organ damage.
a, Serum IL-12p70, IP-10, IL-6 and IFNγ of the indicated mice (n = 5 for IL-12p70 and IP-10; n = 4 for IL-6 and IFNγ). IP-10 mice were aged 8 months and IL-12p70, IL-6 and IFNγ mice 10 months. b, H&E staining of the kidneys from indicated mice (n as indicated). The green arrows indicated mesangial stromal hyperplasia and the red arrows endothelial and mesangial proliferation. Mice were age matched to 8–14 months and the data pooled from three independent experiments. c, H&E staining of the spleens from the indicated mice (n = 5). The green arrows indicated the extramedullary hematopoietic cells and the red arrows the inflammatory cells. Mice were age matched to 8 months. d, H&E staining of the lungs from the indicated mice (n = 3). The yellow arrows (granulocytes) and red arrow (lymphocytes) indicated inflammatory cell infiltration; mice were aged 14 months. e, H&E staining of the pancreata from the indicated mice (n = 3). The red arrows indicate inflammatory cell infiltration (granulocytes or lymphocytes) and the mice were aged 14 months. The graphs show the pathological disease scores. f, RT–qPCR analysis of Mx1, Isg20l2, Ifit1 and Irf7 mRNA in kidney tissues from the indicated mice (n = 3). Mice were age matched to 8 months. Statistical analysis was done using unpaired, two-tailed Student’s t-tests and data are presented as mean with s.d. The exact P values are shown. Source data
Fig. 8
Fig. 8. UNC93B1V117L drives increased inflammation and TLR7 responses in mice.
a, RT–qPCR analysis of Irf7 and Ifit1 mRNA in BMDMs from the indicated mice (n = 3). Mice were age matched to 8 months. Statistical analysis was done using unpaired Student’s t-tests. The exact P values are shown. b, Levels of phosphorylated NF-κB, JNK, P38, IRF5 and IRF7, as measured by immunoblotting, in lysates of BMDMs from the indicated mice (n = 3). Mice were age matched to 8 months. c, RNA-seq performed for UNC93B1V117L BMDMs compared with controls (UNC93B1WT) (n = 3 biological replicates). Mice were age matched to 8 months. Gene set enrichment analysis significantly associated with SLE. d, RT–qPCR analysis of Ifit1, Irf7, Isg-15 and Tnf mRNA expression in the BMDMs from the indicated mice (n = 3) after stimulation by 40 μg ml−1 of HMW poly(I:C), 2 μg ml−1 of R848 and 10 μg ml−1 of CPG-C for 24 h. Mice were age matched to 14 months. Statistical analysis was done using unpaired Student’s t-tests. The exact P values are shown. e, Production of CXCL1, CCL5 and IP-10 in the supernatant of mice BMDMs isolated from the indicated mice (n = 3), measured by CBA after stimulation by 40 μg ml−1 of HMW poly(I:C), 2 μg ml−1 of R848 and 10 μg ml−1 of CPG-C for 24 h. Mice were age matched to 14 months. Statistical analysis was done using unpaired, two-tailed Student’s t-tests and data are presented as the mean with s.d. The exact P values are shown. Source data
Extended Data Fig. 1
Extended Data Fig. 1. Clinical characteristics associated with UNC93B1 T314A and V117L variants.
(ag) Complement 3 (NR, 0.80-1.50 g/L)/4 (NR, 0.13-0.43 g/L) levels for patients with UNC93B1 T314A, P1 and V117L, P2-P7. (a-d) SLE score (SLEDAI-2K), P1-P4. (f) SLEDAI score, P6. (a-c, e-g) Circulating white blood cells (WBC) (NR, 5-12 × 109/L), neutrophils% (NR, 40-60%), monocytes% (NR, 1-8%), lymphocytes% (NR, 31-40%), and platelets count (NR, 140-440 × 109/L) for patients with UNC93B1 T314A, P1 and V117L, (P2, P3, and P5-P7). (e-g) Anti-dsDNA autoantibodies (NR, <18IU/L) and ANA autoantibodies (NR, <18IU/L) for P5-P7 (all V117L). (e, f) 24hrs. urine protein (NR, 0-0.1 g/24 h) for P5 and P6 (all V117L). Data is for monthly visits post diagnosis. NR is highlighted in gray. Source data
Extended Data Fig. 2
Extended Data Fig. 2. Clinical characteristics associated with UNC93B1 V117L variant.
(af) ANA autoantibodies by HEp-2 cells, (a) for healthy control, (b, c) for P2 (b) and P3 (c) showing mixed patterns in which the speckled pattern is predominant, (d, e) for P4 (d) and P5 (e) showing speckled pattern, and (f) for P6 showing cytoplasmic pattern. The scale bars were supplied in source data of this figure where these images were magnified from. Source data
Extended Data Fig. 3
Extended Data Fig. 3. Patients with UNC93B1 V117L variant display elevated interferons and inflammatory cytokines.
(a) Quantitative RT-PCR analysis of ISG-15 mRNA expression in the PBMCs of P2 compared to healthy controls. p value was determined by one-way ANOVA, data are presented as mean with SD, n = 3 biological samples. (b) Quantitative RT-PCR analysis of IFIT1, IFIT3, and ISG-15 mRNA expression in the PBMCs of P3 compared to healthy controls, n = 3 biological samples. (c) Production of IFNγ, IFNλ2/3, IL-12P70, and IL-10 in the supernatant of PBMCs isolated from P2 and healthy controls measured by CBA, n = 3 biological samples. (d) Production of IFNα, IFNβ, and IL-6 in the supernatant of PBMCs isolated from P2 and healthy controls measured by ELISA, n = 3 biological samples. (e) Production of IFNγ, IFNλ2/3, IL-10, and IL-12P70 in the supernatant of PBMCs isolated from P3 and healthy controls measured by CBA, n = 3 biological samples. Indicated p values in b–e were determined by two-way ANOVA, multiple comparisons, adjusted p value, data are presented as mean with SD. PBMCs in a-e isolated from patients’ whole blood and incubated in RPMI 1640 medium supplemented with 10% FBS, 2 mM L-glutamine, and 1% (v/v) Penicillin-Streptomycin for 12hrs before analysis without stimulation. (f) Levels of IFN- α2, IFNγ, IFNλ2/3, IL-6, IL-12P70, IL-1β, GM-CSF, and IL-10 in the plasma from P2 compared to healthy control measured by CBA, p values were determined by unpaired t-test, two-tailed, data are presented as mean with SD, n = 3 biological samples. Source data
Extended Data Fig. 4
Extended Data Fig. 4. Pathway analysis of inflammation in UNC93B1V117L and UNC93B1T314A THP-1 cells.
(a) Quantitative RT-PCR analysis of ISG20L2, IL-8, IL-12a and TNF expression in the indicated THP-1 cell lines, n = 3 biological replicates. Three independent experiments. (b) Production of IP-10 and IL-8 in the indicated THP-1 cell lines measured by CBA. n = 3 biological replicates. Indicated p values in a,b were determined by unpaired t-test, two-tailed, data are presented as mean with SD. (cf) Gene Set Enrichment Analysis (GSEA) with WT as control groups and UNC93B1V117L or UNC93B1T314A as treatment groups which shows a significant association for genes relating to (c) antigen processing and cross presentation, (d,e) cross presentation of soluble exogenous antigens and (f) ER/Phagosome function. mRNA was extracted from THP-1 of UNC93B1WT, UNC93B1V117L, and UNC93B1T314A, n = 3 biological replicates. Source data
Extended Data Fig. 5
Extended Data Fig. 5. V117L and T314A UNC93B1 variants associated inflammation features.
(a, b) DEGs and pathway analysis of inflammation in UNC93B1V117L and UNC93B1T314A THP-1 cells. (a) RNA sequencing was performed for UNC93B1V117L THP-1 cells compared to control (UNC93B1WT), reactome Enrichment analysis of significantly upregulated genes highlights innate immune system and antigen processing/presentation. (b) RNA sequencing was performed for UNC93B1T314A THP-1 cells compared to control (UNC93B1WT), reactome Enrichment analysis of significantly upregulated genes highlights innate immune system and ER/Phagosome pathways. mRNA was extracted from THP-1 of UNC93B1WT, UNC93B1V117L, and UNC93B1T314A, n = 3 biological replicates. (c) Quantitative RT-PCR analysis of IL-12a and ISG20L2 expression in the indicated immortalized B cell lines (baseline), n = 3 biological replicates, indicated p values were determined by unpaired t-test, two-tailed, data are presented as mean with SD. (d, e) Production of IL-10 (d), TNF and GM-CSF (e) in the indicated immortalized B cell lines (baseline). n = 3 biological replicates, measured by CBA. Indicated p values were determined by two-way ANOVA, multiple comparisons, adjusted p value, data are presented as mean with SD. Source data
Extended Data Fig. 6
Extended Data Fig. 6. UNC93B1 genetic variation drives inflammation via TLR7/8.
(a) Production of IL-6 in the supernatant of PBMCs of P2 compared to healthy controls after stimulation by 10 μg/mL HMW Poly I:C, 1 μg/mL R848, and 4 μg/mL CPG-C for 8hrs, n = 3 biological samples. (b) Production of IP-10, IL-6, and IL-1β in the supernatant of PBMCs of P3 compared to healthy controls after stimulation by 10 μg/mL HMW Poly I:C, 1 μg/mL R848, and 4 μg/mL CPG-C for 12hrs, n = 3 biological samples. Indicated p values in a, b were determined by two-way ANOVA, multiple comparisons, adjusted p value, data are presented as mean with SD. (c) Production of IL-1β, IL-10, IL12P70, and TNF in the supernatant of PBMCs of P2 compared to healthy controls after stimulation by 1 mM guanosine and 200 ng/mL TL8-506 for 24hrs, indicated p values were determined by two-way ANOVA, multiple comparisons, adjusted p value, data are presented as mean with SD, p value of TNF (guanosine set) determined by unpaired t-test, two-tailed, data are presented as mean with SD, n = 3 biological samples. (d) Production of IL-1β, IL-23, and IL-10 in the supernatant of THP-1 of indicated variants after stimulation by 0.7 mM guanosine, 1 μg/mL R848, 200 ng/mL TL8-506, 100 μg/mL HMW Poly I:C, and 5 μg/mL CPG-C for 24hrs, indicated p values were determined by unpaired t-test, two-tailed, data are presented as mean with SD, n = 3 biological replicates. (e) Production of IL-10 and IFN-γ in the supernatant of indicated immortalized B cell lines after stimulation by 0.5 mM guanosine, 0.1 mM loxoribine, 2.5 μg/mL R837, 1 μg/mL R848, and 200 ng/mLTL8-506 for 24 hrs, indicated p values were determined by two-way ANOVA, multiple comparisons, adjusted p value, data are presented as mean with SD, n = 3 biological replicates. Production of cytokines in the cells supernatant was measured by CBA. Source data
Extended Data Fig. 7
Extended Data Fig. 7. IRAK1/4 adaptors involved in UNC93B1 genetic variation-induced inflammation.
(a) Levels of phosphorylated IRAK4 as measured by immunoblot using lysates of the indicated THP-1 cells. Data are representative of three independent experiments. (b) Quantitative RT-PCR analysis of IL-6, IL-8, IFIT3, ISG-15, and ISG-54 expression in the indicated THP-1 cell lines, stimulated by 2 μg/mL R848 for 24hrs after being incubated with 0, 1, 10, 50 nM IRAK4 inhibitor for 30 minutes, n = 3 biological replicates. ***p = 0.0003, ****p < 0.0001. (c) Production of IL-1β, IL-23 and IFN-α2 in the supernatant of the indicated THP-1 cell lines, stimulated by 1 μg/mL R848 for 24hrs after being incubated with 0, 10, 20, 50 nM IRAK4 inhibitor for 30 minutes, n = 3 biological replicates. In IL-1β, **p = 0.0012, **p = 0.0022, ***p = 0.0005, ***p = 0.0005, ***p = 0.0002 respectively. In IFN-α2, *p = 0.0380, ***p = 0.0008, *p = 0.0291, ***p = 0.0007, **p = 0.0092, ***p = 0.0003 respectively. (d) Quantitative RT-PCR analysis of IL-6 and IL-8 expression in the indicated THP-1 cell lines, stimulated by 2 μg/mL R848 for 24hrs after being incubated with 0, 0.1, 1, 5 µM IRAK1/4 inhibitor for 30 minutes, n = 3 biological replicates. In IL-6, *p = 0.0114, **p = 0.0033, **p = 0.0022, ***p = 0.0003, ****p < 0.0001 respectively. In IL-8, *p = 0.0327, ****p < 0.0001. (e) Production of IL-23 and MCP-1 in the supernatant of the indicated THP-1 cell lines, stimulated by 2 μg/mL R848 for 24hrs after being incubated with 0, 0.1, 1, 5 µM IRAK1/4 inhibitor for 30 minutes, n = 3 biological replicates. In IL-23, **p = 0.0023, ***p = 0.0001, ***p = 0.0005, ***p = 0.0002 respectively. MCP-1, **p = 0.0037, *p = 0.0131, **p = 0.0089, **p = 0.0011, *p = 0.0296 respectively. (f) Production of IL-12P70, IFN-γ and IL-10 in the supernatant of the indicated immortalized B cell lines, stimulated by 0.1 mM loxoribine for 24hrs after being incubated with 0, 10, 20, 50 nM IRAK4 inhibitor for 30 minutes, n = 3 biological replicates. Indicated p values in b-f were determined by two-way ANOVA, multiple comparisons, adjusted p value, data are presented as mean with SD. (g) Production of MCP-1 in the supernatant of the indicated PBMCs, stimulated by 2 μg/mL R848 for 24hrs after being incubated with and without 25 nM IRAK4 inhibitor for 30 minutes, indicated p values were determined by unpaired t-test, two-tailed, data are presented as mean with SD, n = 3 biological samples. Production of cytokines in the cells supernatant was measured by CBA. Source data
Extended Data Fig. 8
Extended Data Fig. 8. Schematic for the CRISPR/Cas9 strategy to generate UNC93B1 V117L knock-in mice.
(a) The recombinant strategy, the underlined letters are the GuideRNA target site, and the blue font is the mutant site, the red bold font is the mutant base, and the green bold font is the synonymous mutation made to prevent the gRNA from being cut twice. Target sites for, UNC93B1WT/WT (b), UNC93B1WT/V117L (c), and UNC93B1V117L/V117L (d) mice genotypes. HE, heterozygous; HO, homozygotes.
Extended Data Fig. 9
Extended Data Fig. 9. DEGs and upregulated pathways of inflammation in UNC93B1V117L homozygous mice compared to wild type.
(a) Intracellular cytokine staining of TNF in bone marrow-derived macrophage (BMDM) of indicated mice (n = 3). Red histograms are unstained controls. Statistical analysis was done using unpaired t-tests, two-tailed, data are presented as mean with SD. The exact p values are shown. (b–f) RNA sequencing was performed for UNC93B1V117L BMDM compared to control, n = 3 biological replicates. (b) Differentially expressed genes presented as a volcano plot. (c) msigdb_m2_reactome enrichment analysis of significantly upregulated genes highlights innate immune system and toll-like receptor pathways. (d-f) GSEA significantly associated with TLR signaling (d), TNF signaling (e) and antigen processing/presentation (f). Mice were 8 months old. Ho, homozygotes. Source data
Extended Data Fig. 10
Extended Data Fig. 10. Gating strategies.
Representative gating strategies for myeloid cells in bone marrow, macrophage, monocytes, inflammatory Gr-1+ cells, and IFN-γ producing CD4 T cells and CD3+/CD4 cells, lymphocytes subsets, B cells, CD4 T cells, T regulatory cells, activated T cells, or/and germinal center B cells in bone marrow or/and spleen. These strategies used for data presented in Fig. 6.

Similar articles

Cited by

References

    1. Valenzuela-Almada, M. O. et al. Epidemiology of childhood-onset systemic lupus erythematosus: a population-based study. Arthritis Care Res.74, 728–732 (2022).10.1002/acr.24827 - DOI - PMC - PubMed
    1. Demirkaya, E., Sahin, S., Romano, M., Zhou, Q. & Aksentijevich, I. New horizons in the genetic etiology of systemic lupus erythematosus and lupus-like disease: monogenic lupus and beyond. J. Clin. Med.9, 712 (2020). 10.3390/jcm9030712 - DOI - PMC - PubMed
    1. Shen, N. et al. Sex-specific association of X-linked Toll-like receptor 7 (TLR7) with male systemic lupus erythematosus. Proc. Natl Acad. Sci. USA107, 15838–15843 (2010). 10.1073/pnas.1001337107 - DOI - PMC - PubMed
    1. Brown, G. J. et al. TLR7 gain-of-function genetic variation causes human lupus. Nature605, 349–356 (2022). 10.1038/s41586-022-04642-z - DOI - PMC - PubMed
    1. Kim, Y. M., Brinkmann, M. M., Paquet, M. E. & Ploegh, H. L. UNC93B1 delivers nucleotide-sensing toll-like receptors to endolysosomes. Nature452, 234–238 (2008). 10.1038/nature06726 - DOI - PubMed

MeSH terms