. 2024 Jul;16(7):1495-1514.
doi: 10.1038/s44321-024-00084-4. Epub 2024 Jun 3.

A multispectral 3D live organoid imaging platform to screen probes for fluorescence guided surgery

Affiliations

A multispectral 3D live organoid imaging platform to screen probes for fluorescence guided surgery

Bernadette Jeremiasse et al. EMBO Mol Med. 2024 Jul.

Abstract

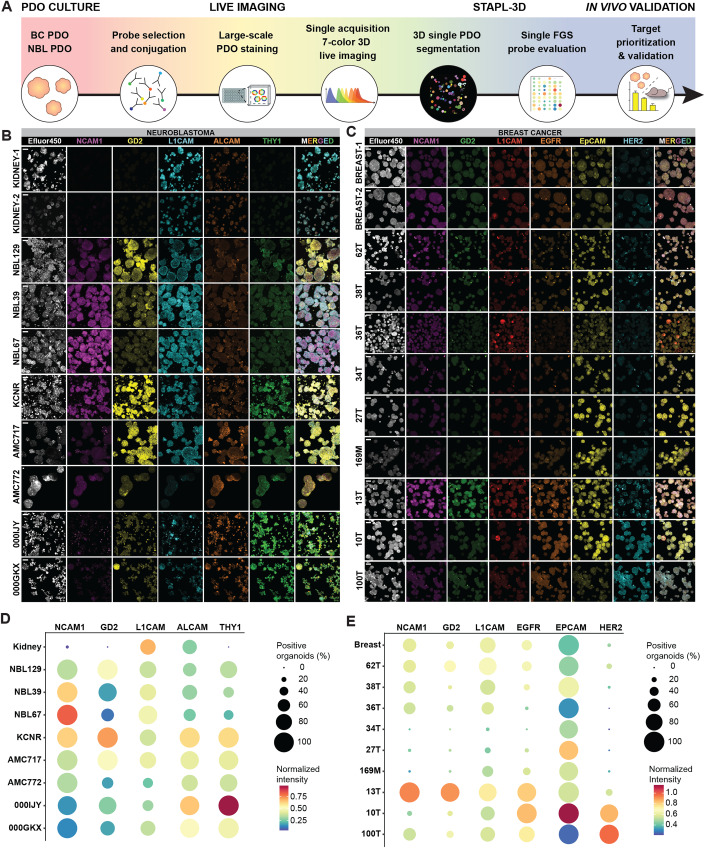
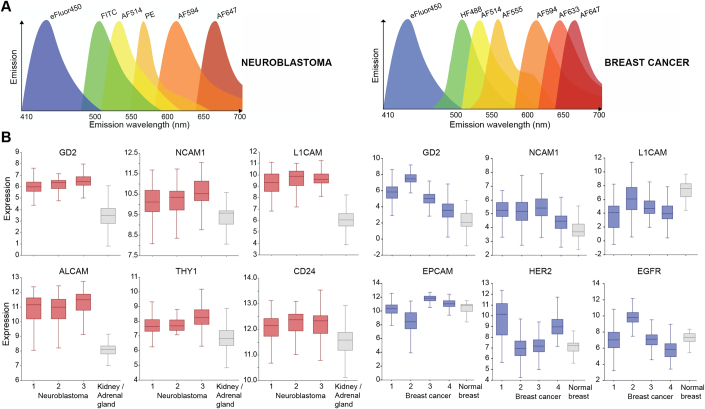
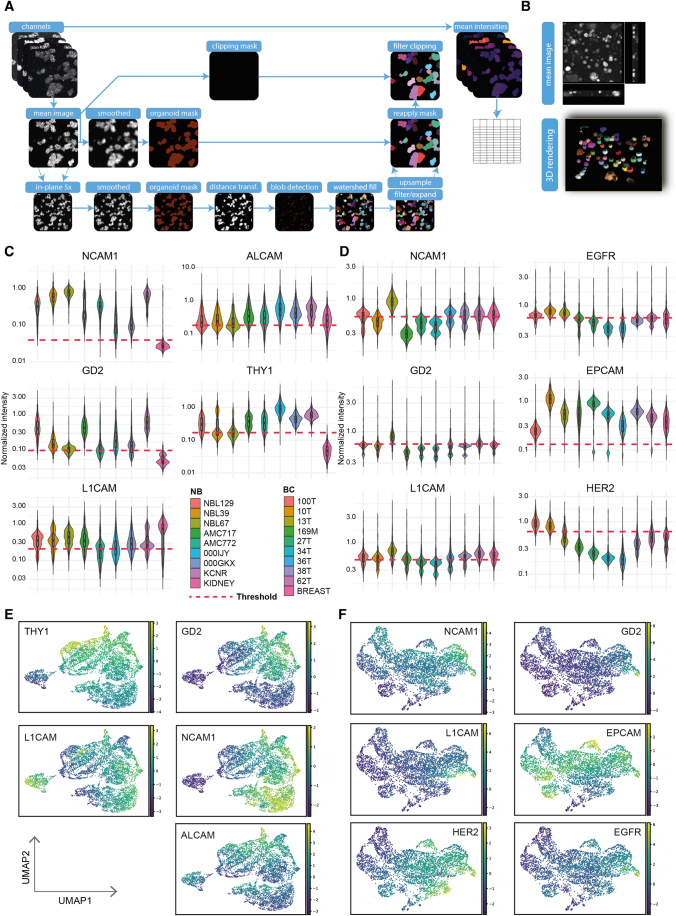
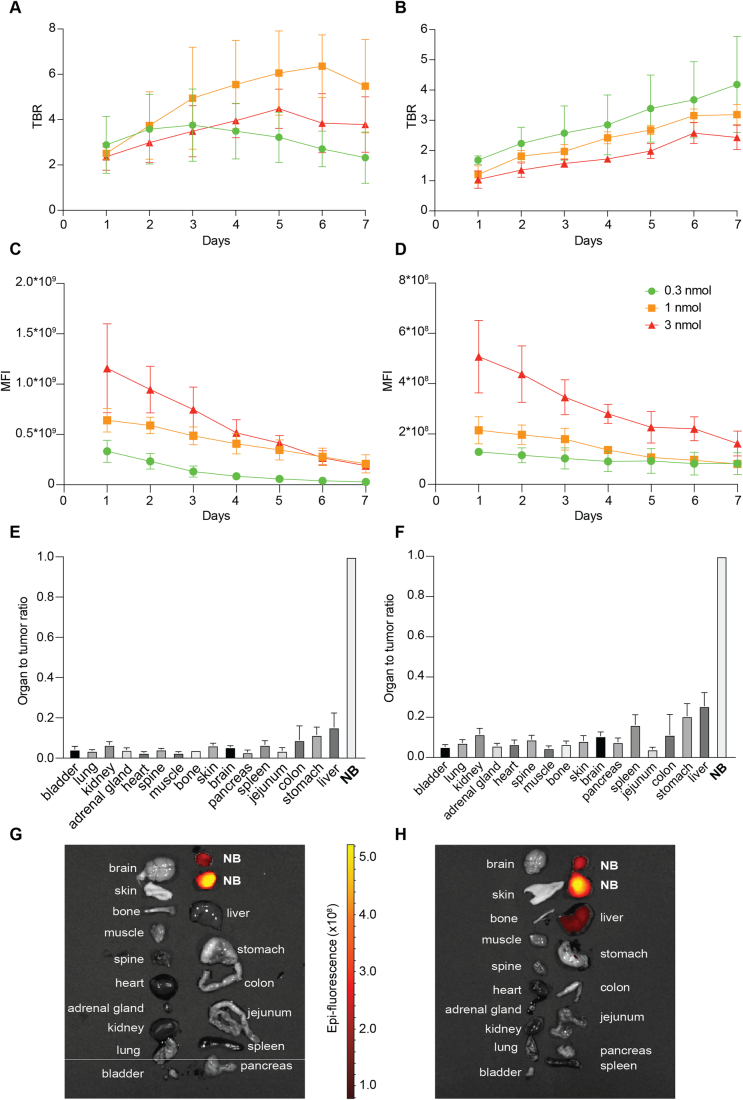
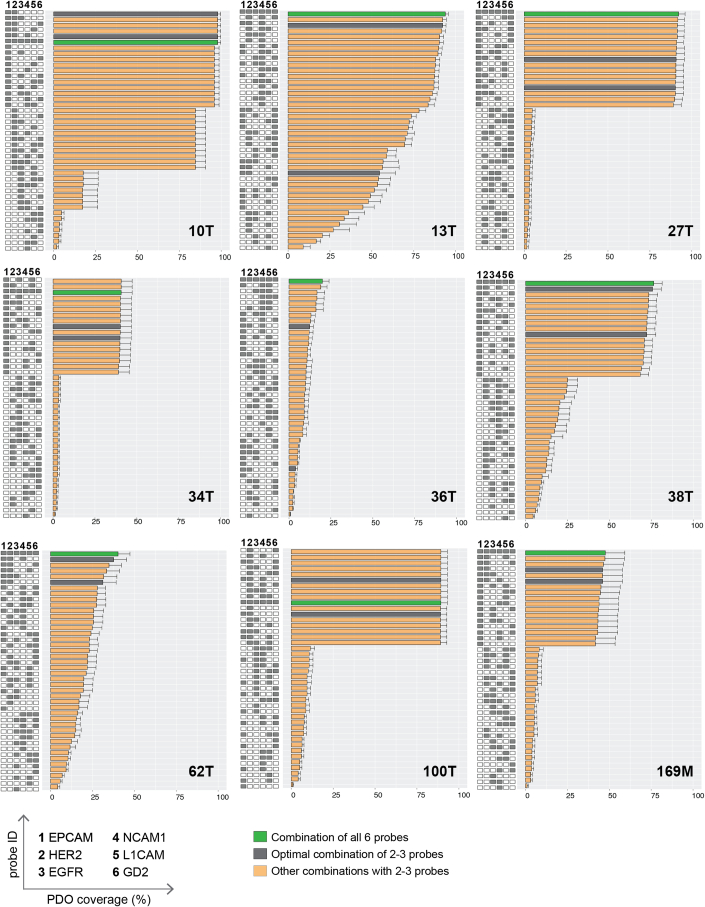
Achieving complete tumor resection is challenging and can be improved by real-time fluorescence-guided surgery with molecular-targeted probes. However, pre-clinical identification and validation of probes presents a lengthy process that is traditionally performed in animal models and further hampered by inter- and intra-tumoral heterogeneity in target expression. To screen multiple probes at patient scale, we developed a multispectral real-time 3D imaging platform that implements organoid technology to effectively model patient tumor heterogeneity and, importantly, healthy human tissue binding.

Keywords: Breast Cancer; Fluorescence-guided Surgery; Multi-spectral 3D Imaging; Neuroblastoma; Patient-derived Organoids.


Figures

Figure 1
Figure 1. Organoid-based multispectral 3D imaging platform to screen FGS probes.
(A) Schematic representation of the screening platform, including 7-color 3D imaging and STAPL-3D single organoid segmentation and quantification for target prioritization. (B, C) Representative single channel and merged 3D multispectral images of the segmented data, showing heterogeneous expression of selected FGS probes between PDO lines. Scale bars 50 μm. (D, E) Quantification of percentage positively stained organoids (dot size) and normalized fluorescent intensity (blue-to-red color gradient) for the two PDO biobanks and healthy tissue control organoids. (BE) n = 3 (NB) and n = 4 (BC) independent experiments. Source data are available online for this figure.
Figure 2
Figure 2. Inter-patient and intra-tumoral heterogeneity in probe binding.
(A, B) UMAP clustering based on spatial target distribution for both the NB (A) and BC (B) PDO biobank, n = 3 independent experiments. (C, D), Stacked bar graphs representing the proportion of each cluster per PDO line of the NB (C) and BC (D) PDO biobank, n = 3 independent experiments. (E), Representative 3D multispectral images showing heterogeneous binding of selected FGS probes on individual organoids within the same PDO line. Scale bars 20 μm for representative image of 000IJY, 30 μm for NBL39 and 15 μm for representative images of 13T and 62T.
Figure 3
Figure 3. In vivo validation and probe combination screening.
(A) Representative in vivo anti-L1CAM-IRDye800CW3D detection images of xenografted mice bearing subcutaneous PDO NBL67 derived tumors. (B) Representative images of in vitro GD2 expression on the NBL129, NBL39, and NBL67 PDO lines, re-used from Fig. 1A. Scale bars 100 μm. (C) In vitro (white bars) and in vivo (gray bars) TBRs of GD2. Individual data points shown, and bars depict mean TBR + SD. Blue area indicates common TBR cut-off value of 1.5. Comparison between different NBL lines vitro: NBL129 versus NBL39 adjusted P-value: 2.90E−05; NBL129 versus NBL67 adjusted P-value: 3.00E−06; NBL39 versus NBL67 adjusted P-value: 0.52, two-way ANOVA with Sidáks multiple comparisons test. Comparison between different NBL lines vivo: NBL129 versus NBL39 adjusted P-value: 0.11; NBL129 versus NBL67 adjusted P-value: 5.51E−04; NBL39 versus NBL67 adjusted P-value: 0.05, two-way ANOVA with Sidáks multiple comparisons test. Comparison between in vitro and in vivo TBR: NBL129 adjusted P-value: 0.08; NBL39 adjusted P-value: 0.36; NBL67 adjusted P-value: 1.00, two-way ANOVA with Sidáks multiple comparisons test. n = 3 independent in vitro experiments, and n = 4 mice in vivo per PDO line. (D) In vitro (white bars) and in vivo (gray bars) TBRs of L1CAM. Individual data points shown, and bars depict mean TBR + SD. Blue area indicates common TBR cut-off value of 1.5. Comparison between in vitro and in vivo TBR: NBL129 adjusted P-value: 5.50E−05; NBL39 adjusted P-value: 7.48E−05; NBL67 adjusted P-value: 3.15E−05, two-way ANOVA with Sidáks multiple comparisons test. n = 3 independent in vitro experiments and n = 4-7 mice in vivo per PDO line. (E, F) In vitro TBR (blue-to-red color gradient) for all tested probes and PDO lines for NB (E) and BC (F). n = 3 (NB) and n = 4 (BC) independent in vitro experiments. (G) Percentage of BC organoids (blue-to-red color gradient) positive for individual probes and probe combinations. Results ordered through unsupervised clustering. n = 4 independent in vitro experiments. Source data are available online for this figure.
Figure EV1
Figure EV1. Representative single-channel optical sections.
(A, B) Images of optical sections representing the highest (left) and lowest (middle) expression of the screened probes and expression on a healthy tissue control organoid line (right) for NB (A) and BC (B). Scale bars 50 μm (A) and 30 μm (B).
Figure EV2
Figure EV2. Emisson spectra and target selection.
(A) Schematic representation of the fluorophore emission spectra for 7-color imaging of NB (left) and BC (right). (B) Box plot depicting relative target gene expression from R2 RNA sequencing datasets for NB (left) and BC (right) and respective adjacent healthy control tissue. Centre: median, bounds: Q1–Q3, whiskers extend to minimum/maximum limited to 1.5 times the IQR. Details of sequencing datasets, including sample size, is provided in Methods.
Figure EV3
Figure EV3. STAPL-3D pipeline optimized for individual organoid segmentation and fluorescent intensity extraction.
(A) Schematic representation of the STAPL-3D pipeline with key optimization steps for single organoid segmentation. (B) Representative raw 3D imaging data and associated 3D rendered single organoid segmentation. (C, D) Violin plots of the mean fluorescent intensities (MFI) of the screened probes for all individual organoids from the NB (C) and BC (D) PDO biobanks normalized for the experimental day and probe. Dashed line indicates the cut-off used for considering an organoid as positively stained. Boxplots inside violin plots; centre: median, bounds: Q1–Q3, whiskers extend to minimum/maximum limited to 1.5 times the IQR. n = 3 independent experiments. (E, F) Representation of the spatial target distribution used for UMAP clustering of both the NB (E) and BC (F) PDO biobank. n = 3 independent experiments.
Figure EV4
Figure EV4. In vivo testing of anti-GD2-IRDye800CW and anti-L1CAM-IRDye800CW in NB xenografts.
(AD) Line graph depicting the TBR (A, B) and MFI (C, D) of anti-GD2-IRDye800CW (A, C) and anti-L1CAM-IRDye800CW (B, D) per dose on 7 consecutive days. Mean TBR or MFI ± SD as imaged with the IVIS Spectrum system, n = 3 to 4 mice per dose group. (E, F) Bargraphs of the biodistribution of anti-GD2-IRDye800CW at day 5 (E) and anti-L1CAM-IRDye800CW at day 6 (F) in subcutaneous NB tumor-bearing mice receiving a 1 nmol dose. Mean MFI of organs and tissues normalized to the tumor + SD of n = 3 mice per probe. (G, H) Representative images of the biodistribution of anti-GD2-IRDye800CW at day 5 (G) and anti-L1CAM-IRDye800CW at day 6 (H) in subcutaneous NB tumor-bearing mice receiving a 1 nmol dose.
Figure EV5
Figure EV5. Percentage organoid coverage with single probes and probe combinations per BC PDO line.
Percentage BC organoids that are positive for individual probes or probe combinations. Gray bars depict the 2 overall most effective probe combinations with a limited number of probes. In case of similar percentages, combinations are ranked higher if they consist of less probes. Green bars represent the maximum achievable percentage of coverage obtained with the combination of all six probes tested. Bars depict mean percentage + SEM of n = 3 independent experiments.

References

    1. Abdullah KG, Bird CE, Buehler JD, Gattie LC, Savani MR, Sternisha AC, Xiao Y, Levitt MM, Hicks WH, Li W, et al. Establishment of patient-derived organoid models of lower-grade glioma. Neuro-Oncol. 2021;24:612–623. doi: 10.1093/neuonc/noab273. - DOI - PMC - PubMed
    1. Archer KJ, Bardhi E, Maluf DG, McDaniels J, Rousselle T, King A, Eason JD, Gallon L, Akalin E, Mueller TF, et al. Pretransplant kidney transcriptome captures intrinsic donor organ quality and predicts 24‐month outcomes. Am J Transpl. 2022;22:2515–2528. doi: 10.1111/ajt.17127. - DOI - PMC - PubMed
    1. Bandino A, Geerts D, Koster J, Bachmann AS. Deoxyhypusine synthase (DHPS) inhibitor GC7 induces p21/Rb-mediated inhibition of tumor cell growth and DHPS expression correlates with poor prognosis in neuroblastoma patients. Cell Oncol. 2014;37:387–398. doi: 10.1007/s13402-014-0201-9. - DOI - PubMed
    1. Bellacosa A, Godwin AK, Peri S, Devarajan K, Caretti E, Vanderveer L, Bove B, Slater C, Zhou Y, Daly M, et al. Altered gene expression in morphologically normal epithelial cells from heterozygous carriers of BRCA1 or BRCA2 mutations. Cancer Prev Res. 2010;3:48–61. doi: 10.1158/1940-6207.CAPR-09-0078. - DOI - PMC - PubMed
    1. Bergmann S, Lawler SE, Qu Y, Fadzen CM, Wolfe JM, Regan MS, Pentelute BL, Agar NYR, Cho C-F. Blood–brain-barrier organoids for investigating the permeability of CNS therapeutics. Nat Protoc. 2018;13:2827–2843. doi: 10.1038/s41596-018-0066-x. - DOI - PMC - PubMed

Substances

LinkOut - more resources