. 2024 Jun 3;16(1):121.
doi: 10.1186/s13195-024-01489-6.

Intermittent hypoxia training enhances Aβ endocytosis by plaque associated microglia via VPS35-dependent TREM2 recycling in murine Alzheimer's disease

Affiliations

Intermittent hypoxia training enhances Aβ endocytosis by plaque associated microglia via VPS35-dependent TREM2 recycling in murine Alzheimer's disease

Xueting Wang et al. Alzheimers Res Ther. .

Abstract

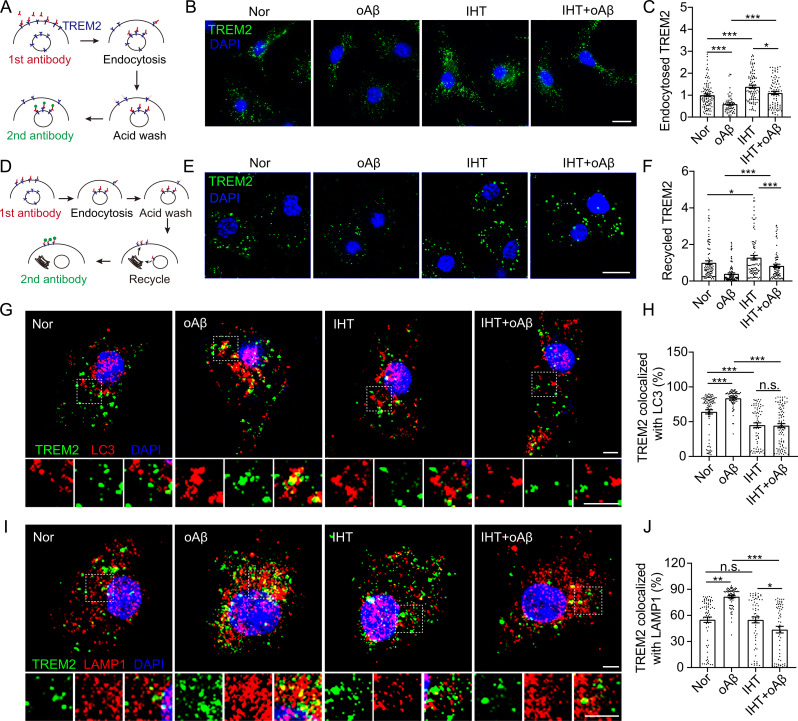
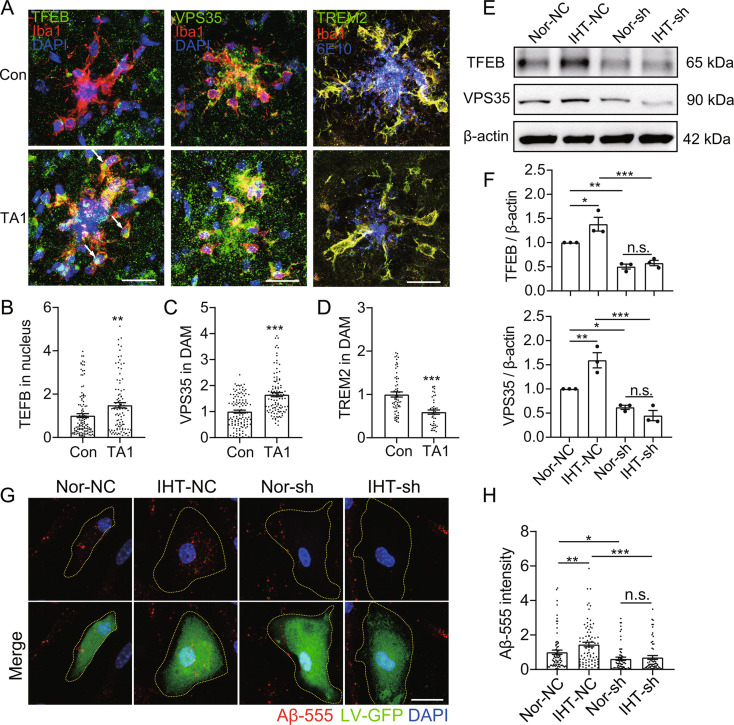
Background: Beta-amyloid (Aβ) deposition in the brain parenchyma is a crucial initiating step in the amyloid cascade hypothesis of Alzheimer's disease (AD) pathology. Furthermore, dysfunction of plaque-associated microglia, also known as disease-associated microglia (DAM) has been reported to accelerate Aβ deposition and cognitive impairment. Our previous research demonstrated that intermittent hypoxia training (IHT) improved AD pathology by upregulating autophagy in DAM, thereby enhancing oligomeric Aβ (oAβ) clearance. Considering that oAβ internalization is the initial stage of oAβ clearance, this study focused on the IHT mechanism involved in upregulating Aβ uptake by DAM.

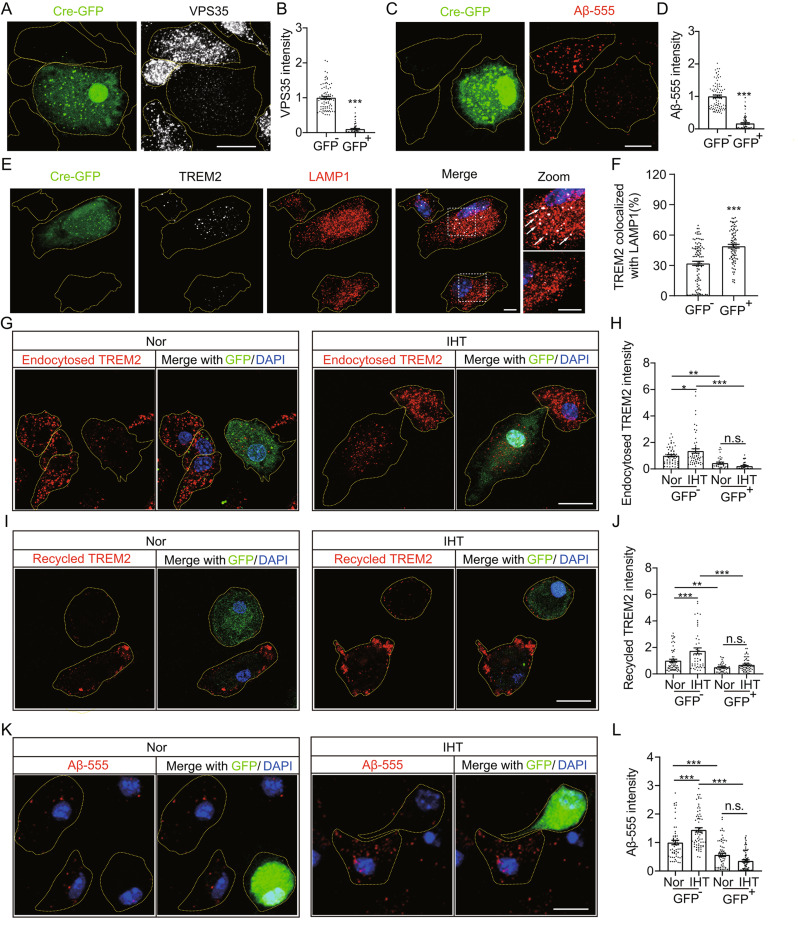
Methods: IHT was administered to 8-month-old APP/PS1 mice or 6-month-old microglial vacuolar protein sorting 35 (VPS35) knockout mice in APP/PS1 background (MG VPS35 KO: APP/PS1) for 28 days. After the IHT, the spatial learning-memory capacity of the mice was assessed. Additionally, AD pathology was determined by estimating the nerve fiber and synapse density, Aβ plaque deposition, and Aβ load in the brain. A model of Aβ-exposed microglia was constructed and treated with IHT to explore the related mechanism. Finally, triggering receptor expressed on myeloid cells 2 (TREM2) intracellular recycling and Aβ internalization were measured using a fluorescence tracing technique.

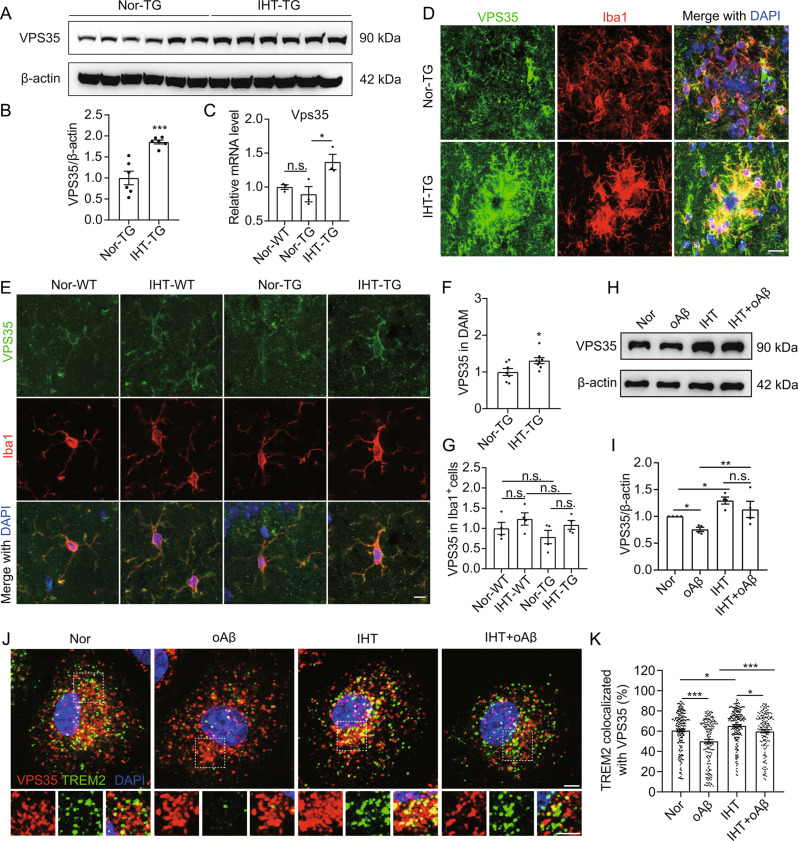
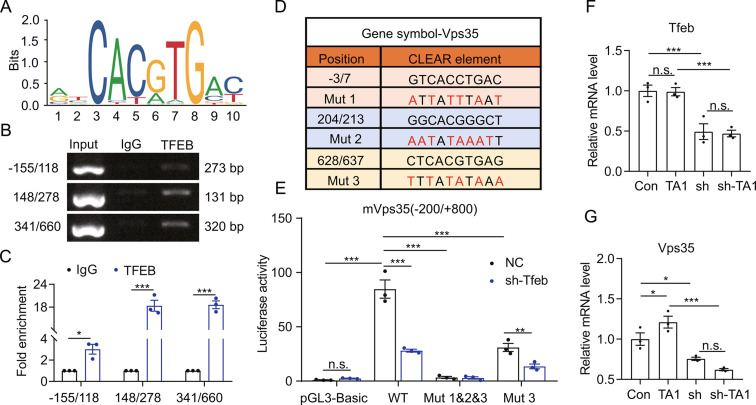
Results: Our results showed that IHT ameliorated cognitive function and Aβ pathology. In particular, IHT enhanced Aβ endocytosis by augmenting the intracellular transport function of microglial TREM2, thereby contributing to Aβ clearance. Furthermore, IHT specifically upregulated VPS35 in DAM, the primary cause for the enhanced intracellular recycling of TREM2. IHT lost ameliorative effect on Aβ pathology in MG VPS35 KO: APP/PS1 mice brain. Lastly, the IHT mechanism of VPS35 upregulation in DAM was mediated by the transcriptional regulation of VPS35 by transcription factor EB (TFEB).

Conclusion: IHT enhances Aβ endocytosis in DAM by upregulating VPS35-dependent TREM2 recycling, thereby facilitating oAβ clearance and mitigation of Aβ pathology. Moreover, the transcriptional regulation of VPS35 by TFEB demonstrates a close link between endocytosis and autophagy in microglia. Our study further elucidates the IHT mechanism in improving AD pathology and provides evidence supporting the potential application of IHT as a complementary therapy for AD.

Keywords: Alzheimer’s disease; Beta-amyloid endocytosis; Plaque-associated microglia; TFEB; TREM2 recycling; VPS35.


Conflict of interest statement

The authors declare no competing interests.

Figures

Fig. 1
Fig. 1
IHT downregulates TREM2 in DAM and reduces Aβ load in brains of 9-month-old APP/PS1 mice. (A) Escape latency of the mice to reach the target platform during the MWM training period. (B) The ratio of dwelling time in the target quadrant compared to all quadrants during the MWM probe test. (C) The escape latency of mice to reach the target quadrant during the MWM probe period. (D) The average swimming speed of mice during the MWM probe test (n = 7). (E) Brain sections were probed with 6E10 antibodies, and microscopy images of the Aβ plaques were obtained. White arrows indicate plaques. Scale bar = 1 mm. (F) Brain sections were incubated with anti-TREM2 and anti-Iba1 antibodies, and microscopy images of DAM in the CA1 region were acquired. Scale bar = 10 μm. (G) Number of Aβ plaques in the hippocampus in panel E (n = 6). (H) Number of Aβ plaques in the cortex in panel E (n = 6). (I) Trem2 expression in the CA1 region was measured using qRT-PCR (n = 3). (J) TREM2 intensity in the DAM in panel F (six mice in each group, with 15 cells per mouse). *p < 0.05, **p < 0.01, and ***p < 0.001 by Student’s t-test. Nor, normoxia; IHT, intermittent hypoxia training; WT, wild type; TG, APP/PS1
Fig. 2
Fig. 2
IHT enhances TREM2 recycling and Aβ endocytosis in Aβ-exposed microglia. (A) Flowchart of TREM2 internalization test. (B) After treatment with IHT, the TREM2 internalization assay was conducted in Aβ-exposed microglia, followed by the fixation of the cells and counterstaining with DAPI. Scale bar = 10 μm. (C) TREM2 intensity in Aβ-exposed microglia in panel B (n > 80). (D) Flowchart of TREM2 recycling test. (E) After treatment with IHT, the TREM2 recycling assay was performed in Aβ-exposed microglia. The cells were then fixed and counterstained with DAPI. Scale bar = 10 μm. (F) TREM2 intensity in Aβ-exposed microglia in panel E (n > 80). (G) After treatment with IHT, membrane TREM2 was labeled with anti-TREM2 antibodies in Aβ-exposed microglia and allowed to undergo internalization for 60 min. Subsequently, the cells were fixed and probed with anti-LC3 antibodies. Scale bar = 5 μm. (H) Colocalization ratio of TREM2 with LC3 in single cells in panel H via Manders’ colocalization coefficients (n > 80). (I) After treatment with IHT, membrane TREM2 was labeled with anti-TREM2 antibodies in Aβ-exposed microglia and allowed to undergo internalization for 60 min. Subsequently, the cells were fixed and probed with anti-LAMP1 antibodies. Scale bar = 5 μm. (J) Colocalization ratio of TREM2 with LAMP1 in single cells in panel I via Manders’ colocalization coefficients (n > 80. *p < 0.05, **p < 0.01, and ***p < 0.001 by two-way ANOVA. Nor, Normoxia; IHT, intermittent hypoxia training
Fig. 3
Fig. 3
IHT upregulates VPS35 in DAM and Aβ-exposed microglia. (A) VPS35 expression in IHT-treated mice brain cortex was detected using Western blotting. (B) Grayscale values of the protein bands in panel A (n = 6). (C) Vps35 expression in the CA1 regions was estimated via qRT-PCR (n = 3). (D and E) Brain sections were labeled with anti-VPS35 and anti-Iba1 antibodies, and microscopy images of DAM (D) and microglia not associated with plaques in CA1 region were captured (E). Scale bar = 10 μm. (F) The average fluorescence intensity of VPS35 in the Iba1+ cells of DAM in panel D (n = 7, each data point represents the average intensity in DAM of 6 plaques in each mouse brain). (G) VPS35 intensity in the Iba1+ cells in panel E (n = 4). (H) After treatment with IHT, VPS35 expression in Aβ-exposed microglia was detected using Western blotting. (I) Grayscale values of the protein bands in panel H (n = 4). (J) After treatment with IHT, membrane TREM2 was labeled with anti-TREM2 antibodies in Aβ-exposed microglia and allowed to undergo internalization for 30 min. Subsequently, the cells were fixed and probed with anti-VPS35 antibodies. Scale bar = 3 μm. (K) Colocalization ratio of TREM2 with VPS35 in single cells via Manders’ colocalization coefficients (n > 100). *p < 0.05, **p < 0.01, and ***p < 0.001 by Student’s t-test (B, C and F) or two-way ANOVA (G, I, and K). n.s. indicates no significant difference. Nor, normoxia; IHT, intermittent hypoxia training; WT, wild type; TG, APP/PS1
Fig. 4
Fig. 4
VPS35 chaperone R55 augments TREM2 recycling and Aβ endocytosis by Aβ-exposed microglia. Primary microglia were co-treated with oAβ and R55. (A) After R55 treatment, Aβ-exposed microglia were incubated with Aβ-555 for 30 min. The cells were then fixed and probed with anti-Rab5 antibodies, followed by counterstaining using DAPI. Scale bar = 10 μm. (B) Colocalization ratio of Aβ-555 with Rab5 in single cells via Manders’ colocalization coefficients. (C) After R55 treatment, the TREM2 internalization assay was performed in Aβ-exposed microglia. Subsequently, the cells were fixed and counterstained with DAPI. Scale bar = 20 μm. (D) TREM2 intensity in the Aβ-exposed microglia in panel C (n > 50). (E) After R55 treatment, the TREM2 recycling assay was conducted in Aβ-exposed microglia. The cells were further fixed and counterstained with DAPI. Scale bar = 20 μm. (F) TREM2 intensity in the Aβ-exposed microglia in panel E (n > 80). (G) After R55 treatment, membrane TREM2 in Aβ-exposed microglia was labeled with anti-TREM2 antibodies and allowed to undergo internalization for 60 min. The cells were then fixed and probed with anti-LAMP1 antibodies. Scale bar = 10 μm. (H) Colocalization ratio of TREM2 with LAMP1 in single cells via Manders’ colocalization coefficients (n > 100). (I) Vps35 expression in R55-treated Aβ-exposed microglia was estimated via qRT-PCR (n = 3). *p < 0.05, **p < 0.01, and ***p < 0.001 by Student’s t-test (H) or two-way ANOVA (B, D, F and I). n.s. indicates no significant difference
Fig. 5
Fig. 5
IHT-induced upregulation of Aβ endocytosis by Aβ-exposed microglia depends on VPS35. Primary microglia were transfected with lentivirus expressing Cre-GFP. (A) Cells were labeled with anti-VPS35 antibodies. Scale bar = 20 μm. (B) VPS35 intensity in GFP and GFP+ cells in panel A (n > 50). (C) Cells were incubated with Aβ-555 for 30 min and then fixed. Scale bar = 10 μm. (D) Aβ-555 intensity in GFP- or GFP+ cells in panel C (n > 80). (E) Cells were labeled with anti-LAMP1 and anti-TREM2 antibodies, followed by counterstaining using DAPI. Scale bar = 5 μm. (F) Colocalization ratio of TREM2 with LAMP1 in single cells via Manders’ colocalization coefficients (n > 100). (G to J) Cells were treated with oAβ to construct Aβ-exposed microglia, followed by treatment with IHT. TREM2 internalization (G), TREM2 recycling (I), and Aβ-555 uptake (K) assays were conducted in the Aβ-exposed microglia (Scale bar = 20 μm). Endocytosed TREM2 (H), recycled TREM2 (J), and internalized Aβ-555 (L) were quantified from panels G, I, and K, respectively (n > 50). *p < 0.05, **p < 0.01, and ***p < 0.001 by Student’s t-test (B, D and F) or two-way ANOVA (H, J and L). n.s. indicates no significant difference. Nor, normoxia; IHT, intermittent hypoxia training
Fig. 6
Fig. 6
IHT exhibits no significant improvement in Aβ pathology in 7-months microglial VPS35-deficient APP/PS1 mice. (A) Labeling information for different groups. (B) Flowchart of the development of IHT-treated MG VPS35 KO: APP/PS1 mice. (C) Escape latency of the IHT-treated MG VPS35 KO: APP/PS1 mice to find the platform for the first during the MWM training period. (D) Swimming trajectories of the mice in the MWM probe period. (E) The dwelling time in the target quadrant was calculated as the percentage of the total time in the MWM probe test. (F) Total moving distance in the target quadrant was calculated in the MWM probe test. (G) The escape latency of mice to archive the target quadrant during the MWM probe period. (H) The average swimming speed of mice during the MWM probe test (n = 5). (I) Brain sections of the IHT-treated MG VPS35 KO: APP/PS1 mice were labeled with 6E10 antibodies. White arrows indicate plaques. Scale bar = 2 mm. (J) Brain sections of the IHT-treated MG VPS35 KO: APP/PS1 mice were probed with anti-PSD95 antibodies to label synapses in the CA1 region. Scale bar = 150 μm. (K) Brain sections of the IHT-treated MG VPS35 KO: APP/PS1 mice were stained with anti-Iba1 and anti-TREM2 antibodies. Scale bar = 20 μm. (L) Number of Aβ plaques in the hippocampus and cortex regions in panel I. (M) PSD95 intensity in the CA1 region in panel J. (N) TREM2 intensity in the DAM of CA1 region in panel K (five mice in each group, with five to eight cells per mouse). *p < 0.05, **p < 0.01, and ***p < 0.001 by two-way ANOVA. n.s. indicates no significant difference. Nor, normoxia; IHT, intermittent hypoxia training
Fig. 7
Fig. 7
TFEB transcriptionally regulates Vps35 in BV2 cells. (A) A consensus TFEB-binding motif within the ChIP-seq peaks. (B) ChIP-PCR was performed to identify potential TFEB-binding elements in the Vps35 gene regulatory regions. IgG was used as a negative control. (C) ChIP-qPCR was conducted to detect the fold enrichment of the three identified CLEAR elements. (D) Sequences of ChIP-based CLEAR elements and mutants. (E) Dual luciferase activities of the constructs containing the promoter region of Vps35 with either intact (WT) or mutated (Mut) CLEAR elements were compared between shControl (NC) and shTFEB HEK293T cells. (F and G) Tfeb and Vps35 expressions in TA1-treated shTfeb BV2 cells were estimated with qRT-PCR. n = 3, *p < 0.05 and ***p < 0.001 by Student’s t-test (C) or two-way ANOVA (E to G). n.s. indicates no significant difference
Fig. 8
Fig. 8
IHT-induced attenuation of Aβ pathology and amelioration of Aβ endocytosis by DAM depends on TFEB. 9-month-old APP/PS1 mice were treated with TA1. (A) Brain sections of TA1-treated APP/PS1 mice were stained with anti-TFEB/anti-VPS35/anti-TREM2 and anti-Iba1 antibodies, and microscopy images of DAM in CA1 region were captured. Scale bar = 20 μm. (B to D) TFEB (B), VPS35 (C), and TREM2 (D) intensities in the DAM in panel A (six mice in each group, with 10 cells per mouse). (E) ShTfeb BV2 cells were used to construct Aβ-exposed microglia and then treated with IHT. TFEB and VPS35 expression levels were detected via Western blotting. (F) Grayscale values of the protein bands in panel E (n = 3). (G) After treatment with IHT, shTfeb Aβ-exposed microglia were incubated with Aβ-555 for 30 min, followed by fixation and counterstaining with DAPI. Scale bar = 10 μm. (H) Aβ-555 intensity in the GFP+ cells in panel G (n > 50). *p < 0.05, **p < 0.01, and ***p < 0.001 by Student’s t-test (B to D) or two-way ANOVA (F, H). n.s. indicates no significant difference. Nor, normoxia; IHT, intermittent hypoxia training
Fig. 9
Fig. 9
TFEB inhibition reduces the IHT-induced upregulation of VPS35 in DAM 9-months APP/PS1 mice brains. (A) Brain sections of APP/PS1 mice treated with IHT or EO were probed with 6E10 antibodies, and microscopy images of the Aβ plaques were acquired. White arrows indicate plaques. Scale bar = 2 mm. (B) Number of Aβ plaques in the hippocampus in panel A (n = 9). (C to H) Brain sections of IHT or EO-treated APP/PS1 mice were stained with anti-TFEB (C), anti-VPS35 (E), or anti-TREM2 (G) and anti-Iba1 antibodies, and microscopy images of DAM in CA1 region were captured. Scale bar = 20 μm. TFEB (D), VPS35 (F), and TREM2 (H) intensities in the DAM cells in panels C, E, and G, respectively. *p < 0.05, **p < 0.01, and ***p < 0.001 by Student’s t-test (D, F and H: four mice in each group, with three to five cells per mouse). Nor, normoxia; IHT, intermittent hypoxia training

Similar articles

Cited by

References

    1. Zhang Y, Li Y, Ma L. Recent advances in research on Alzheimer’s disease in China. J Clin Neurosci. 2020;81:43–6. doi: 10.1016/j.jocn.2020.09.018. - DOI - PubMed
    1. Dubois B, et al. Preclinical Alzheimer’s disease: definition, natural history, and diagnostic criteria. Alzheimers Dement. 2016;12:292–323. doi: 10.1016/j.jalz.2016.02.002. - DOI - PMC - PubMed
    1. Vaz M, Silva V, Monteiro C, Silvestre S. Role of Aducanumab in the treatment of Alzheimer’s Disease: challenges and opportunities. Clin Interv Aging. 2022;17:797–810. doi: 10.2147/cia.S325026. - DOI - PMC - PubMed
    1. van Dyck CH, et al. Lecanemab in Early Alzheimer’s Disease. N Engl J Med. 2023;388:9–21. doi: 10.1056/NEJMoa2212948. - DOI - PubMed
    1. Sims JR, et al. Donanemab in early symptomatic Alzheimer Disease: the TRAILBLAZER-ALZ 2 Randomized Clinical Trial. JAMA. 2023;330:512–27. doi: 10.1001/jama.2023.13239. - DOI - PMC - PubMed

Publication types

MeSH terms