

Probing a neural unreliability account of auditory sensory processing atypicalities in Rett Syndrome
- PMID: 38831410
- PMCID: PMC11149250
- DOI: 10.1186/s11689-024-09544-x
Probing a neural unreliability account of auditory sensory processing atypicalities in Rett Syndrome
Abstract
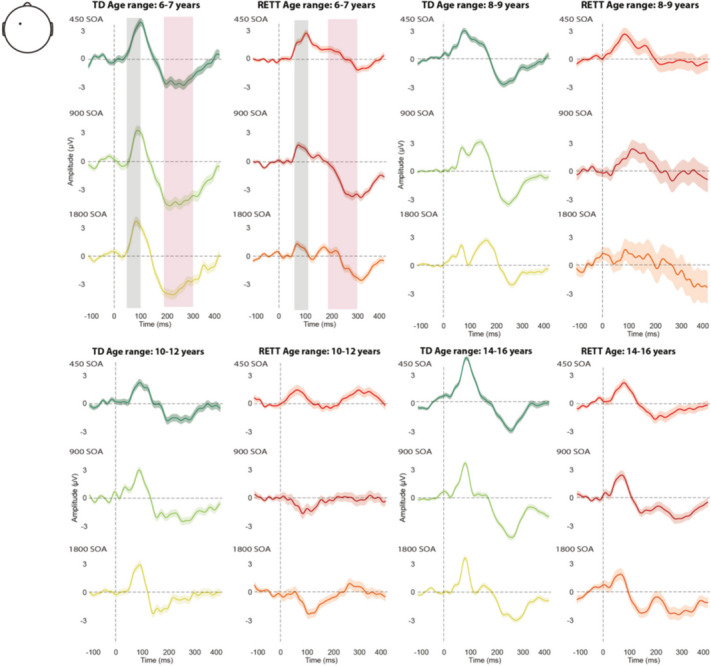
Background: In the search for objective tools to quantify neural function in Rett Syndrome (RTT), which are crucial in the evaluation of therapeutic efficacy in clinical trials, recordings of sensory-perceptual functioning using event-related potential (ERP) approaches have emerged as potentially powerful tools. Considerable work points to highly anomalous auditory evoked potentials (AEPs) in RTT. However, an assumption of the typical signal-averaging method used to derive these measures is "stationarity" of the underlying responses - i.e. neural responses to each input are highly stereotyped. An alternate possibility is that responses to repeated stimuli are highly variable in RTT. If so, this will significantly impact the validity of assumptions about underlying neural dysfunction, and likely lead to overestimation of underlying neuropathology. To assess this possibility, analyses at the single-trial level assessing signal-to-noise ratios (SNR), inter-trial variability (ITV) and inter-trial phase coherence (ITPC) are necessary.
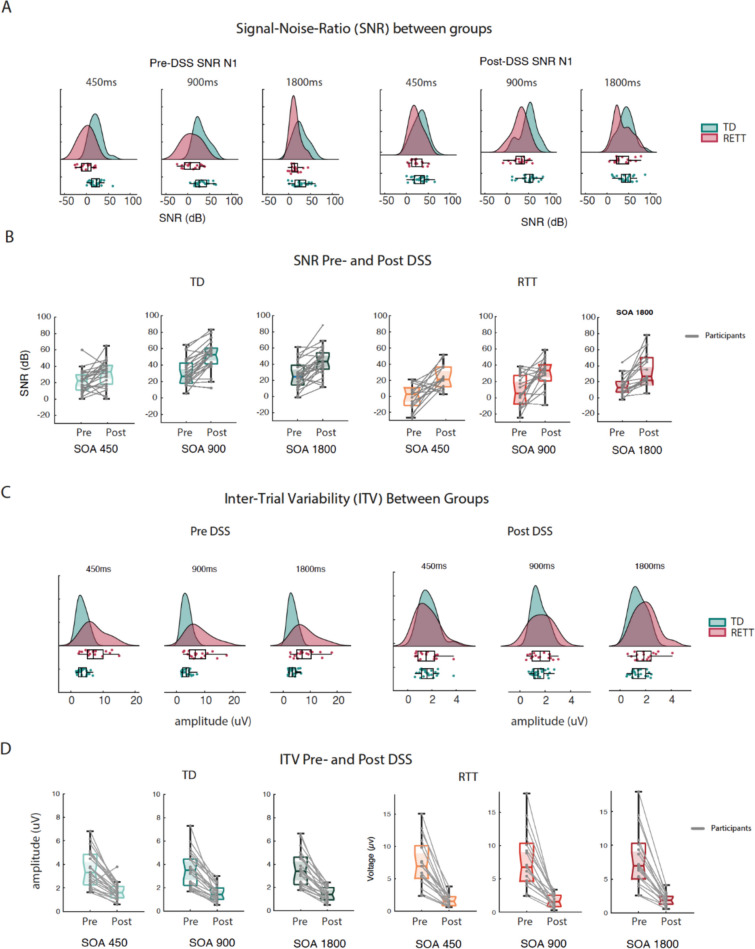
Methods: AEPs were recorded to simple 100 Hz tones from 18 RTT and 27 age-matched controls (Ages: 6-22 years). We applied standard AEP averaging, as well as measures of neuronal reliability at the single-trial level (i.e. SNR, ITV, ITPC). To separate signal-carrying components from non-neural noise sources, we also applied a denoising source separation (DSS) algorithm and then repeated the reliability measures.
Results: Substantially increased ITV, lower SNRs, and reduced ITPC were observed in auditory responses of RTT participants, supporting a "neural unreliability" account. Application of the DSS technique made it clear that non-neural noise sources contribute to overestimation of the extent of processing deficits in RTT. Post-DSS, ITV measures were substantially reduced, so much so that pre-DSS ITV differences between RTT and TD populations were no longer detected. In the case of SNR and ITPC, DSS substantially improved these estimates in the RTT population, but robust differences between RTT and TD were still fully evident.
Conclusions: To accurately represent the degree of neural dysfunction in RTT using the ERP technique, a consideration of response reliability at the single-trial level is highly advised. Non-neural sources of noise lead to overestimation of the degree of pathological processing in RTT, and denoising source separation techniques during signal processing substantially ameliorate this issue.
Keywords: Auditory Evoked Potential; AEP; Auditory discrimination; Denoising Source Separation (DSS); EEG; Event-related potential; ERP; Females; High-density electrical mapping; Inter-Trial Phase Coherence (ITPC); Inter-trial variability (ITV); Neurodevelopmental disorder; Rett Syndrome Severity Scale (RSSS); Signal-noise ratio (SNR); X-linked mutation; MECP2.
© 2024. The Author(s).
Conflict of interest statement
The authors declare no financial or other competing interests that are pertinent to the results of this study.
Figures


Update of
-
Probing a neural unreliability account of auditory sensory processing atypicalities in Rett Syndrome.medRxiv [Preprint]. 2024 Jan 26:2024.01.25.24301723. doi: 10.1101/2024.01.25.24301723. medRxiv. 2024. Update in: J Neurodev Disord. 2024 Jun 3;16(1):28. doi: 10.1186/s11689-024-09544-x. PMID: 38343802 Free PMC article. Updated. Preprint.
-
Probing a neural unreliability account of auditory sensory processing atypicalities in Rett Syndrome.Res Sq [Preprint]. 2024 Jan 30:rs.3.rs-3863341. doi: 10.21203/rs.3.rs-3863341/v1. Res Sq. 2024. Update in: J Neurodev Disord. 2024 Jun 3;16(1):28. doi: 10.1186/s11689-024-09544-x. PMID: 38352397 Free PMC article. Updated. Preprint.
References
MeSH terms
Grants and funding
- P50 HD105352/HD/NICHD NIH HHS/United States
- HD105352/Eunice Kennedy Shriver National Institute of Child Health and Human Development
- HD103536/Eunice Kennedy Shriver National Institute of Child Health and Human Development
- DC012447/DC/NIDCD NIH HHS/United States
- P50 HD103536/HD/NICHD NIH HHS/United States
LinkOut - more resources
Full Text Sources
Medical
