

Country-specific determinants for COVID-19 case fatality rate and response strategies from a global perspective: an interpretable machine learning framework
- PMID: 38831424
- PMCID: PMC11149258
- DOI: 10.1186/s12963-024-00330-4
Country-specific determinants for COVID-19 case fatality rate and response strategies from a global perspective: an interpretable machine learning framework
Abstract
Background: There are significant geographic inequities in COVID-19 case fatality rates (CFRs), and comprehensive understanding its country-level determinants in a global perspective is necessary. This study aims to quantify the country-specific risk of COVID-19 CFR and propose tailored response strategies, including vaccination strategies, in 156 countries.
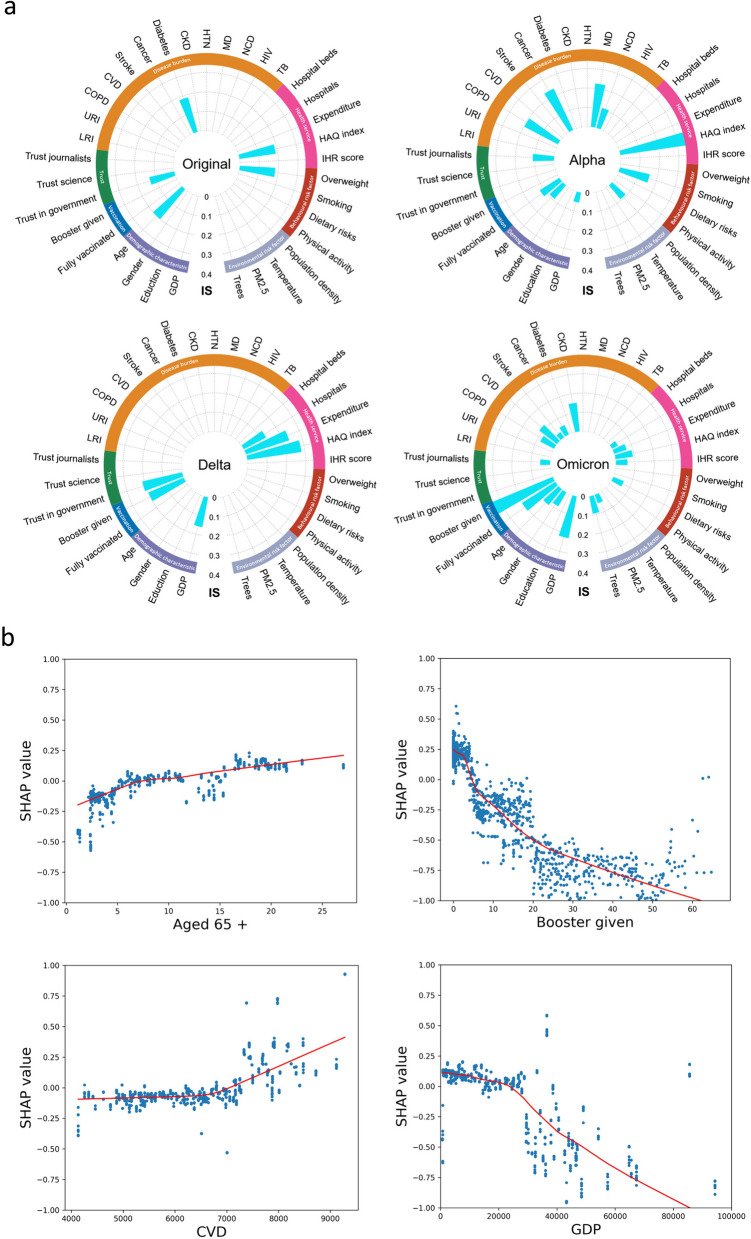
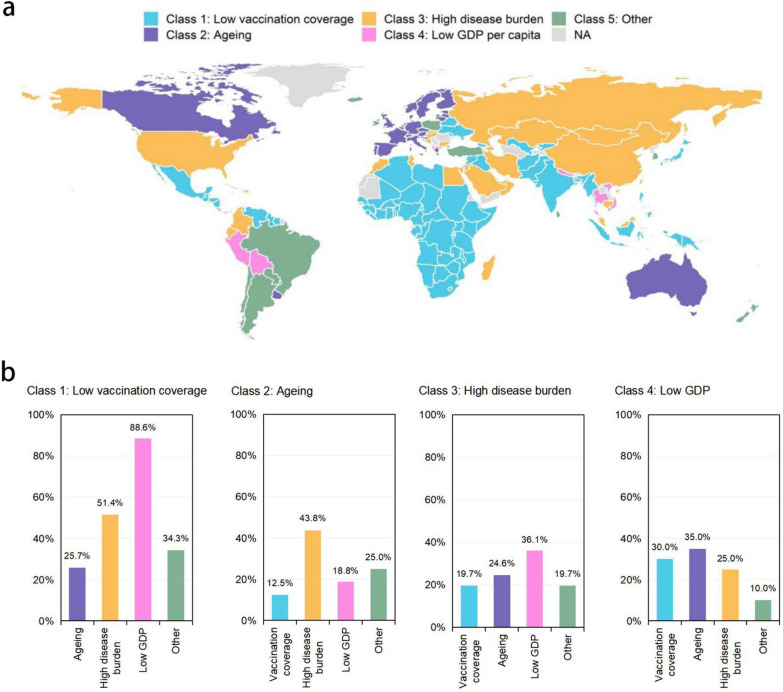
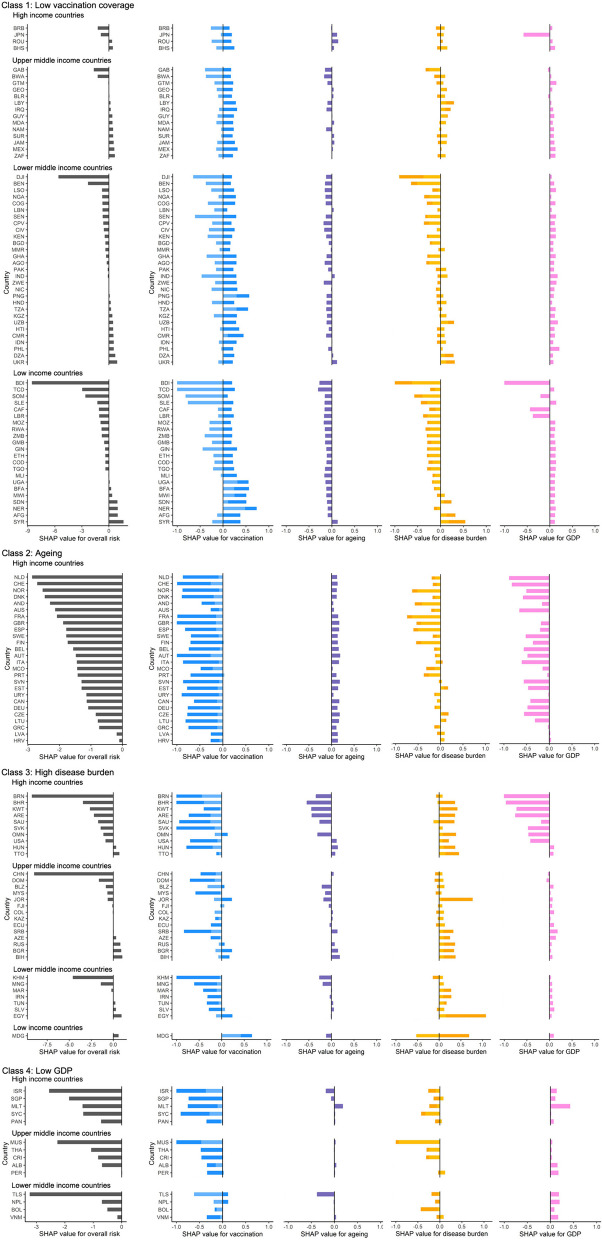
Methods: Cross-temporal and cross-country variations in COVID-19 CFR was identified using extreme gradient boosting (XGBoost) including 35 factors from seven dimensions in 156 countries from 28 January, 2020 to 31 January, 2022. SHapley Additive exPlanations (SHAP) was used to further clarify the clustering of countries by the key factors driving CFR and the effect of concurrent risk factors for each country. Increases in vaccination rates was simulated to illustrate the reduction of CFR in different classes of countries.
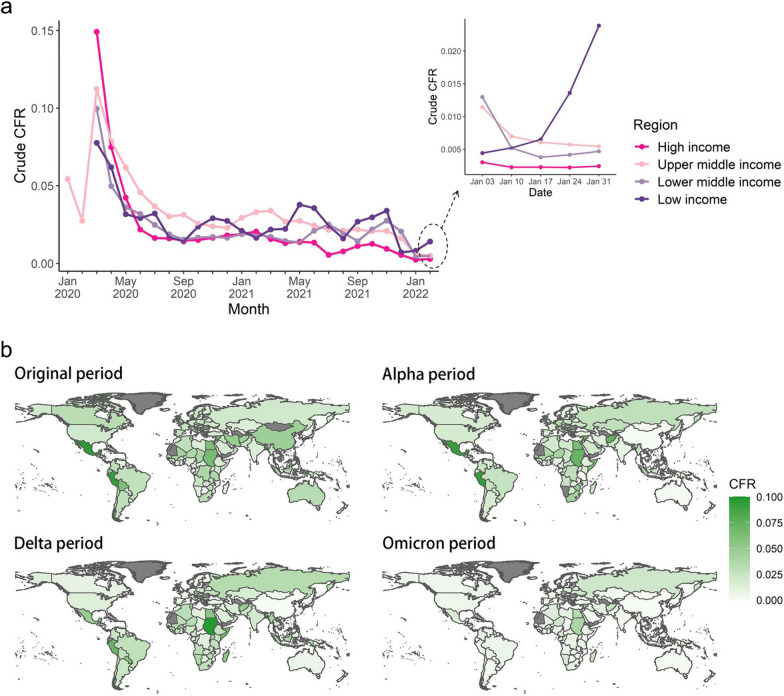
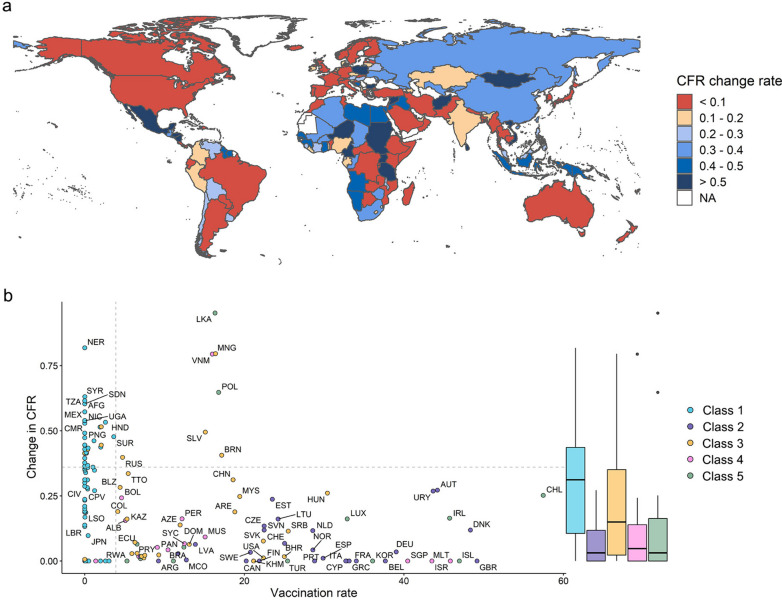
Findings: Overall COVID-19 CFRs varied across countries from 28 Jan 2020 to 31 Jan 31 2022, ranging from 68 to 6373 per 100,000 population. During the COVID-19 pandemic, the determinants of CFRs first changed from health conditions to universal health coverage, and then to a multifactorial mixed effect dominated by vaccination. In the Omicron period, countries were divided into five classes according to risk determinants. Low vaccination-driven class (70 countries) mainly distributed in sub-Saharan Africa and Latin America, and include the majority of low-income countries (95.7%) with many concurrent risk factors. Aging-driven class (26 countries) mainly distributed in high-income European countries. High disease burden-driven class (32 countries) mainly distributed in Asia and North America. Low GDP-driven class (14 countries) are scattered across continents. Simulating a 5% increase in vaccination rate resulted in CFR reductions of 31.2% and 15.0% for the low vaccination-driven class and the high disease burden-driven class, respectively, with greater CFR reductions for countries with high overall risk (SHAP value > 0.1), but only 3.1% for the ageing-driven class.
Conclusions: Evidence from this study suggests that geographic inequities in COVID-19 CFR is jointly determined by key and concurrent risks, and achieving a decreasing COVID-19 CFR requires more than increasing vaccination coverage, but rather targeted intervention strategies based on country-specific risks.
Keywords: COVID-19; Case fatality rate; Global health; Pandemics; SHAP; Strategy; Vaccination; XGBoost.
© 2024. The Author(s).
Conflict of interest statement
The authors declare that the research was conducted in the absence of any commercial or financial relationships that could be construed as a potential conflict of interest.
Figures
Similar articles
-
The role of booster vaccination in decreasing COVID-19 age-adjusted case fatality rate: Evidence from 32 countries.Front Public Health. 2023 Apr 18;11:1150095. doi: 10.3389/fpubh.2023.1150095. eCollection 2023. Front Public Health. 2023. PMID: 37143970 Free PMC article.
-
Pandemic preparedness and COVID-19: an exploratory analysis of infection and fatality rates, and contextual factors associated with preparedness in 177 countries, from Jan 1, 2020, to Sept 30, 2021.Lancet. 2022 Apr 16;399(10334):1489-1512. doi: 10.1016/S0140-6736(22)00172-6. Epub 2022 Feb 1. Lancet. 2022. PMID: 35120592 Free PMC article.
-
SARS-CoV-2 Vaccination Coverage and Key Public Health Indicators May Explain Disparities in COVID-19 Country-Specific Case Fatality Rate Within European Economic Area.Cureus. 2022 Mar 9;14(3):e22989. doi: 10.7759/cureus.22989. eCollection 2022 Mar. Cureus. 2022. PMID: 35415037 Free PMC article.
-
Case fatality rates of COVID-19 during epidemic periods of variants of concern: A meta-analysis by continents.Int J Infect Dis. 2024 Apr;141:106950. doi: 10.1016/j.ijid.2024.01.017. Epub 2024 Feb 1. Int J Infect Dis. 2024. PMID: 38309460
-
Estimating national-level measles case-fatality ratios in low-income and middle-income countries: an updated systematic review and modelling study.Lancet Glob Health. 2023 Apr;11(4):e516-e524. doi: 10.1016/S2214-109X(23)00043-8. Lancet Glob Health. 2023. PMID: 36925172 Free PMC article.
Cited by
-
Changes in Physical Activity, Heart Rate, and Sleep Measured by Activity Trackers During the COVID-19 Pandemic Across 34 Countries: Retrospective Analysis.J Med Internet Res. 2025 Apr 4;27:e68199. doi: 10.2196/68199. J Med Internet Res. 2025. PMID: 40184182 Free PMC article.
References
-
- WHO: COVID is here ‘for the foreseeable future | United Nations in Turkey [Internet]. [cited 2022 May 15]. Available from: https://turkey.un.org/en/169490-who-covid-here-foreseeable-future, https://turkey.un.org/en/169490-who-covid-here-foreseeable-future
-
- WHO Coronavirus (COVID-19) Dashboard [Internet]. [cited 2022 Jun 8]. Available from: https://covid19.who.int
MeSH terms
Substances
Grants and funding
- 2021ZD0114103/National Key Research and Development Program of China
- 2021ZD0114103/National Key Research and Development Program of China
- 2021ZD0114103/National Key Research and Development Program of China
- 2021ZD0114103/National Key Research and Development Program of China
- 2021ZD0114103/National Key Research and Development Program of China
LinkOut - more resources
Full Text Sources
Medical
