. 2024 Jun 3;22(1):308.
doi: 10.1186/s12964-024-01681-z.

Gasdermin D deficiency aborts myeloid calcium influx to drive granulopoiesis in lupus nephritis

Affiliations

Gasdermin D deficiency aborts myeloid calcium influx to drive granulopoiesis in lupus nephritis

Jiani Shen et al. Cell Commun Signal. .

Abstract

Gasdermin D (GSDMD) is emerging as an important player in autoimmune diseases, but its exact role in lupus nephritis (LN) remains controversial. Here, we identified markedly elevated GSDMD in human and mouse LN kidneys, predominantly in CD11b+ myeloid cells. Global or myeloid-conditional deletion of GSDMD was shown to exacerbate systemic autoimmunity and renal injury in lupus mice with both chronic graft-versus-host (cGVH) disease and nephrotoxic serum (NTS) nephritis. Interestingly, RNA sequencing and flow cytometry revealed that myeloid GSDMD deficiency enhanced granulopoiesis at the hematopoietic sites in LN mice, exhibiting remarkable enrichment of neutrophil-related genes, significant increases in total and immature neutrophils as well as granulocyte/macrophage progenitors (GMPs). GSDMD-deficient GMPs and all-trans-retinoic acid (ATRA)-stimulated human promyelocytes NB4 were further demonstrated to possess enhanced clonogenic and differentiation abilities compared with controls. Mechanistically, GSDMD knockdown promoted self-renewal and granulocyte differentiation by restricting calcium influx, contributing to granulopoiesis. Functionally, GSDMD deficiency led to increased pathogenic neutrophil extracellular traps (NETs) in lupus peripheral blood and bone marrow-derived neutrophils. Taken together, our data establish that GSDMD deletion accelerates LN development by promoting granulopoiesis in a calcium influx-regulated manner, unraveling its unrecognized critical role in LN pathogenesis.

Keywords: Calcium influx; Gasdermin D; Granulopoiesis; Lupus nephritis; Myeloid cell.


Conflict of interest statement

The authors declare no competing interests.

Figures
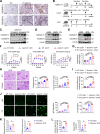
Fig. 1
Fig. 1
GSDMD deletion exacerbates lupus-like phenotype in cGVH and NTS models. A Immunochemical images of GSDMD-FL and GSDMD-N pattern in renal section from normal control (NC) and LN patients. Scale bars: 50 μm. B Schematic of murine lupus models. NZB/W F1 mice were sacrificed at 14 weeks and 36 weeks. For cGVH model, C57BL/6 mice received an intraperitoneal injection of 1 × 10^8 bm12-derived splenocytes and were sacrificed 10 weeks post-induction. For NTS model, C57BL/6 mice were preimmunized with 0.2 mg sheep IgG intraperitoneally, followed by an intravenous injection of 50 μl sheep NTS on Day 4, and sacrificed on Day 11. C-E Immunoblotting of GSDMD in renal protein extracts of NZB/W F1 mice, cGVH or NTS mice with control (CON) mice. β-actin is loading control. F ELISA determining the level of autoantibodies (anti-dsDNA, anti-ssDNA and anti-histone) in serum of cGVH mice (n = 4 or 5 per group). G Spleen to body weight ratio in cGVH mice (n = 8 per group). H Representative PAS staining of kidney sections with quantitative analysis of glomerular cellularity and tubular injury scores in cGVH mice (n = 5 or 10 per group). Scale bars: 50 μm. I Urine albumin to creatinine ratio in cGVH mice (n = 8 per group). J Representative images and quantified immunofluorescence density of IgG and C3 deposition in the kidneys from cGVH mice (n = 5 per group). Scale bars: 50 μm. K Quantitative analysis of glomerular PAS score and tubular injury scores in kidney sections from NTS mice (n = 5 per group). L Urine albumin to creatinine ratio and BUN in NTS mice (n = 5 per group). Data are shown as mean ± SEM. Two-way ANOVA test, ANOVA or Student’s t test was used for statistical analysis. ****P < 0.0001; ***P < 0.001; **P < 0.01; *P < 0.05; ns, not significant
Fig. 2
Fig. 2
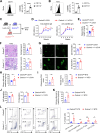
Myeloid GSDMD deficiency is sufficient to exacerbate autoimmunity and renal injury in lupus mice. A-B The MFI of GSDMD expression in CD11b+ cells and CD11b cells from cGVH and NTS models (n = 5 per group). C Experimental outline of the generation of myeloid-specific GSDMD-deficient mice (Gsdmd△Lyz2) and LN models construction in Gsdmd△Lyz2 and its littermate controls (Gsdmdfl/fl). D ELISA determining the level of autoantibodies (anti-dsDNA and anti-ssDNA) in the serum of cGVH mice (n = 6 or 7 per group). E Spleen to body weight ratio in cGVH mice (n = 10 per group). F Representative PAS staining and quantitative analysis of glomerular cellularity and tubular injury scores of kidney sections from cGVH mice. Scale bar: 50 μm. (n = 5 or 6 per group). G Immune complex deposition (IgG and C3) immunofluorescence of kidney sections from different groups of cGVH mice. Scale bar: 50 μm. Quantitative analysis of IgG and C3 MFI were analyzed (n = 5 or 6 per group). H Urine albumin-to-creatinine ratio in different groups of cGVH mice (n = 5 or 6 per group). I Quantitative analysis of glomerular PAS score and tubular injury scores of kidney sections from NTS mice (n = 4 per group). J Quantitative analysis of IgG and C3 MFI of kidney sections from NTS mice (n = 4 per group). K Urine albumin-to-creatinine ratio in NTS mice (n = 4 per group). L Representative image of flow cytometric analysis and quantitative analysis of the percentages of CD11b+ cells, CD11b+F4/80hi macrophages (Mac), CD11b+Gr-1hi neutrophils (Neu) and CD11c+ dendritic cells (DC) among total cells in the kidneys of NTS mice (n = 4 per group). Data are shown as mean ± SEM. One-way ANOVA test, two-way ANOVA or Student’s t test was used for statistical analysis. ****P < 0.0001; ***P < 0.001; **P < 0.01; *P < 0.05
Fig. 3
Fig. 3
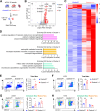
GSDMD-deficient myeloid cells from lupus spleen exhibit immature neutrophil expansion and differentiation. A Experimental design for RNA-sequencing. Gsdmdfl/fl and Gsdmd△Lyz2 mice were induced cGVH model. After 10 weeks, mice were sacrificed, and then splenic CD11b+ cells were isolated using magnetic-activated cell sorting (MACS) and performed bulk RNA-seq (n = 3 per group). B Volcano plot for DEG of splenic CD11b+ cells from Gsdmdfl/fl and Gsdmd△Lyz2 mice (n = 3 per group). C Heatmap of DEG from bulk RNA-seq transcripts of sorted CD11b+ cells above. Data are represented as a Z score, from low (blue) to high (red) expression. Gene clusters (1 to 3) were defined according to hierarchical clustering. D Bar plots of top GO terms from DEGs exported for gene ontology (GO) enrichment analysis showing the top GO terms. E Flow cytometric analysis of total CD11b+Ly6Ghi neutrophils in the spleens of cGVH induced in Gsdmdfl/fl and Gsdmd△Lyz2 mice (n = 4 or 5 per group). F Flow cytometric analysis of total CD11b+Ly6Ghi neutrophils in the spleens of NTS model induced in Gsdmdfl/fl and Gsdmd△Lyz2 mice (n = 4 or 5 per group). G Flow cytometric analysis of Ly6G+CD101 immature and Ly6G+CD101+ mature neutrophils in the spleens of cGVH (n = 5 per group). H Flow cytometric analysis of Ly6G+CD101 immature and Ly6G+CD101+ mature neutrophils in the spleens of NTS model induced in Gsdmdfl/fl and Gsdmd△Lyz2 mice (n = 4 per group).. Data are shown as mean ± SEM. Student’s t test was used for statistical analysis. **P < 0.01; *P < 0.05; ns, not significant
Fig. 4
Fig. 4
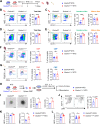
Myeloid GSDMD deficiency promotes granulopoiesis and NETs formation in lupus. A Experimental scheme. NTS model was induced in Gsdmdfl/fl and Gsdmd△Lyz2 mice, and then blood, spleens and bone marrow were collected for flow cytometry. B Representative flow cytometric plots and quantification of total CD11b+Ly6Ghi neutrophils in the blood of NTS mice (n = 7 per group). C Representative flow cytometric plots and quantification of Ly6G+CD101 immature and Ly6G+CD101+ mature neutrophils in the blood of NTS mice (n = 7 per group). D-E Representative flow cytometric plots and quantification of total CD11b+Ly6Ghi neutrophils, Ly6G+CD101 immature and Ly6G+CD101+ mature neutrophils in the bone marrow of NTS mice (n = 7 per group). F Representative flow cytometric plots and quantification of GMPs and CMPs in the spleens of NTS mice (n = 4–6 per group). G Representative flow cytometric plots and quantification of bone marrow of NTS mice (n = 4–6 per group). H Experimental scheme. Splenic GMPs were sorted from Gsdmdfl/fl and Gsdmd△Lyz2 NTS mice by fluorescence-activated cell sorting (FACS), and stimulated with SCF, IL-3, G-CSF and GM-CSF. I Representative images and quantification of colony forming of splenic GMPs (n = 3 per group). Scale bars: 200 μm. J Representative flow cytometric plots and quantification of CD11b+Ly6G+ neutrophils (n = 3 per group). K ELISA determining MPO and cfDNA levels representing NETs release in serum from NTS mice (n = 4–5 per group). L ELISA determining MPO and cfDNA levels representing NETs release in serum from cGVH mice (n = 8–10 per group). Data are shown as mean ± SEM. Student’s t test was used for statistical analysis. ***P < 0.01; *P < 0.05; ns, not significant
Fig. 5
Fig. 5
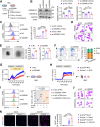
GSDMD deficiency promotes granulopoiesis by reducing calcium influx in myeloid progenitors. A Experimental scheme. NB4 cells transfected with si-NC and si-GSDMD were stimulated with ATRA (1μM), and then performed a series of analysis. B Immunoblotting of GSDMD in protein extracts of NB4 cells (n = 4 per group). GAPDH is loading control. C Representative flow cytometric plots and quantification CD11b MFI in different groups of NB4 cells (n = 4 per group). D Representative micrographs of wright & giemsa staining of NB4 cells. Scale bars: 10 μm. E Representative pictures and quantification of colonies of NB4 cells (n = 4 per group). Scale bars: 100 μm. (F) Cell cycle analysis of NB4 cells (n = 3 per group). G-H Flow analysis of the intracellular calcium levels using Indo-1, AM (3 μM) in NB4 cells (n = 3 per group) or GMPs isolated from the spleens of Gsdmdfl/fl and Gsdmd△Lyz2 NTS mice (n = 5 per group). 1 μM ATRA and 2 mM calcium was added to the cells at the indicated time. I Representative plots and quantification of CD11b MFI in ATRA-stimulated NB4 cells treated with or without ionomycin (Iono) (1μM) (n = 4 per group). J Representative micrographs of wright & giemsa staining of NB4 cells. Scale bars: 10 μm. K Representative images and quantified immunofluorescence of NETs release from bone marrow-derived neutrophils isolated from Gsdmdfl/fl and Gsdmd△Lyz2 NTS mice after 4h treatment with A23187 (5 uM) or vehicle. NETs release was calculated as the ratio of CitH3 (red area) in total cells (DAPI, blue area) per 100 neutrophils using ImageJ (n = 6 per group). Scale bars: 50 μm. Data are shown as mean ± SEM. One-way ANOVA, two-way ANOVA test or Student’s t test was used for statistical analysis. ****P < 0.0001; ***P < 0.001; **P < 0.01; *P < 0.05; ns, not significant
Fig. 6
Fig. 6
GSDMD expression on neutrophils in LN patients is inversely correlated with disease activity and proteinuria. A Neutrophils were isolated from the blood of LN patients to perform RT-PCR. B GSDMD expression negatively correlated with SLEDAI score in LN patients (n = 32). C GSDMD expression positively correlated with serum C3 level (g/L) in LN patients (n = 32). D GSDMD expression was compared in LN patients with higher 24h urine protein (24h UP) (> 1g) and lower 24h UP (≤ 1g) (n = 12 or 20 per group). Data are shown as mean ± SEM. Student’s t test or Pearson correlation test was performed.*P < 0.05. E Model for GSDMD function in granulopoiesis during LN. Following the induction of cGVH or NTS, DAMPs are released from the injured kidney, which activate granulopoiesis in the spleen and bone marrow. GSDMD is upregulated and activated in GMPs, potentially facilitating calcium entry into the cytoplasm. This occurs via two possible mechanisms: calcium influx through GSDMD-N pores in the plasma membrane or through Store-Operated Calcium Entry (SOCE) regulated by interactions between GSDMD and phosphoinositides (PIPs). GSDMD deficiency in myeloid cells restricts intracellular calcium concentrations, promotes granulocytic differentiation of GMPs, and subsequently enhances granulopoiesis. This leads to an uncontrolled expansion in pathogenic neutrophils, thereby exacerbating renal impairment in lupus nephritis

Similar articles

Cited by

References

    1. Kiriakidou M, Ching CL: Systemic Lupus Erythematosus. Ann Intern Med 2020, 172(11):ITC81-ITC96. - PubMed
    1. Roccatello D, Fenoglio R, Caniggia I, Kamgaing J, Naretto C, Cecchi I, Rubini E, Rossi D, De Simone E, Del Vecchio G, et al. Daratumumab monotherapy for refractory lupus nephritis. Nat Med. 2023;29(8):2041–2047. doi: 10.1038/s41591-023-02479-1. - DOI - PMC - PubMed
    1. Barber MRW, Drenkard C, Falasinnu T, Hoi A, Mak A, Kow NY, Svenungsson E, Peterson J, Clarke AE, Ramsey-Goldman R. Global epidemiology of systemic lupus erythematosus. Nat Rev Rheumatol. 2021;17(9):515–532. doi: 10.1038/s41584-021-00668-1. - DOI - PMC - PubMed
    1. Flores-Mendoza G, Sanson SP, Rodriguez-Castro S, Crispin JC, Rosetti F. Mechanisms of Tissue Injury in Lupus Nephritis. Trends Mol Med. 2018;24(4):364–378. doi: 10.1016/j.molmed.2018.02.003. - DOI - PubMed
    1. Tsokos GC, Lo MS, Costa Reis P, Sullivan KE. New insights into the immunopathogenesis of systemic lupus erythematosus. Nat Rev Rheumatol. 2016;12(12):716–730. doi: 10.1038/nrrheum.2016.186. - DOI - PubMed

Publication types

MeSH terms