. 2024 Nov 4;26(11):2084-2099.
doi: 10.1093/neuonc/noae094.

Disturbance in cerebral blood microcirculation and hypoxic-ischemic microenvironment are associated with the development of brain metastasis

Affiliations

Disturbance in cerebral blood microcirculation and hypoxic-ischemic microenvironment are associated with the development of brain metastasis

Jenny Roesler et al. Neuro Oncol. .

Abstract

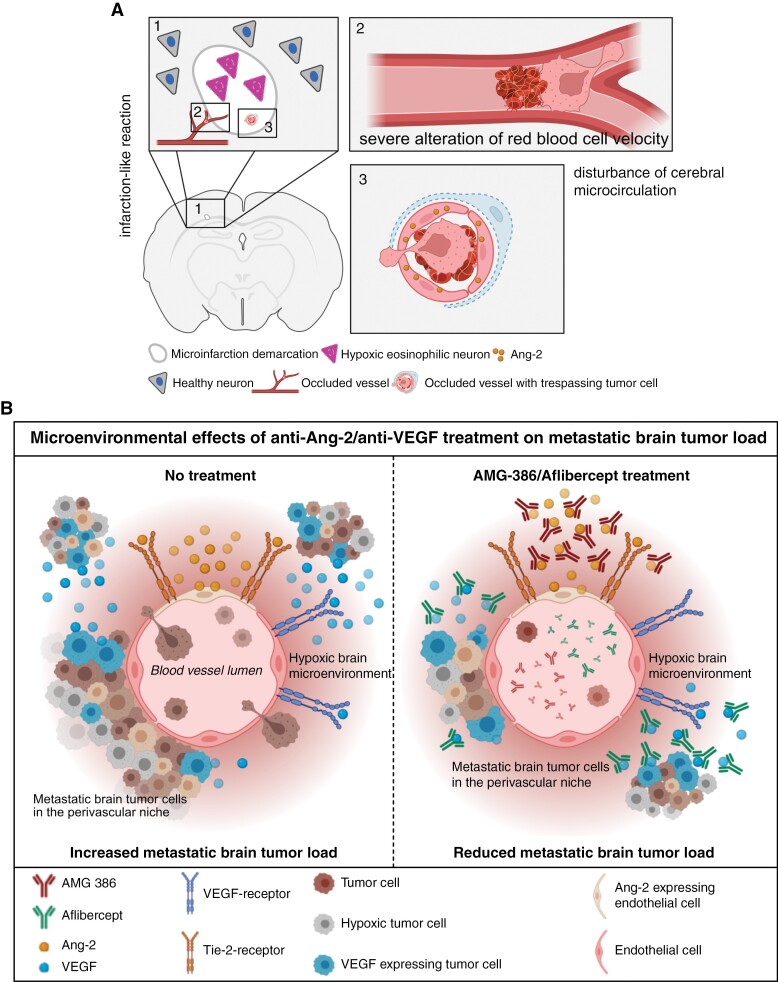
Background: Brain metastases (BM) constitute an increasing challenge in oncology due to their impact on neurological function, limited treatment options, and poor prognosis. BM occurs through extravasation of circulating tumor cells across the blood-brain barrier. However, the extravasation processes are still poorly understood. We here propose a brain colonization process which mimics infarction-like microenvironmental reactions, that are dependent on Angiopoietin-2 (Ang-2) and vascular endothelial growth factor (VEGF).

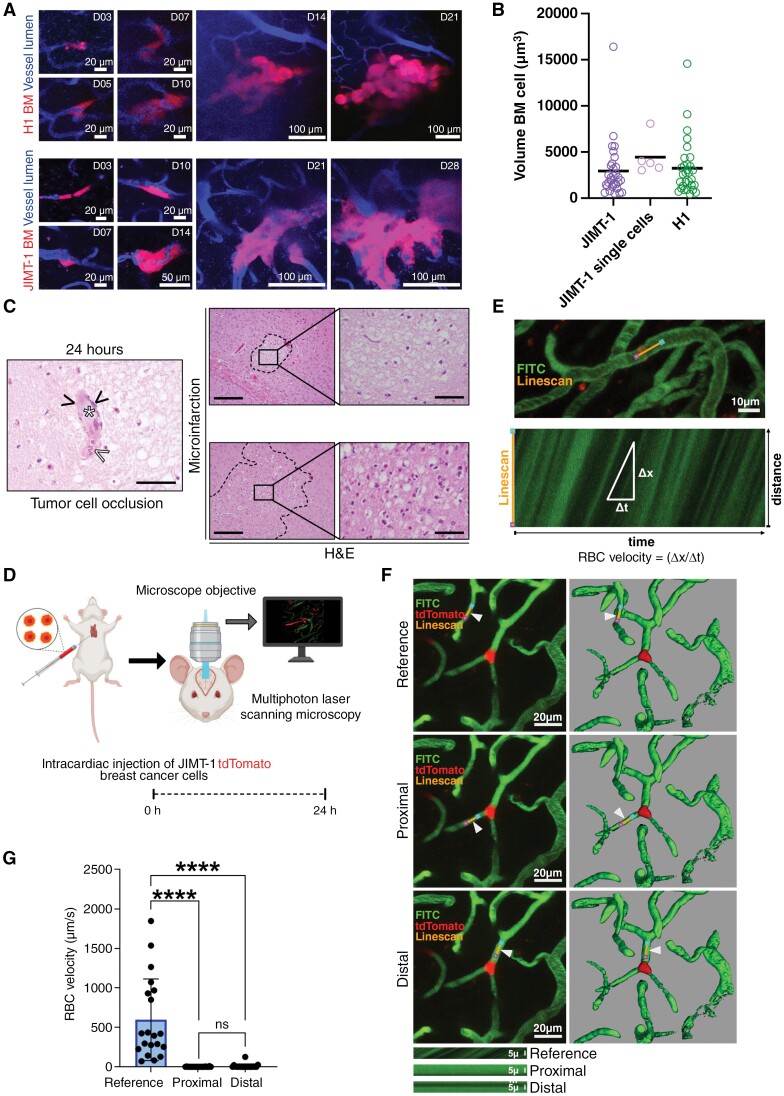
Methods: In this study, intracardiac BM models were used, and cerebral blood microcirculation was monitored by 2-photon microscopy through a cranial window. BM formation was observed using cranial magnetic resonance, bioluminescent imaging, and postmortem autopsy. Ang-2/VEGF targeting strategies and Ang-2 gain-of-function (GOF) mice were employed to interfere with BM formation. In addition, vascular and stromal factors as well as clinical outcomes were analyzed in BM patients.

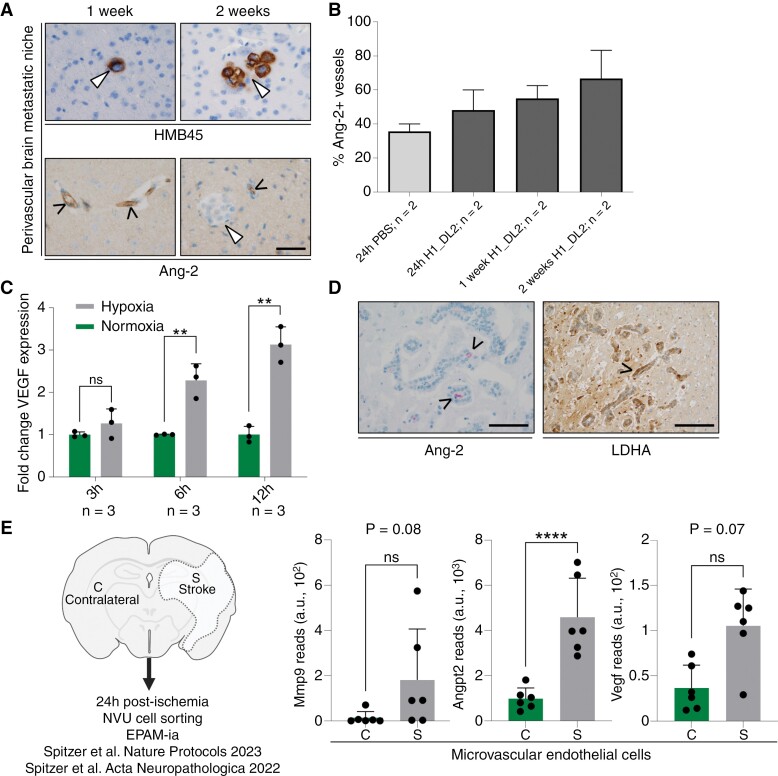
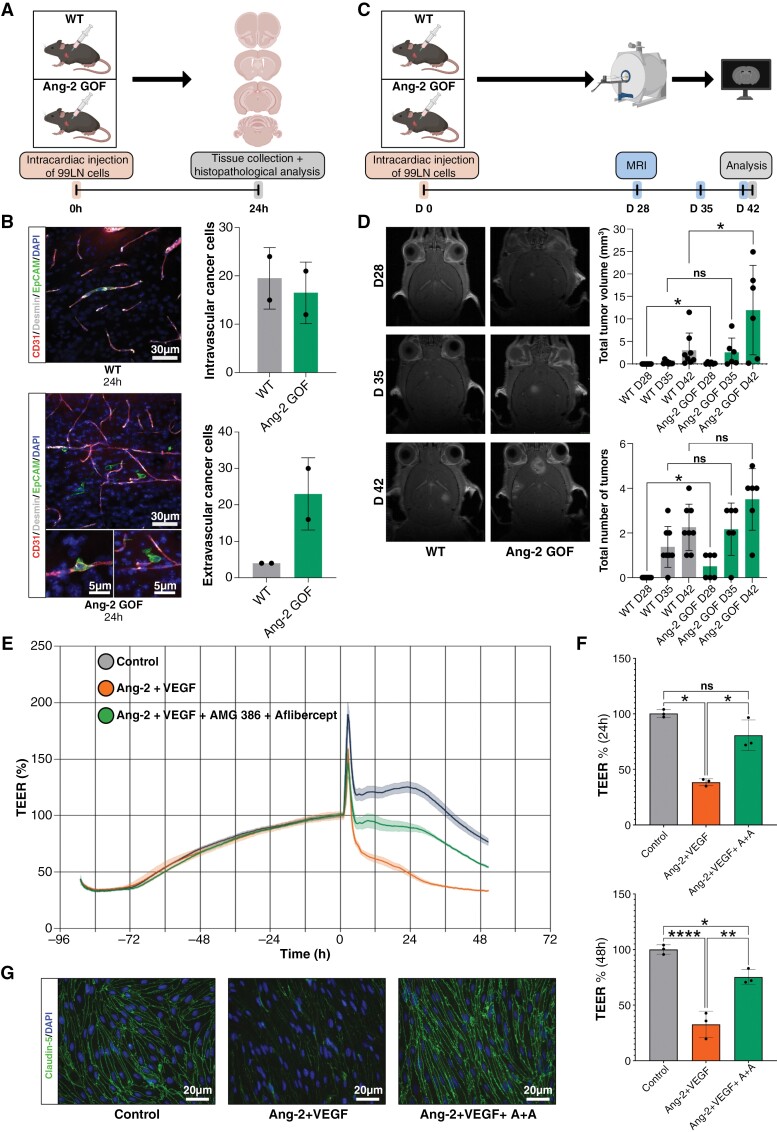
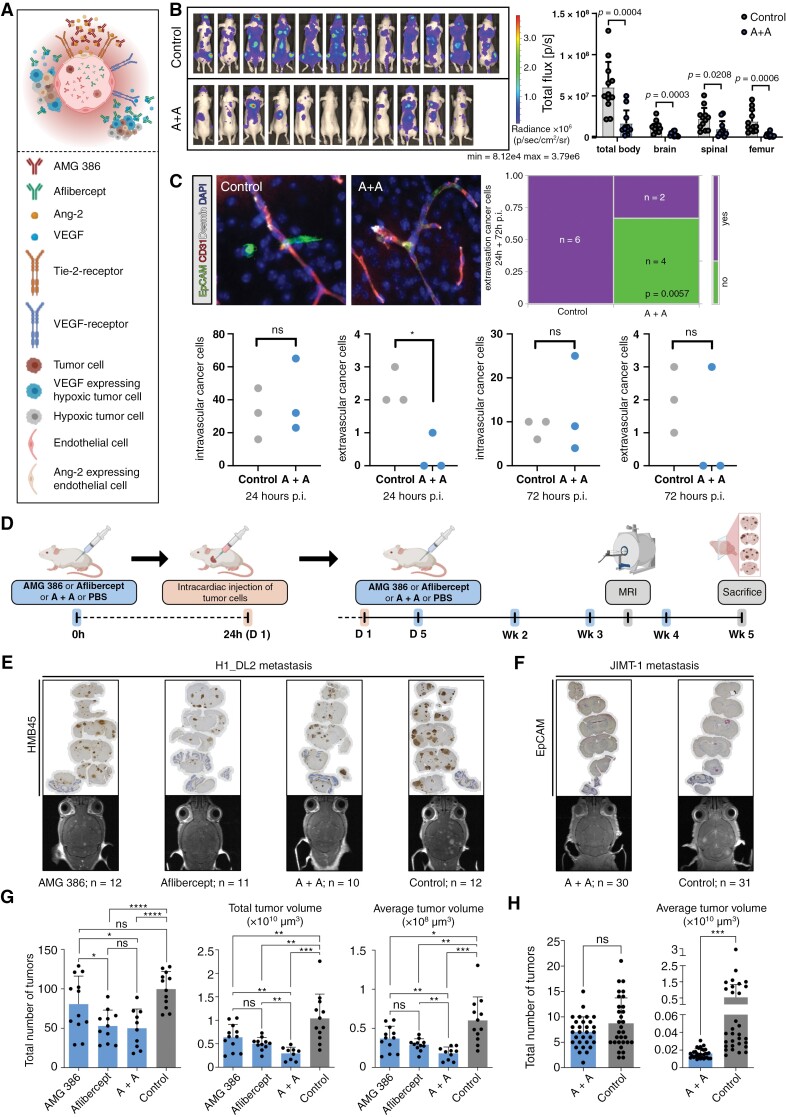
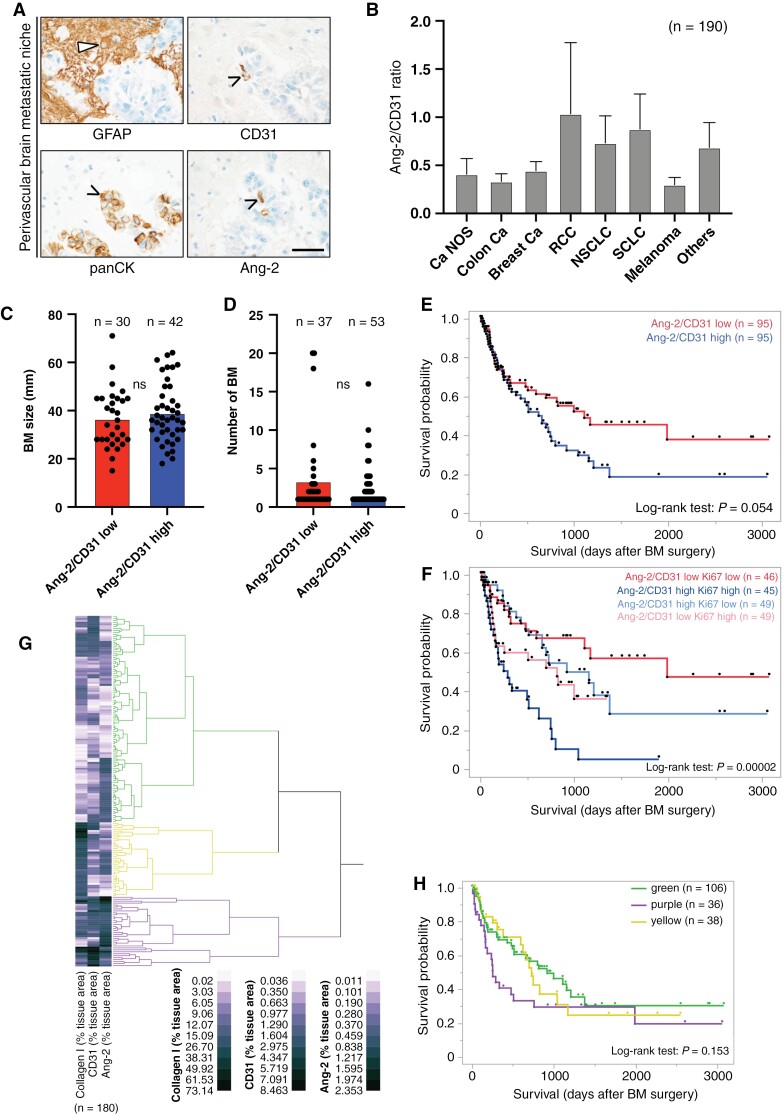
Results: Blood vessel occlusions by cancer cells were detected, accompanied by significant disturbances of cerebral blood microcirculation, and focal stroke-like histological signs. Cerebral endothelial cells showed an elevated Ang-2 expression both in mouse and human BM. Ang-2 GOF resulted in an increased BM burden. Combined anti-Ang-2/anti-VEGF therapy led to a decrease in brain metastasis size and number. Ang-2 expression in tumor vessels of established human BM negatively correlated with survival.

Conclusions: Our observations revealed a relationship between disturbance of cerebral blood microcirculation and brain metastasis formation. This suggests that vessel occlusion by tumor cells facilitates brain metastatic extravasation and seeding, while combined inhibition of microenvironmental effects of Ang-2 and VEGF prevents the outgrowth of macrometastases.

Keywords: VEGF; angiopoietin-2; anti-angiogenic therapy; brain metastases; perivascular niche.


Conflict of interest statement

The authors declare that they have no competing interests.

Figures

Figure 1.
Figure 1.
(A) Brain homing pattern of H1 melanoma and JIMT- breast cancer brain metastases between days 3 and 21 or 28, respectively. (B) Cancer cell thrombi volume was measured using reference volume data from electron microscopy-proven JIMT-1 single cells. (C) H&E staining showing microinfarction and a cancer cell (white asterisk) occluding a brain vessel (black arrowheads, scale bar 50 µm) close to a microinfarction with hypoxic eosinophilic neurons. White arrowhead depicting blood clotting. 24-hour time point showing examples of microinfarctions (images right, overview scale bar 200 µm, insert scale bar 50 µm). (D) Schematic summary illustrating blood flow velocity measurement experiments, depicting intracardiac injection of tdTomato expressing JIMT-1 breast cancer cells followed by in vivo multiphoton laser scanning microscopy imaging 24 hours post-intracardiac injection. (E) Example of a linescan trajectory (orange line), with pink and blue points marking linescan start and stop positions, respectively. Iterative scanning produces a time–space plot (E, bottom) where the angle of the streaks formed by moving red blood cells (RBC) is related to the speed of flow. The vertical dimension is distance along the linescan path, and the horizontal dimension is time. (F) Representative z-projections (F, left) and reconstructed 3D (F, right) in vivo images of FITC-dextran (fluorescein isothiocyanate-Dextran) positive blood vessels demonstrating tdTomato expressing JIMT-1 breast cancer cell arrested in microvessels, and line scan trajectories positioned in reference microvessel and in microvessel proximal and distal of the arrested tumor cell, indicated by arrowheads; examples of raw linescan data (kymographs; F, bottom) from microvessels collected parallel to the blood flow proximal and distal of the arrested tumor cell, and in a neighboring, independent microvessel (reference) of similar size and shape. (G) RBC velocity (µm/s) in neighboring, independent microvessels (reference), and in microvessels proximal and distal of arrested tumor cell in mice 24 hours post-intracardiac injection, n = 20; ****P < .0001 and not significant (ns) P > .05. *Indicates 2-tailed, unpaired t-test with Welch’s correction when variances were significantly different based on F-test.
Figure 2.
Figure 2.
(A) Immunostainings for HMB45 and Ang-2 demonstrating HMB45 expressing melanoma cells, which seed and colonize and form micrometastasis (white arrowhead) close to Ang-2 expressing brain microvessels 1 and 2 weeks after intracardiac injection of tumor cells in mice (scale bar 50 µm). (B) Percentage of Ang-2 expressing brain microvessels of the striatum in animals with intracardiac inoculation of PBS or H1_DL2 melanoma cells. (C) VEGF gene expression in JIMT-1 cancer cells in response to normoxia or hypoxia (** P < .01 and ns P > .05 by 2-tailed, unpaired t-test). (D) Lactate dehydrogenase A (LDHA) protein expression in metastasizing human cancer cells adherent to Ang-2 expressing brain microvessels in the perivascular pre-metastatic niche of a human brain metastasis (left panel scale bar 100 µm, right panel 200 µm). (E) Transcript reads obtained from NVU transcriptome profiling for Mmp9, Angpt2, and Vegf in endothelial cells (c, contralateral; s, stroke; n = 6, 3–4 mice per preparartion) [31,32]. ****P < .0001 and ns, not significant determined by DESeq2 with Benjamin-Hochberg correction.
Figure 3.
Figure 3.
(A) Scheme illustrating intracardiac injection of 99LN cells in wild type (WT) and angiopoietin-2 gain of function (Ang-2 GOF) C57BL/6 mice followed by tissue collection and histopathological analysis 24 hours after intracardiac injection. (B) Representative images of immunofluorescence staining for CD31 and desmin expressing microvessels and epithelial cell adhesion molecule (EpCAM) expressing tumor cells in WT and Ang-2 GOF C57BL/6 mice demonstrating intravascular and extravascular tumor cells (left panel); immunofluorescent analysis of 50 µm vibratome sections of WT and Ang-2 GOF mice (n = 2 WT and n = 2 Ang-2 GOF) revealed an increased migration and invasion of 99LN cells in Ang-2 GOF mice (right panel). (C) Schematic illustration of brain metastasis evolution experiment, depicting intracardiac injection of 99LN cells in WT and Ang-2 GOF C57BL/6 mice followed by assessment of brain metastatic load by MRI 28, 35, and 42 days after intracardiac injection of tumor cells. (D) MRI imaging revealed increased numbers of tumors and total tumor volumes in Ang-2 GOF mice 28 days and increased total tumor volumes in Ang-2 GOF mice 42 days after intracardiac tumor cell injection; n = 8 WT and n = 6 Ang-2 GOF, *P < .05 and not significant (ns) P > .05 by 2-tailed, unpaired t-test. (E) Representative graph for continuous TEER values of the MBMEC monolayer in control conditions and treatment conditions with either Ang-2 and VEGF or Ang-2, VEGF, AMG-386, and Aflibercept. (F) Quantification of 24 and 48 hours TEER values of MBMEC in control conditions and treatment conditions with Ang-2 and VEGF or Ang-2, VEGF, AMG-386, and Aflibercept; n = 3 independent experiments, *P < .05, **P < .01, ****P < .0001 and ns P > .05 by one way ANOVA (Tukey post hoc test). (G) Representative images of claudin-5 in endothelial monolayer in control and treatment conditions. DAPI was used to reveal cell nuclei.
Figure 4.
Figure 4.
(A) Scheme illustrating microenvironmental Ang-2 and VEGF blocking in brain metastases formation. (B) Bioluminescence imaging 2 weeks after intracardial H1_DL2 injection. Regions of interest “total body,” “brain,” “spinal” and “femur” were defined and measured accordingly. Results of PBS-treated animals (control) and AMG 386 and aflibercept (A + A) treated animals are depicted. Statistical analysis was performed by Student`s t-test. (C) Quantification of cancer cell extravasation in vibratome sections of PBS (control) and A + A treated animals are shown after 24 and 72 hours p.i.. The combination of the 24h and 72h p.i. experiments are shown in the upper right panel (purple: extravasation; green: no extravasation, P-value of likelihood ratio chi-square test is shown) (D) Experimental design of anti-Ang-2/anti-VEGF treatment in mice with intracardiac injection of H1_DL2 or JIMT-1 cells. (E-H) Assessment of melanoma (E, G) and breast carcinoma brain metastatic load (F, H) by MRI in week 4 after commencement of anti-angiogenic therapies in mice, including the total number of tumors and total/average tumor volumes in animals treated with AMG 386, aflibercept, or AMG 386 plus aflibercept compared to PBS treated controls. Immunostainings of coronal tissue sections for HMB45 (E) and EpCAM (F) visualize cerebral spread of H1_DL2 melanoma and JIMT-1 breast carcinoma metastases 5 weeks after initiation of anti-angiogenic therapies (trial endpoint). * P < .05, ** P < .01, *** P < .001, P < .0001 and ns P > .05 by 2-tailed, unpaired t-test.
Figure 5.
Figure 5.
(A) Immunostainings demonstrate Ang-2 expression in CD31-positive brain microvessels exploited by panCK-positive metastasizing cancer cells in the human brain pre-metastatic niche (scale bar 50 µm). (B) Ratio of Ang-2/CD31 expression in tumor vessels in human brain metastases (BM) of different types of metastatic cancers (n = 191 patients Ang-2 data, one patient missing CD31 data). (C) Association of Ang-2/CD31 ratio and BM size. (D) Association of Ang-2/CD31 ratio and number of BM. (E) Kaplan–Meier survival curves of patients with low or high ratios of Ang-2/CD31 expression (median split) in metastatic brain lesions. Results of Log-rank test are shown. (F) Kaplan–Meier survival curves of combined Ki67 dichotomization (median split) and Ang-2/CD31 ratio dichotomization (median split) showing four groups illustrating low/low, high/high, high/low, and low/high expressors (total n = 189 due to single patients with missing data for CD31 and Ki67). Hierarchical cluster analyses of tumor area, positively labeled with antibodies against collagen I, CD31, and Ang-2. Kaplan–Meier survival curve of patients belonging to different stromal vascular clusters (H). Survival from date of BM surgery until last contact (H) are depicted. Throughout the figure, the numbers of the samples tested are indicated in parentheses. These vary due to partly missing clinical or experimental data.
Figure 6.
Figure 6.
Schematic summary illustrating the microenvironmental effects of (A) cancer cells occluding brain blood vessels and (B) early anti-Ang-2/anti-VEGF treatment on brain metastatic (BM) tumor load.

Comment in

References

    1. Valiente M, Ahluwalia MS, Boire A, et al. The evolving landscape of brain metastasis. Trends Cancer. 2018;4(3):176–196. - PMC - PubMed
    1. Nayak L, Lee EQ, Wen PY.. Epidemiology of brain metastases. Curr Oncol Rep. 2012;14(1):48–54. - PubMed
    1. Achrol AS, Rennert RC, Anders C, et al. Brain metastases. Nat Rev Dis Prim. 2019;5(1):5. - PubMed
    1. Winkler F. The brain metastatic niche. J Molecular Med. 2015;93(11):1213–1220. - PubMed
    1. Avraham HK, Jiang S, Fu Y, et al. Angiopoietin-2 mediates blood-brain barrier impairment and colonization of triple-negative breast cancer cells in brain. J Pathol. 2014;232(3):369–381. - PubMed

Substances