. 2024 May 20:18:1386801.
doi: 10.3389/fnins.2024.1386801. eCollection 2024.

Rapidly repeated visual stimulation induces long-term potentiation of VEPs and increased content of membrane AMPA and NMDA receptors in the V1 cortex of cats

Affiliations

Rapidly repeated visual stimulation induces long-term potentiation of VEPs and increased content of membrane AMPA and NMDA receptors in the V1 cortex of cats

Shunshun Chen et al. Front Neurosci. .

Abstract

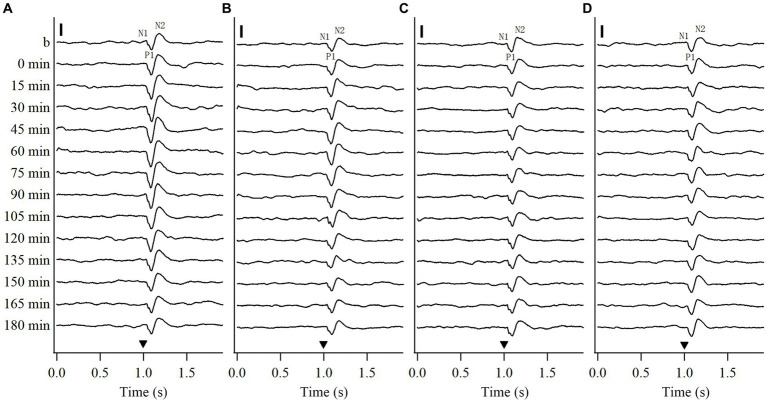
Studies report that rapidly repeated sensory stimulation can evoke LTP-like improvement of neural response in the sensory cortex. Whether this neural response potentiation is similar to the classic LTP induced by presynaptic electrical stimulation remains unclear. This study examined the effects of repeated high-frequency (9 Hz) versus low-frequency (1 Hz) visual stimulation on visually-evoked field potentials (VEPs) and the membrane protein content of AMPA / NMDA receptors in the primary visual cortex (V1) of cats. The results showed that repeated high-frequency visual stimulation (HFS) caused a long-term improvement in peak-to-peak amplitude of V1-cortical VEPs in response to visual stimuli at HFS-stimulated orientation (SO: 90°) and non-stimulated orientation (NSO: 180°), but the effect exhibited variations depending on stimulus orientation: the amplitude increase of VEPs in response to visual stimuli at SO was larger, reached a maximum earlier and lasted longer than at NSO. By contrast, repeated low-frequency visual stimulation (LFS) had not significantly affected the amplitude of V1-cortical VEPs in response to visual stimuli at both SO and NSO. Furthermore, the membrane protein content of the key subunit GluA1 of AMPA receptors and main subunit NR1 of AMPA receptors in V1 cortex was significantly increased after HFS but not LFS when compared with that of control cats. Taken together, these results indicate that HFS can induce LTP-like improvement of VEPs and an increase in membrane protein of AMPA and NMDA receptors in the V1 cortex of cats, which is similar to but less specific to stimulus orientation than the classic LTP.

Keywords: AMPA and NMDA receptors; cat; long-term potentiation; primary visual cortex; repeated high-frequency visual stimulation; visually-evoked field potentials.


Conflict of interest statement

The authors declare that the research was conducted in the absence of any commercial or financial relationships that could be construed as a potential conflict of interest.

Figures

Figure 1
Figure 1
Voltage trace samples showing VEPs of V1 cortex in response to test visual stimuli with stimulated orientation (SO: 90°) and non-stimulated orientation (NSO: 180°) before and at different time point after the end of repeated HFS (A, B) or LFS (C, D). The horizontal axis in (A–D) shows the recording time (s): the filled triangle denotes the onset of test visual stimuli with orientation at SO (A,C) or NSO (B,D), spatial frequency 0.2 cpd, temporal frequency 0.5 Hz and contrast 100%. The baseline field potential is acquired during 1 s before onset of test visual stimuli. The vertical axis displays the recording time points, including before and at 0, 15, 30, 45, 60, 75, 90, 105, 120, 135, 150, 165, and 180 min after the end of HFS or LFS. The VEP contains three main components of wave N1, P1 and N2. The vertical scale bar represents 100 μv.
Figure 2
Figure 2
Showing alterations in peak-to-peak amplitude N1P1 and P1N2 of VEPs at V1 cortex of 4 cats (Cat1-4) in response to test visual stimuli with stimulated orientation (SO: 90°) and non-stimulated orientation (NSO: 180°) before (b1, b2) and at different time point (0–180 min, with an interval of 15 min) after the end of repeated HFS. The red filled circle with an error bar represents the mean VEP amplitude of N1P1 and P1N2 with standard deviation (SD), and the open black circles represent individual data of N1P1 and P1N2 value from 6 repeated experiments. Each individual data of VEP amplitude is measured across 18 trials (3 iteration with 6 trials per iteration) of test visual stimuli before and at different time point after HFS.
Figure 3
Figure 3
Whisker diagrams showing the mean value across 4 cats for normalized N1P1 (A) and P1N2 (B) of VEPs in response to visual stimuli with SO (90°) against that with NSO (180°) before and at different time point after the end of HFS. The box plots show the median (middle line within box), 25–75th percentiles (top and lower box edge), minimum and maximum values (whiskers).
Figure 4
Figure 4
Showing changes in peak-to-peak amplitude N1P1 and P1N2 of VEPs at V1 cortex of 4 cats (Cat1-4) in response to test visual stimuli with stimulated orientation (SO: 90°) and non-stimulated orientation (NSO: 180°) before (b1, b2) and at different time point (0–180 min, with an interval of 15 min) after the end of repeated LFS. The red filled circle with an error bar represents the mean VEP amplitude of N1P1 and P1N2 with standard deviation (SD), and the open black circles represent individual data of N1P1 and P1N2 value from 6 repeated experiments. Each individual data of VEP amplitude is measured across 18 trials (3 iteration with 6 trials per iteration) of test visual stimuli before and at different time point after LFS.
Figure 5
Figure 5
Showing the mean optical density (OD) of Western blot bands of NR1 (the main subunit of NMDA receptors) (A) and GluA1 (the key subunit of AMPA receptors) (B) normalized against that of β-Tubulin (internal reference) in the V1 cortex after repeated HFS or LFS relative to controls (CTL). The histogram with an error bar represents the mean normalized OD value and SD, and the solid dots on each histogram represent individual data measured from 6 cats. The sample of Western blotting bands of NR1 and GluA1 (upper panel) as well as β-Tubulin (lower panel) are shown on the top of the histogram in (A,B). ***p < 0.0001, **p < 0.001, ns denotes p > 0.05.

Similar articles

Cited by

References

    1. Aberg K. C., Herzog M. H. (2012). About similar characteristics of visual perceptual learning and LTP. Vis. Res. 61, 100–106. doi: 10.1016/j.visres.2011.12.013, PMID: - DOI - PubMed
    1. Agboada D., Mosayebi-Samani M., Kuo M. F., Nitsche M. A. (2020). Induction of long-term potentiation-like plasticity in the primary motor cortex with repeated anodal transcranial direct current stimulation - better effects with intensified protocols? Brain Stimul. 13, 987–997. doi: 10.1016/j.brs.2020.04.009, PMID: - DOI - PubMed
    1. Astorga G., Chen M., Yan Y., Altavini T. S., Jiang C. S., Li W., et al. . (2022). Adaptive processing and perceptual learning in visual cortical areas V1 and V4. Proc. Natl. Acad. Sci. U. S. A. 119:e2213080119. doi: 10.1073/pnas.2213080119, PMID: - DOI - PMC - PubMed
    1. Aydin-Abidin S., Moliadze V., Eysel U. T., Funke K. (2006). Effects of repetitive TMS on visually evoked potentials and EEG in the anaesthetized cat: dependence on stimulus frequency and train duration. J. Physiol. 574, 443–455. doi: 10.1113/jphysiol.2006.108464, PMID: - DOI - PMC - PubMed
    1. Bear M. F., Press W. A., Connors B. W. (1992). Long-term potentiation in slices of kitten visual cortex and the effects of NMDA receptor blockade. J. Neurophysiol. 67, 841–851. doi: 10.1152/jn.1992.67.4.841, PMID: - DOI - PubMed