. 2024 May 8;27(6):109915.
doi: 10.1016/j.isci.2024.109915. eCollection 2024 Jun 21.

Red blood cell flickering activity locally controlled by holographic optical tweezers

Affiliations

Red blood cell flickering activity locally controlled by holographic optical tweezers

Niccolò Caselli et al. iScience. .

Abstract

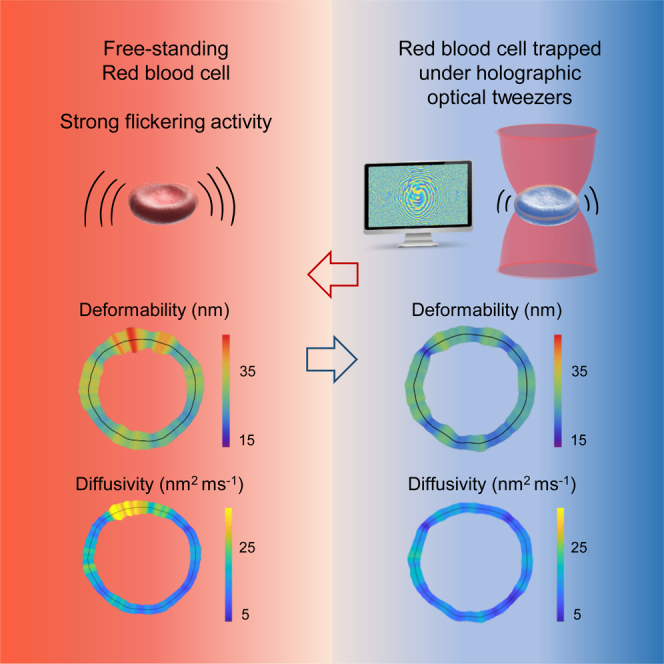
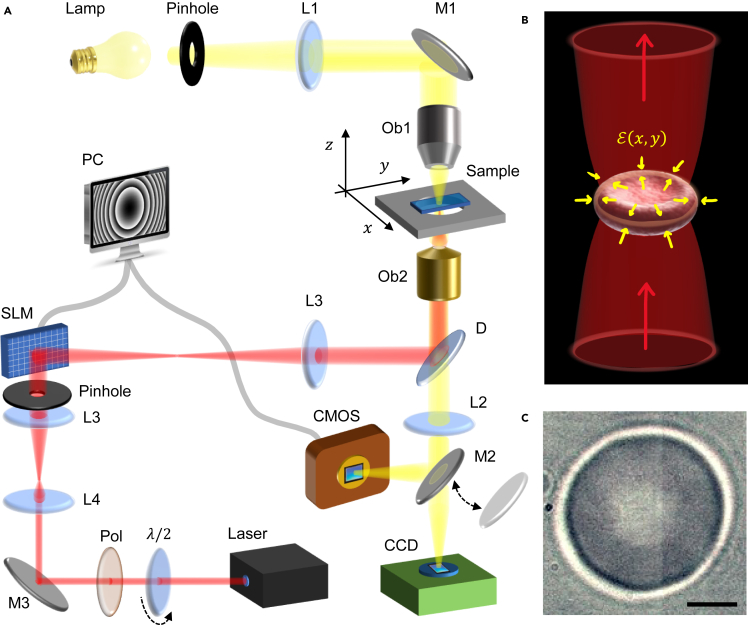
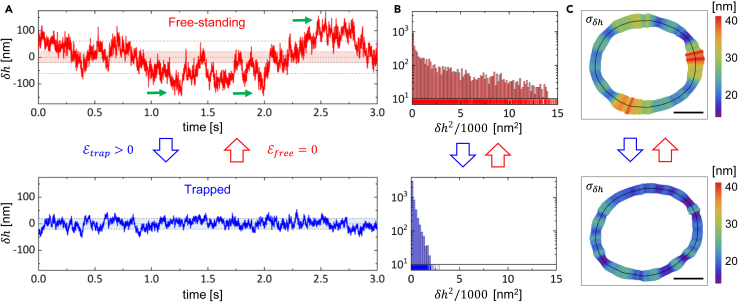
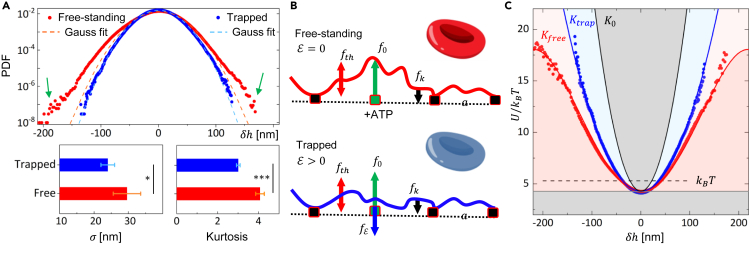
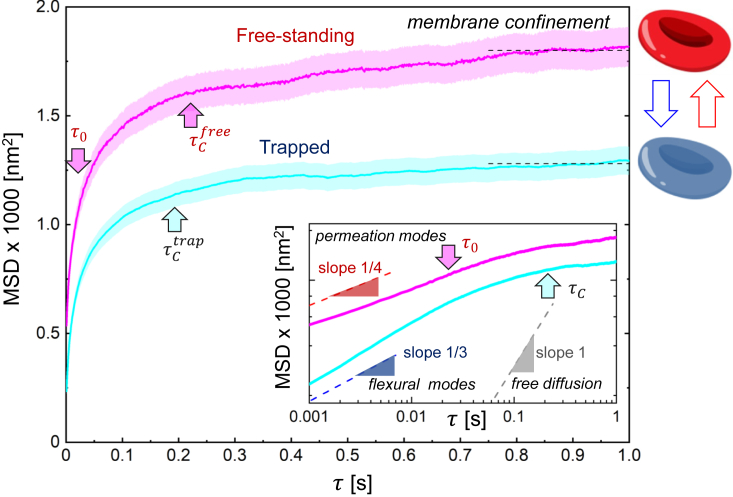
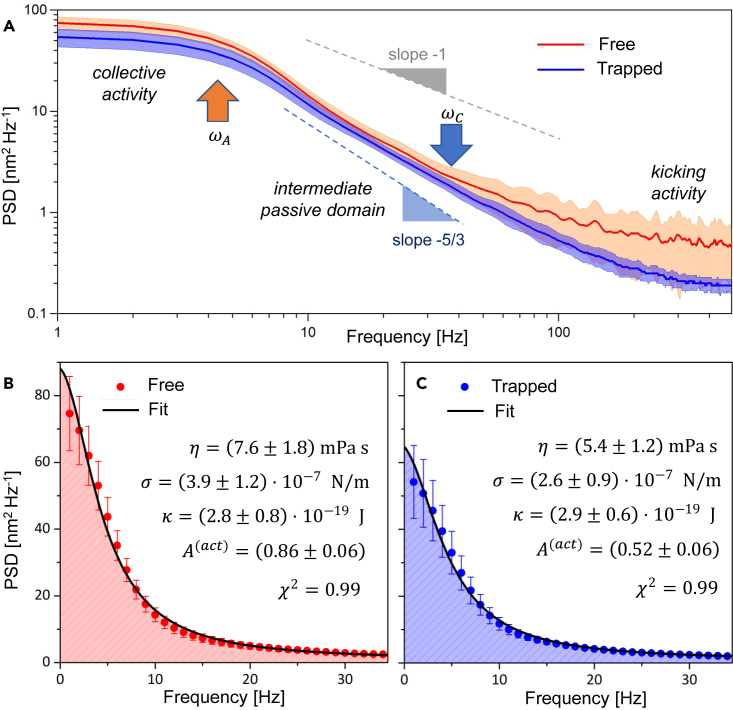
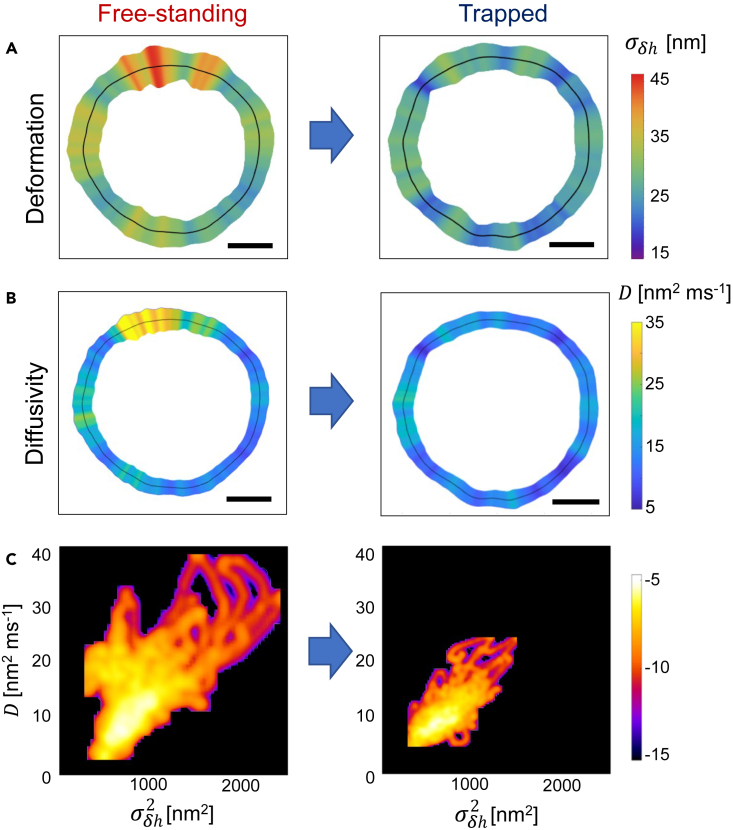
Red blood cells possess a singular mechanobiology, enabling efficient navigation through capillaries smaller than their own size. Their plasma membrane exhibits non-equilibrium shape fluctuation, often reported as enhanced flickering activity. Such active membrane motion is propelled by motor proteins that mediate interactions between the spectrin skeleton and the lipid bilayer. However, modulating the flickering in living red blood cells without permanently altering their mechanical properties represents a significant challenge. In this study, we developed holographic optical tweezers to generate a force field distributed along the equatorial membrane contour of individual red blood cells. In free-standing red blood cells, we observed heterogeneous flickering activity, attributed to localized membrane kickers. By employing holographic optical forces, these active kickers can be selectively halted under minimal invasion. Our findings shed light on the dynamics of membrane flickering and established a manipulation tool that could open new avenues for investigating mechanotransduction processes in living cells.

Keywords: Natural sciences; Optical imaging.


Conflict of interest statement

The authors declare no competing interest.

Figures

None
Graphical abstract
Figure 1
Figure 1
Holographic optical tweezers (A) Schematics of the HOTs coupled to an inverted microscope. SLM is the spatial light modulator, Mi mirrors, Li lenses, λ/2 half-wave plate, Pol linear polarizer, D dichroic mirror, Ob1 condenser objective, Ob2 imaging objective, that also focuses the laser beam on the sample plane (x,y). (B) Schematics of single erythrocyte trapped by a laser hologram that reproduces the membrane contour. E(x,y) is the trapping potential. Red arrows indicate the laser propagation, yellow arrows represent the direction of in plane optical forces. (C) Image of an RBC in the equatorial plane without laser trapping. The membrane contour is retrieved as the high-contrast border between inner (black) and outer (white) circles (see STAR Methods). Scale bar is 2μm.
Figure 2
Figure 2
Flickering maps (A) Time series membrane deformations, δh(t), tracked at a hot spot of a free-standing RBC (red line), and at a cold spot of the same specimen under optically trapping (blue line). The colored bands represent the standard deviation, σδh, of free-standing time series. Green arrows indicate kicking events, with amplitude Δ0, exceeding 3σδh (dashed lines). (B) Distribution of events for the time series reported in a). (C) Map showing the time averaged flickering activity along the cell contour, estimated as σδh(θ), for the free-standing (top) and trapped RBC (bottom). Black lines represent the mean position of the membrane observed in the equatorial plane. Scale bar is 2μm.
Figure 3
Figure 3
Population energy landscape (A) Normalized probability density functions (PDFs) for free-standing (red dots) and trapped RBC population (blue dots). Dashed lines are Gaussian fits. Green arrows highlight non-Gaussian tails in free-standing RBCs. Lower panels show ensemble averaged flickering standard deviation (σ) and kurtosis, with error bars reported as standard deviations. p<0.05, p<0.001. (B) Schematics of flickering membrane deformations for free-standing (top panel) and trapped cell (bottom panel). f0 is the local force exerted by active kickers upon ATP consumption; fth is the force induced by thermal fluctuations; fk is the restoring force due to membrane elasticity, fE is the optical trapping force. (C) Potential energy landscape in free-standing (red) and trapped (blue) RBCs. Raw data are reproduced by Equation 1 with Kfree and Ktrap, respectively (straight lines). K0 is the rigidity of passivated RBCs. Gray areas indicate exclusion regions where the flickering is absent. Dashed line corresponds to the thermal driving energy kBT.
Figure 4
Figure 4
Mean square displacement (MSD) MSD averaged over all membrane positions and RBC ensemble as a function of lag time τ for the free (purple line) and trapped (light blue line) RBCs, along with corresponding 90% variability bands. The microscopic time τ020ms (threshold for instantaneous flickering events) and τC0.2s (viscoelastic correlation time) are highlighted by arrows. The inset shows the Log-Log plot compared with the characteristic slope decay for free diffusion (α=1, gray line), membrane flexural modes (α=1/3, blue line) and membrane permeation modes (α=1/4, red line).
Figure 5
Figure 5
Power spectral density (PSD) (A) Ensemble-averaged PSDs for both free-standing (red line) and trapped population (blue line), reported in Log-Log scale. Shaded areas represent the 90% variability intervals. Dashed lines decay as ω1 (pink noise spectrum), and as ω5/3 (Brownian spectrum). Arrows highlight the active frequency ωA, and the rheological crossover frequency ωC. (B and C) PSD in the low frequency regime, depicted in linear scale, for free-standing (red dots) and trapped RBCs (blue dots). Error bars correspond to standard deviations. Black lines represent the fits obtained by using Equation 2, and the dashed regions correspond to the integrated power. The best fitting parameters are reported for each case.
Figure 6
Figure 6
Diffusivity maps (A and B) Maps of flickering deformation, σδh, and effective diffusivity, D, evaluated for the same free-standing (left panels) and trapped RBC (right panels). Black lines represent the mean position of the membrane. Scale bar is 2 μm. (C) Density of states of flickering events in the space given by (D,σδh2) reported as the logarithm of the number of events for free-standing (left panel) and trapped RBC populations (right panel).

Similar articles

Cited by

References

    1. Romani P., Valcarcel-Jimenez L., Frezza C., Dupont S. Crosstalk between mechanotransduction and metabolism. Nat. Rev. Mol. Cell Biol. 2021;22:22–38. doi: 10.1038/s41580-020-00306-w. - DOI - PubMed
    1. Wu P.-H., Aroush D.R.-B., Asnacios A., Chen W.-C., Dokukin M.E., Doss B.L., Durand-Smet P., Ekpenyong A., Guck J., Guz N.V., et al. A comparison of methods to assess cell mechanical properties. Nat. Methods. 2018;15:491–498. doi: 10.1038/s41592-018-0015-1. - DOI - PMC - PubMed
    1. Lugagne J.-B., Dunlop M.J. Cell-machine interfaces for characterizing gene regulatory network dynamics. Curr. Opin. Syst. Biol. 2019;14:1–8. doi: 10.1016/j.coisb.2019.01.001. - DOI - PMC - PubMed
    1. Nelson B.J., Kaliakatsos I.K., Abbott J.J. Microrobots for Minimally Invasive Medicine. Annu. Rev. Biomed. Eng. 2010;12:55–85. doi: 10.1146/annurev-bioeng-010510-103409. - DOI - PubMed
    1. Orapiriyakul W., Tsimbouri M.P., Childs P., Campsie P., Wells J., Fernandez-Yague M.A., Burgess K., Tanner K.E., Tassieri M., Meek D., et al. Nanovibrational Stimulation of Mesenchymal Stem Cells Induces Therapeutic Reactive Oxygen Species and Inflammation for Three-Dimensional Bone Tissue Engineering. ACS Nano. 2020;14:10027–10044. doi: 10.1021/acsnano.0c03130. - DOI - PMC - PubMed

LinkOut - more resources