. 2024 Apr 26;27(6):109810.
doi: 10.1016/j.isci.2024.109810. eCollection 2024 Jun 21.

Atg45 is an autophagy receptor for glycogen, a non-preferred cargo of bulk autophagy in yeast

Affiliations

Atg45 is an autophagy receptor for glycogen, a non-preferred cargo of bulk autophagy in yeast

Takahiro Isoda et al. iScience. .

Abstract

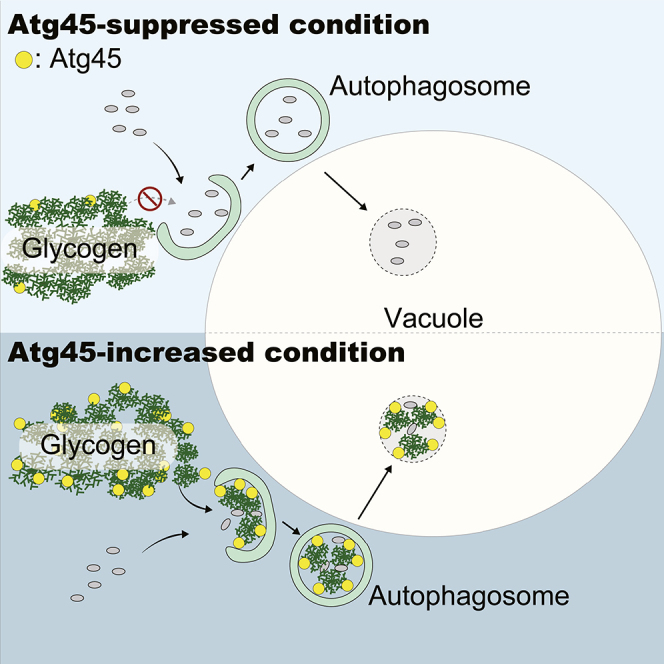
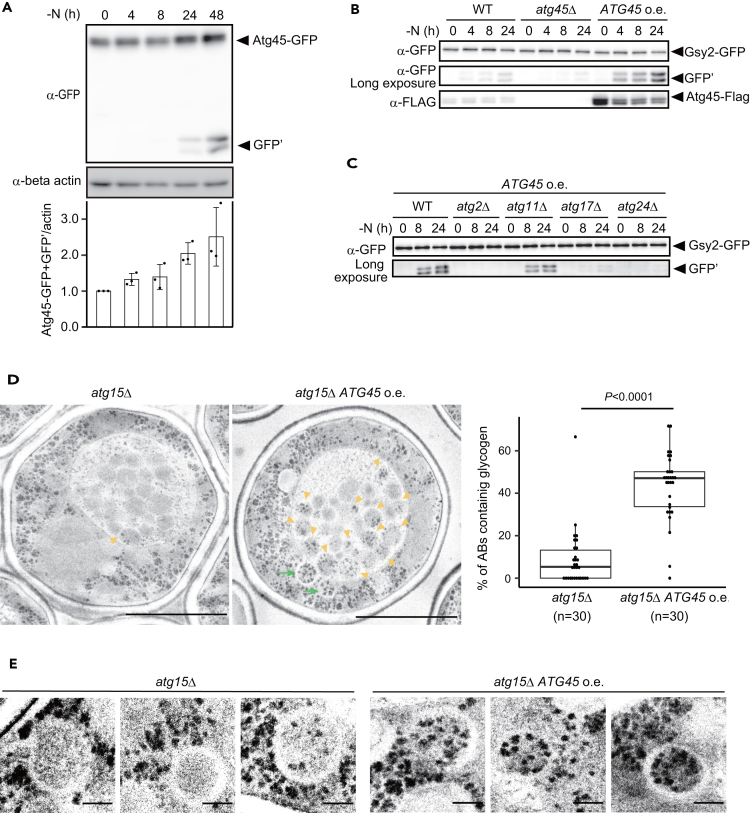
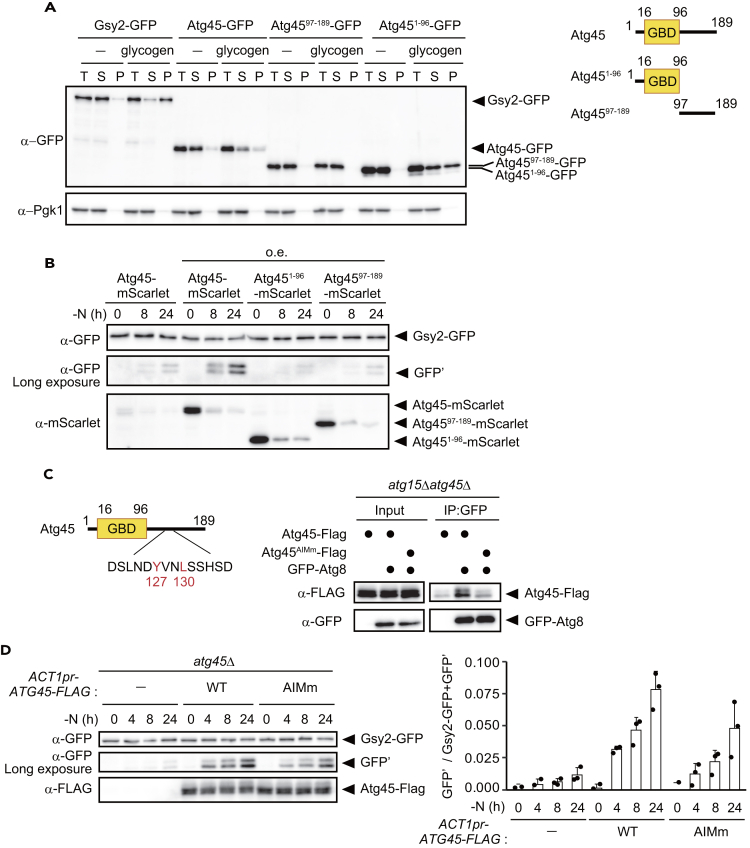
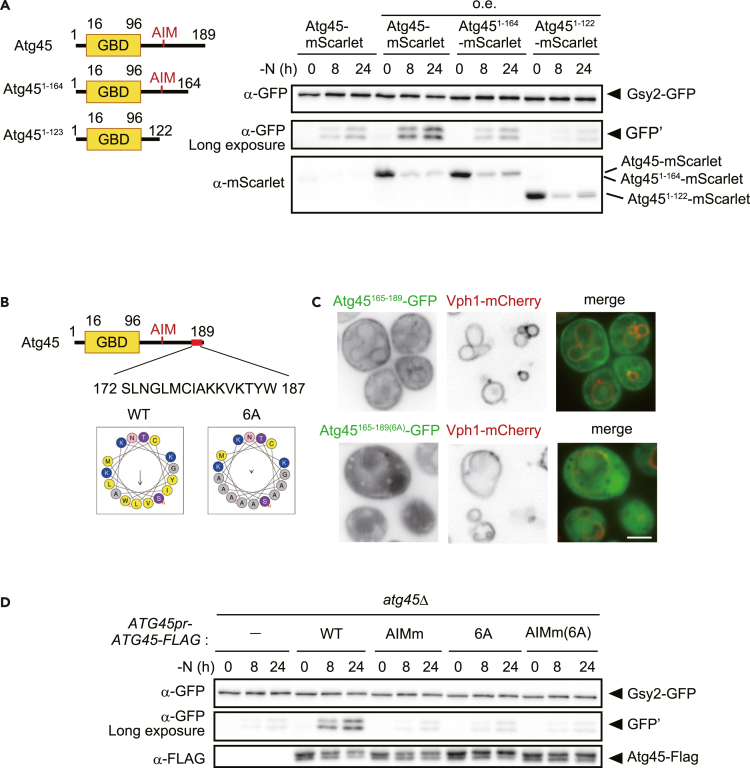
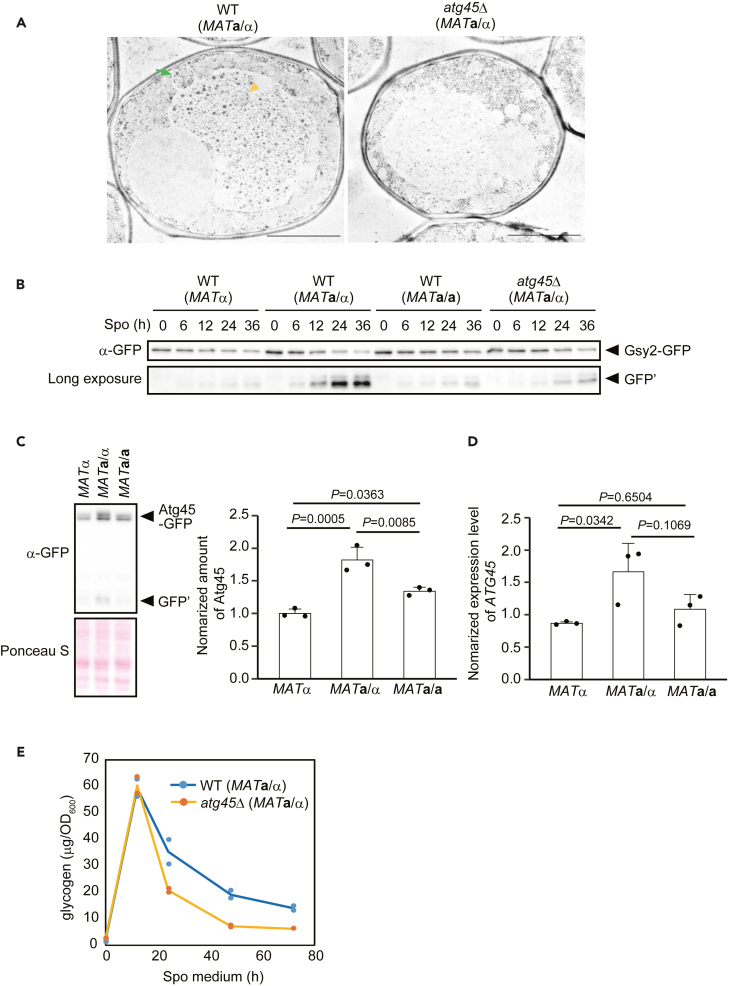
The mechanisms governing autophagy of proteins and organelles have been well studied, but how other cytoplasmic components such as RNA and polysaccharides are degraded remains largely unknown. In this study, we examine autophagy of glycogen, a storage form of glucose. We find that cells accumulate glycogen in the cytoplasm during nitrogen starvation and that this carbohydrate is rarely observed within autophagosomes and autophagic bodies. However, sequestration of glycogen by autophagy is observed following prolonged nitrogen starvation. We identify a yet-uncharacterized open reading frame, Yil024c (herein Atg45), as encoding a cytosolic receptor protein that mediates autophagy of glycogen (glycophagy). Furthermore, we show that, during sporulation, Atg45 is highly expressed and is associated with an increase in glycophagy. Our results suggest that cells regulate glycophagic activity by controlling the expression level of Atg45.

Keywords: Biomolecules; Cell biology; Glycobiology; Model organism.


Conflict of interest statement

The authors declare no competing interests.

Figures

None
Graphical abstract
Figure 1
Figure 1
Glycogen and glycogen metabolism-related enzymes are non-preferred cargoes of nitrogen starvation-induced autophagy (A) GFP-cleavage assay of Pgk1, Gsy2, Glc2, Gph1, and Trp4 in SD-N medium (upper). Quantified band intensities are indicated (lower). Error bars represent SD (n = 3). (B) Schematic illustration of roles of Gsy2, Gph1, and Glc3 in glycogen metabolism. (C) Assessment of Gsy2-GFP binding to glycogen by sedimentation assay. T: Total lysate, S: Supernatant, P: Pellet. Pgk1 was used as a representative cytosolic protein. (D) GFP-cleavage assay of Pgk1, Gsy2, Glc2, Gph1, and Trp4 in WT cells and glg1Δglg2Δ cells (upper). Quantified band intensities are indicated (lower). Error bars represent SD (n = 3). (E) Electron micrographs of PATAg-stained atg15Δ cells and glg1Δglg2Δatg15Δ cells after 6 h of nitrogen starvation. The diameters of each PATAg-stained structure were roughly estimated as follows: 1: 200 nm, 2: 70 nm, and 3: 40 nm. Bar: 2 μm. See also Figure S1.
Figure 2
Figure 2
Gsy2 is degraded by autophagy after prolonged nitrogen starvation (A) GFP-cleavage assay of Gsy2 and Pgk1 in WT cells cultured in SD-N medium. (B) Electron micrographs of PATAg-stained atg15Δ cells after 6, 24, or 48 h of nitrogen starvation. Yellow arrowheads, autophagic bodies containing glycogen. Green arrows, autophagosomes containing glycogen. Scale bar: 2 μm. (C) Percentages of individual autophagic bodies containing glycogen per cell (related to Figure 2B) are indicated as boxplots (n = 20, 32, or 52). Significance is calculated by the Steel test. (D) GFP-cleavage assay of Gsy2 in WT, atg2Δ, atg11Δ, atg17Δ, or atg24Δ cells after 48 h of nitrogen starvation (upper). In quantification results (lower), the values of WT cells were set to 1.0. Error bars represent SD (n = 3). (E) GFP-cleavage assay of Pgk1 in WT, atg2Δ, atg11Δ, atg17Δ, or atg24Δ cells after 48 h of nitrogen starvation (upper). For quantification (lower), all values are shown relative to WT as 1.0. Error bars represent SD (n = 3).
Figure 3
Figure 3
Glycophagy occurs in an Atg45-dependent manner upon prolonged nitrogen starvation (A) An overview of proteins containing a putative glycogen-binding domain (GBD) (Pfam: PF16561). (B) Localization of Crp1, Yil024c (Atg45), or Mdg1-GFP with Gsy2-mScarlet in cells after 2 h of nitrogen starvation. Arrowheads indicate Crp1 or Atg45 co-localization with Gsy2. Scale bar, 2 μm. The localizations of Sip1, Sip2, or Gal83-GFP with Gsy2-mScarlet are shown in Figure S2A. (C) GFP-cleavage assay of Gsy2 in WT, atg45Δ, crp1Δ, mdg1Δ, or crp1Δmdg1Δ cells after 48 h of nitrogen starvation (upper) and quantification of band intensities (lower). Ponceau S staining was used to determine total protein loading in each lane. For quantification, the value for WT was set to 1.0. Error bars represent SD (n = 3). One-way ANOVA with Dunnett’s test was used to assess statistically significant differences. p values indicated in the figure. (D) GFP-cleavage assay of Gsy2 in WT, atg45Δ, glg1Δglg2Δ, or glg1Δglg2Δatg45Δ cells subjected to 48 h nitrogen starvation (upper). Ponceau S staining was used to determine total protein loading in each lane. For quantification (lower), the values for WT or glg1Δglg2Δ were set to 1.0. Error bars represent SD (n = 3). Welch’s t test was used to assess statistically significant differences. See also Figure S2.
Figure 4
Figure 4
Increased expression of Atg45 facilitates glycophagy (A) Assessment of Atg45-GFP protein levels in WT cells cultured in SD-N medium by western blotting. β-actin was used as a loading control. For band intensity quantifications (lower panel), data were normalized to 1.0 using 0 h samples. (B) GFP-cleavage assay of Gsy2 in cells overexpressing Atg45 (ACT1pr), atg45Δ, or WT cells. Cells cultured in SD-N medium. (C) GFP-cleavage assay of Gsy2 in WT, atg2Δ, atg11Δ, atg17Δ, or atg24Δ cells, all overexpressing Atg45 (ACT1pr). Cells cultured in SD-N medium. (D) Electron micrographs of PATAg-stained atg15Δ and Atg45-overexpressing (ACT1pr) atg15Δ cells after 6 h of nitrogen starvation (left). Yellow arrowheads, autophagic bodies containing glycogen. Green arrows, autophagosomes containing glycogen. Scale bar: 2 μm. Percentages of individual autophagic bodies containing glycogen per cell are indicated as boxplots at right (n = 30). The Wilcoxon rank-sum test was used to assess statistically significant differences. (E) Autophagosomes in cells under same conditions as D. Bars: 0.2 μm. See also Figure S3.
Figure 5
Figure 5
Atg45 is a glycophagy receptor (A) Assessment of the binding ability of Gsy2, Atg45, Atg4597−189, and Atg451−96-GFP to glycogen by sedimentation assay (left). Atg45 and its variants were expressed under the control of the ACT1 promoter. An overview of Atg45 and assessed deletion mutants is shown at right. T: Total lysate, S: Supernatant, P: Pellet. Pgk1 was used as a representative cytosolic protein. (B) GFP-cleavage assay of Gsy2 in SD-N cultured cells expressing Atg45, Atg451−96, or Atg4597−189-mScarlet under the control of the ATG45 or ACT1 promoters. Expression levels of mScarlet-tagged proteins were also assessed by western blotting (bottom panel). (C) Overview of the candidate AIM amino acid sequence within Atg45 (left). The interaction of GFP-Atg8 with Atg45 or Atg45AIMm-FLAG was assessed by co-immunoprecipitation of GFP-Atg8 (right). Atg45 and Atg45AIMm were expressed under the control of the ACT1 promoter. (D) GFP-cleavage assay of Gsy2 in atg45Δ cells harboring an empty vector or vector-borne Atg45-FLAG and Atg45AIMm-FLAG under the control of the ACT1 promoter. Cells were cultured in SD-N medium for indicated time periods. The expression levels of FLAG-tagged proteins were also assessed by western blotting. Quantification results are shown at right. Error bars represent SD (n = 3). See also Figures S4 and S5.
Figure 6
Figure 6
The C-terminal membrane-binding region of Atg45 is important for glycophagy (A) Schematic of Atg45 and assessed truncation mutants (left). Gsy2-GFP-cleavage in cells cultured in SD-N medium (right). Atg45 and its variants were expressed under the control of the ACT1 promoter. The expression levels of mScarlet-tagged proteins were also determined by western blotting. (B) Overview of the predicted sequence of the C-terminal putative helix of Atg45 (JPred 4) (upper). The helical wheel of the putative helix predicted by HeliQuest (lower). (C) Localization of Atg45165−189-GFP and Atg45165−189(6A) -GFP expressed under the control of the ACT1 promoter in cells after 2 h of nitrogen starvation. Scale bar, 2 μm. (D) GFP-cleavage assay of Gsy2 performed in indicated strains cultured in SD-N media. The expression levels of FLAG-tagged proteins were also assessed by western blotting. See also Figure S6.
Figure 7
Figure 7
Glycophagy is strongly induced during sporulation (A) Electron micrographs of PATAg-stained WT (MATa/α) and atg45Δ (MATa/α) cells cultured for 12 h in sporulation medium. Yellow arrowhead, autophagic body containing glycogen. Green arrow, autophagosome containing glycogen. Scale bar: 2 μm. (B) GFP-cleavage assay of Gsy2 in WT (MATα), WT (MATa/α), WT (MATa/a), and atg45Δ (MATa/α) cells cultured in sporulation medium. See also Figure S7C. (C) Assessment of Atg45-GFP protein levels in MATα, MATa/α, or MATa/a cells cultured for 12 h in sporulation medium by western blotting (left). Ponceau S staining was used to determine total protein loading in each lane. For quantification (right), the values of MATα were set to 1.0. Error bars represent SD (n = 3). One-way ANOVA with Tukey’s multiple comparisons test was used to assess statistically significant differences. p values indicated in the figure. (D) Expression of ATG45 mRNA in MATα, MATa/α, or MATa/a cells cultured for 12 h in sporulation medium. Error bars represent SD (n = 3). One-way ANOVA with Tukey’s multiple comparisons test was used to assess statistically significant differences. p values indicated in the figure. (E) Quantification of glycogen in lysates of WT (MATa/α) and atg45Δ (MATa/α) cells, cultured in sporulation medium. The amounts of glycogen (μg) per 1 OD600 unit are shown (n = 2). See also Figure S7.

Similar articles

Cited by

References

    1. Epple U.D., Eskelinen E.-L., Thumm M. Intravacuolar membrane lysis in Saccharomyces cerevisiae. Does vacuolar targeting of Cvt17/Aut5p affect its function? J. Biol. Chem. 2003;278:7810–7821. doi: 10.1074/jbc.M209309200. - DOI - PubMed
    1. Epple U.D., Suriapranata I., Eskelinen E.L., Thumm M. Aut5/Cvt17p, a putative lipase essential for disintegration of autophagic bodies inside the vacuole. J. Bacteriol. 2001;183:5942–5955. doi: 10.1128/JB.183.20.5942-5955.2001. - DOI - PMC - PubMed
    1. Teter S.A., Eggerton K.P., Scott S.V., Kim J., Fischer A.M., Klionsky D.J. Degradation of lipid vesicles in the yeast vacuole requires function of Cvt17, a putative lipase. J. Biol. Chem. 2001;276:2083–2087. doi: 10.1074/jbc.C000739200. - DOI - PMC - PubMed
    1. Ramya V., Rajasekharan R. ATG15 encodes a phospholipase and is transcriptionally regulated by YAP1 in Saccharomyces cerevisiae. FEBS Lett. 2016;590:3155–3167. doi: 10.1002/1873-3468.12369. - DOI - PubMed
    1. Takeshige K., Baba M., Tsuboi S., Noda T., Ohsumi Y. Autophagy in yeast demonstrated with proteinase-deficient mutants and conditions for its induction. J. Cell Biol. 1992;119:301–311. doi: 10.1083/jcb.119.2.301. - DOI - PMC - PubMed

LinkOut - more resources