

Prickly ash seeds can promote healthy production of sheep by regulating the rumen microbial community
- PMID: 38832114
- PMCID: PMC11144891
- DOI: 10.3389/fmicb.2024.1364517
Prickly ash seeds can promote healthy production of sheep by regulating the rumen microbial community
Abstract
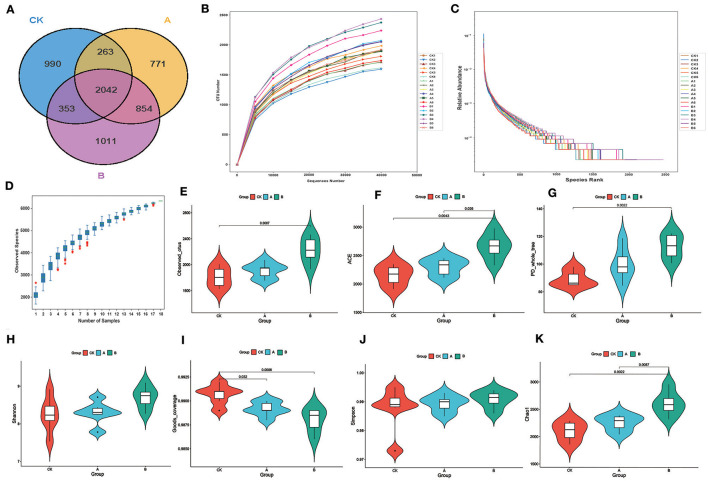
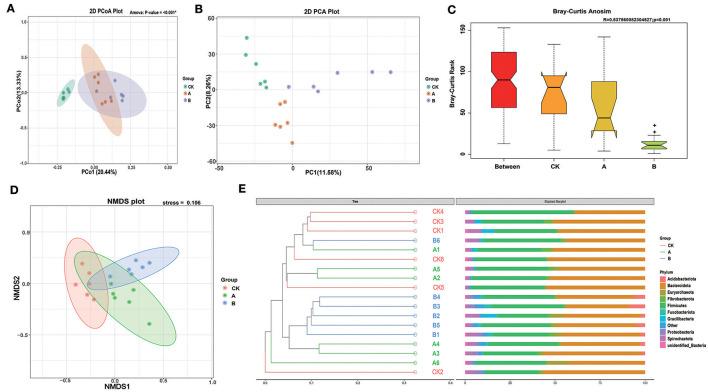
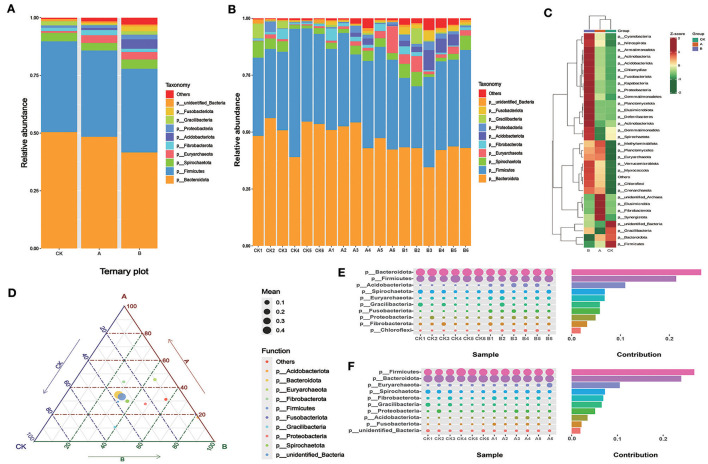
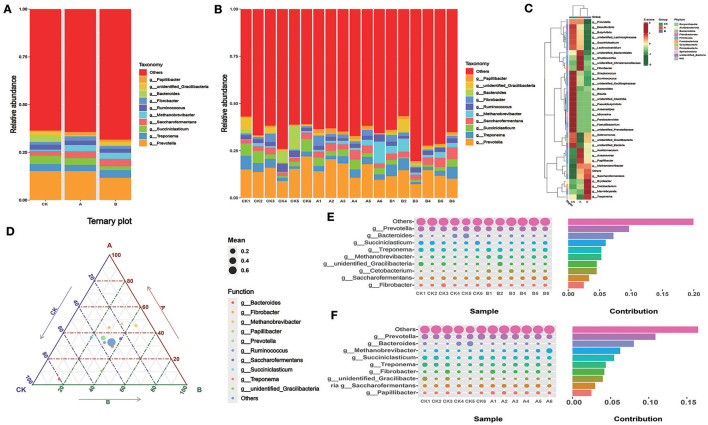
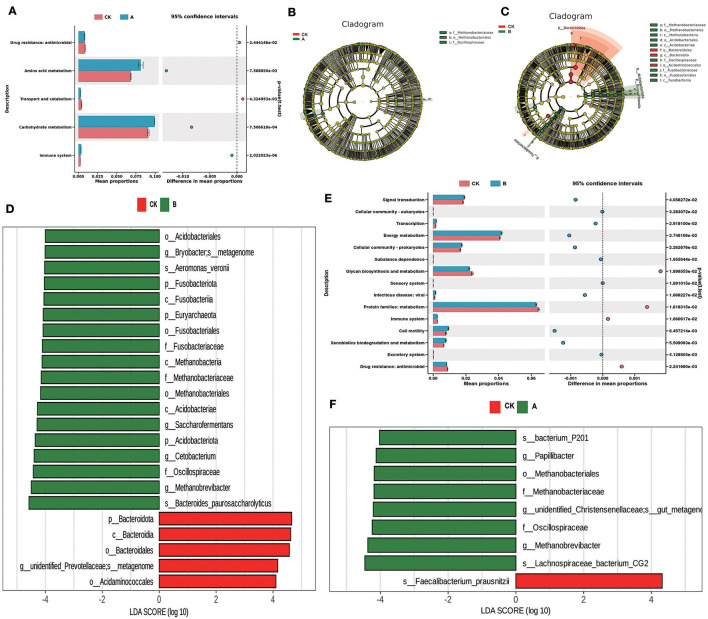
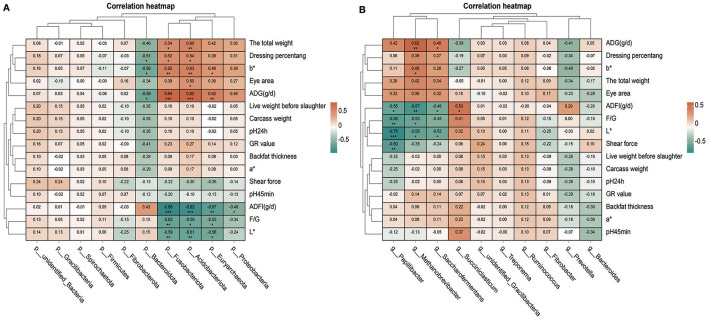
This study aimed to investigate the effect of prickly ash seeds (PAS) on the microbial community found in rumen microbes of Hu sheep by adding different percentages of prickly ash seeds and to carry out research on the relation between rumen flora and production performance. Twenty-seven male lambs of Hu sheep were classified into three groups based on the content of prickly ash seeds (PAS) fed for 90 days, i.e., 0%, 3%, and 6%. At the end of the feeding trial, rumen fluid samples were collected from six sheep in each group for 16S amplicon sequencing. The results showed that the addition of prickly ash seeds significantly increased both Chao1 and ACE indices (P < 0.05), and the differences between groups were greater than those within groups. The relative content of Bacteriodota decreased, and the relative content of Fusobacteriota, Proteobacteria, Acidobacteriota, and Euryarchaeota increased. The relative content of Papillibacter and Saccharofermentans was increased at the genus level, and the relative content of Bacteroides and Ruminococcus was decreased. The test group given 3% of prickly ash seeds was superior to the test group given 6% of prickly ash seeds. In addition, the addition of 3% of prickly ash seeds improved the metabolism or immunity of sheep. Fusobacteriota and Acidobacteriota were positively correlated with total weight, dressing percentage, and average daily gain (ADG) and negatively correlated with average daily feed intake (ADFI), feed-to-gain ratio (F/G), and lightness (L*). Methanobrevibacter and Saccharofermentans were positively correlated with ADG and negatively correlated with ADFI and L*. In conclusion, under the present experimental conditions, the addition of prickly ash seeds increased the abundance and diversity of rumen microorganisms in Hu sheep and changed the relative abundance of some genera. However, the addition of 6% prickly ash seeds may negatively affect the digestive and immune functions in sheep rumen.
Keywords: 16S rRNA; prickly ash seeds; production property; rumen microbial; sheep.
Copyright © 2024 Li, Li, Ma, Wang, Wang, Wang, Liu, Li and Ma.
Conflict of interest statement
The authors declare that the research was conducted in the absence of any commercial or financial relationships that could be construed as a potential conflict of interest.
Figures
Similar articles
-
Prickly Ash Seeds Improve the Ruminal Epithelial Development and Growth Performance of Hu Sheep by Modulating the Rumen Microbiota and Metabolome.Microorganisms. 2024 Nov 6;12(11):2242. doi: 10.3390/microorganisms12112242. Microorganisms. 2024. PMID: 39597631 Free PMC article.
-
Prickly Ash Seeds improve immunity of Hu sheep by changing the diversity and structure of gut microbiota.Front Microbiol. 2023 Oct 31;14:1273714. doi: 10.3389/fmicb.2023.1273714. eCollection 2023. Front Microbiol. 2023. PMID: 38029081 Free PMC article.
-
Relationship between Rumen Microbial Differences and Phenotype Traits among Hu Sheep and Crossbred Offspring Sheep.Animals (Basel). 2024 May 20;14(10):1509. doi: 10.3390/ani14101509. Animals (Basel). 2024. PMID: 38791726 Free PMC article.
-
Effects of Steviol Glycosides on Growth Performance, Ruminal Fermentation and Microbial Diversity of Hu Sheep.Animals (Basel). 2024 Jul 5;14(13):1991. doi: 10.3390/ani14131991. Animals (Basel). 2024. PMID: 38998102 Free PMC article.
-
Application of synthetic estrogen in sheep.Environ Qual Saf Suppl. 1976;(5):99-108. Environ Qual Saf Suppl. 1976. PMID: 821749 Review.
References
LinkOut - more resources
Full Text Sources
Research Materials
Miscellaneous