Unraveling tuberculosis patient cluster transmission chains: integrating WGS-based network with clinical and epidemiological insights
- PMID: 38832230
- PMCID: PMC11144917
- DOI: 10.3389/fpubh.2024.1378426
Unraveling tuberculosis patient cluster transmission chains: integrating WGS-based network with clinical and epidemiological insights
Abstract
Background: Tuberculosis remains a global health threat, and the World Health Organization reports a limited reduction in disease incidence rates, including both new and relapse cases. Therefore, studies targeting tuberculosis transmission chains and recurrent episodes are crucial for developing the most effective control measures. Herein, multiple tuberculosis clusters were retrospectively investigated by integrating patients' epidemiological and clinical information with median-joining networks recreated based on whole genome sequencing (WGS) data of Mycobacterium tuberculosis isolates.
Methods: Epidemiologically linked tuberculosis patient clusters were identified during the source case investigation for pediatric tuberculosis patients. Only M. tuberculosis isolate DNA samples with previously determined spoligotypes identical within clusters were subjected to WGS and further median-joining network recreation. Relevant clinical and epidemiological data were obtained from patient medical records.
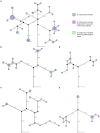
Results: We investigated 18 clusters comprising 100 active tuberculosis patients 29 of whom were children at the time of diagnosis; nine patients experienced recurrent episodes. M. tuberculosis isolates of studied clusters belonged to Lineages 2 (sub-lineage 2.2.1) and 4 (sub-lineages 4.3.3, 4.1.2.1, 4.8, and 4.2.1), while sub-lineage 4.3.3 (LAM) was the most abundant. Isolates of six clusters were drug-resistant. Within clusters, the maximum genetic distance between closely related isolates was only 5-11 single nucleotide variants (SNVs). Recreated median-joining networks, integrated with patients' diagnoses, specimen collection dates, sputum smear microscopy, and epidemiological investigation results indicated transmission directions within clusters and long periods of latent infection. It also facilitated the identification of potential infection sources for pediatric patients and recurrent active tuberculosis episodes refuting the reactivation possibility despite the small genetic distance of ≤5 SNVs between isolates. However, unidentified active tuberculosis cases within the cluster, the variable mycobacterial mutation rate in dormant and active states, and low M. tuberculosis genetic variability inferred precise transmission chain delineation. In some cases, heterozygous SNVs with an allelic frequency of 10-73% proved valuable in identifying direct transmission events.
Conclusion: The complex approach of integrating tuberculosis cluster WGS-data-based median-joining networks with relevant epidemiological and clinical data proved valuable in delineating epidemiologically linked patient transmission chains and deciphering causes of recurrent tuberculosis episodes within clusters.
Keywords: WGS; network; reactivation; recurrence; reinfection; transmission; tuberculosis.
Copyright © 2024 Sadovska, Ozere, Pole, Ķimsis, Vaivode, Vīksna, Norvaiša, Bogdanova, Ulanova, Čapligina, Bandere and Ranka.
Conflict of interest statement
The authors declare that the research was conducted in the absence of any commercial or financial relationships that could be construed as a potential conflict of interest.
Figures


References
-
- World Health Organization . Global tuberculosis report 2023. Geneva: World Health Organization; (2023) Licence: CC BY-NC-SA 3.0 IGO.
-
- World Health Organization . Implementing the end TB strategy: The essentials, 2022 update. Geneva: World Health Organization; (2022) Licence: CC BY-NC-SA 3.0 IGO.
MeSH terms
LinkOut - more resources
Full Text Sources
Medical

