

Connecto-informatics at the mesoscale: current advances in image processing and analysis for mapping the brain connectivity
- PMID: 38833195
- PMCID: PMC11150223
- DOI: 10.1186/s40708-024-00228-9
Connecto-informatics at the mesoscale: current advances in image processing and analysis for mapping the brain connectivity
Abstract
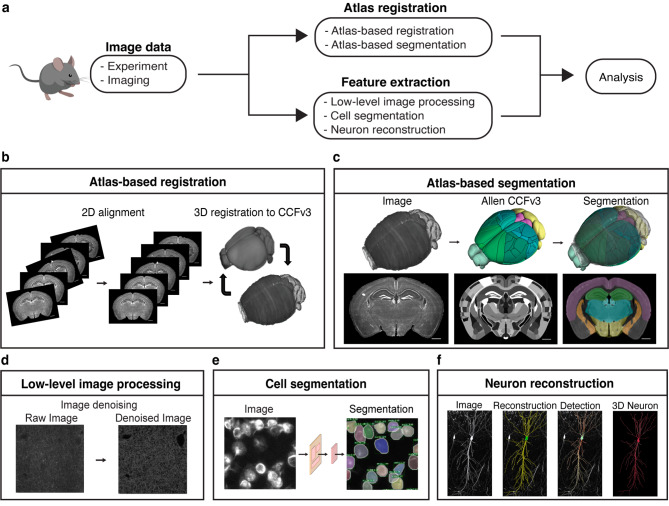
Mapping neural connections within the brain has been a fundamental goal in neuroscience to understand better its functions and changes that follow aging and diseases. Developments in imaging technology, such as microscopy and labeling tools, have allowed researchers to visualize this connectivity through high-resolution brain-wide imaging. With this, image processing and analysis have become more crucial. However, despite the wealth of neural images generated, access to an integrated image processing and analysis pipeline to process these data is challenging due to scattered information on available tools and methods. To map the neural connections, registration to atlases and feature extraction through segmentation and signal detection are necessary. In this review, our goal is to provide an updated overview of recent advances in these image-processing methods, with a particular focus on fluorescent images of the mouse brain. Our goal is to outline a pathway toward an integrated image-processing pipeline tailored for connecto-informatics. An integrated workflow of these image processing will facilitate researchers' approach to mapping brain connectivity to better understand complex brain networks and their underlying brain functions. By highlighting the image-processing tools available for fluroscent imaging of the mouse brain, this review will contribute to a deeper grasp of connecto-informatics, paving the way for better comprehension of brain connectivity and its implications.
Keywords: Atlas registration; Atlas segmentation; Brain mapping; Image processing; Mesoscale connectivity; Neuron reconstruction.
© 2024. The Author(s).
Conflict of interest statement
The authors declare no competing interests.
Figures

Similar articles
-
Bi-channel image registration and deep-learning segmentation (BIRDS) for efficient, versatile 3D mapping of mouse brain.Elife. 2021 Jan 18;10:e63455. doi: 10.7554/eLife.63455. Elife. 2021. PMID: 33459255 Free PMC article.
-
Neuroinformatics of the Allen Mouse Brain Connectivity Atlas.Methods. 2015 Feb;73:4-17. doi: 10.1016/j.ymeth.2014.12.013. Epub 2014 Dec 20. Methods. 2015. PMID: 25536338 Review.
-
Mesoscale microscopy and image analysis tools for understanding the brain.Prog Biophys Mol Biol. 2022 Jan;168:81-93. doi: 10.1016/j.pbiomolbio.2021.06.013. Epub 2021 Jul 1. Prog Biophys Mol Biol. 2022. PMID: 34216639 Free PMC article. Review.
-
Between neurons and networks: investigating mesoscale brain connectivity in neurological and psychiatric disorders.Front Neurosci. 2024 Feb 20;18:1340345. doi: 10.3389/fnins.2024.1340345. eCollection 2024. Front Neurosci. 2024. PMID: 38445254 Free PMC article. Review.
-
A dynamic and expandable digital 3D-atlas maker for monitoring the temporal changes in tissue growth during hindbrain morphogenesis.Elife. 2022 Sep 28;11:e78300. doi: 10.7554/eLife.78300. Elife. 2022. PMID: 36169400 Free PMC article.
Cited by
-
NeuroSC: Exploring Neurodevelopment via Spatiotemporal Collation of Anatomical Networks.bioRxiv [Preprint]. 2025 May 27:2024.08.27.609993. doi: 10.1101/2024.08.27.609993. bioRxiv. 2025. PMID: 39484462 Free PMC article. Preprint.
-
A neuronal imaging dataset for deep learning in the reconstruction of single-neuron axons.Front Neuroinform. 2025 Aug 5;19:1628030. doi: 10.3389/fninf.2025.1628030. eCollection 2025. Front Neuroinform. 2025. PMID: 40837216 Free PMC article.
References
Publication types
Grants and funding
LinkOut - more resources
Full Text Sources
