. 2024 Jun 3;24(6):2.
doi: 10.1167/jov.24.6.2.

Unique yellow shifts for small and brief stimuli in the central retina

Affiliations

Unique yellow shifts for small and brief stimuli in the central retina

Maxwell J Greene et al. J Vis. .

Abstract

The spectral locus of unique yellow was determined for flashes of different sizes (<11 arcmin) and durations (<500 ms) presented in and near the fovea. An adaptive optics scanning laser ophthalmoscope was used to minimize the effects of higher-order aberrations during simultaneous stimulus delivery and retinal imaging. In certain subjects, parafoveal cones were classified as L, M, or S, which permitted the comparison of unique yellow measurements with variations in local L/M ratios within and between observers. Unique yellow shifted to longer wavelengths as stimulus size or duration was reduced. This effect is most pronounced for changes in size and more apparent in the fovea than in the parafovea. The observed variations in unique yellow are not entirely predicted from variations in L/M ratio and therefore implicate neural processes beyond photoreception.


Figures

Figure 1.
Figure 1.
Retinal images at locations where cones have been classified with AO-OCT. For illustrative purposes, cone spectral identity is represented by color (L-, M-, and S-cones are red, green, and blue, respectively). Retinal eccentricities: (A) 20210R: 2.0° temporal; (B) 10003L: 1.7° temporal; (C) 10001R at 2.0° temporal; (D) 20236: 1.5° temporal; (E) 20053R: 1.5° inferior. Scale bar in (E) indicates 5 arcmin of visual angle.
Figure 2.
Figure 2.
(A) Stimulus gamut in MacLeod–Boynton chromaticity space, defined by the achromatic projector background (black square) and AOSLO primaries (black circles). The stimuli used for hue scaling are shown as colored squares along the spectral locus, with dominant wavelengths (in nm) for each stimulus labeled adjacent to the marker. (B) Single-session adaptive staircase data for 20212L, for the 3.2 arcmin, one-frame foveal test condition. Trial markers are color-coded by subject response (red or green). (C) Psychometric function fitted from the staircase data in (B). Black circles indicate the proportion of trials the subject responded red; marker area is scaled to the number of trials for each intensity. Black dashed lines denote the 680-nm primary intensity that produced a subjective red–green equilibrium (i.e., “unique yellow”).
Figure 3.
Figure 3.
Foveal measurements of unique yellow as a function of stimulus size and duration. (A) Unique yellow-versus-diameter functions for eight color-normal subjects. Data are arranged in rows according to the stimulus duration in AOSLO frames (frame rate: 30 Hz). The 1-, 4-, and 15-frame conditions are nominally equivalent to <10-, 100-, and 467-ms stimulus durations, respectively. Filled circles indicate mean unique yellow settings; open circles indicate individual measurements for subjects who participated in more than one experimental session. (B) Data from (A) are replotted to illustrate the dependence of unique yellow on stimulus duration for stimuli of various sizes. Note: for both panels, the y-axis is compressed at the extreme ends of the scale for visualization purposes, and the 1.1 arcmin, one-frame data point for subject 20236R (rightmost column) was excluded due to a poor psychometric function fit to the staircase data. For participants with spectrally classified cone mosaics, parafoveal L/M ratios are listed beneath the subject identifier. *ORG classification in subject 20210L was done in the fellow eye as part of another study, as noted in Table 1. The data from Figure 3 are shown as a color-coded matrix in Supplementary Figure S1.
Figure 4.
Figure 4.
Unique yellow versus stimulus size. Gray markers plot the foveal unique yellow measurements as a function of stimulus size for the four-frame condition (nominally 100 ms) (Figure 3A, middle row), averaged across eight subjects. Unique yellow estimates for the 15-frame condition (nominally 467 ms) are shown by the black markers. Error bars are ±1 SEM. Gray and black markers are offset horizontally to enhance visualization. Open markers show unique yellow measurements obtained with an intermediate stimulus duration (200 ms) for two subjects, MS (squares) and VC (diamonds), as reported in Otake and Cicerone (2000).
Figure 5.
Figure 5.
Hue scaling of brief, small-field mixtures of red and green. (A) Uniform appearance diagrams for the 1.1 arcmin stimulus at each duration, as well as the 10.7 arcmin stimulus at 15 frames. Different marker shapes indicate different subjects. Markers color indicates stimulus locus in MacLeod–Boynton space, as shown in Figure 2A. Redder markers correspond to stimuli with a higher proportion red (680 nm), and greener markers correspond to stimuli with a higher proportion green (543 nm). (B) Mean (± SEM) hue angle across subjects versus stimulus energy (diameter × duration), for different mixtures of the red and green primaries. (C) Mean (± SEM) saturation across subjects versus stimulus energy. (D) Mean (± SEM) saturation versus stimulus equivalent wavelength, for each of the energy levels indicated by i–iv in (C). Note: lower error bars are not plotted in (D) for visualization purposes.
Figure 6.
Figure 6.
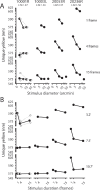
Parafoveal measurements of unique yellow as a function of stimulus size and duration. (A) Unique yellow-versus-diameter functions for four color-normal subjects. Data are arranged in rows according to the stimulus duration in AOSLO frames (frame rate: 30 Hz). The 1-, 4-, and 15-frame conditions are nominally equivalent to <10-, 100-, and 467-ms stimulus durations, respectively. Filled circles indicate mean unique yellow settings; open circles indicate individual measurements for subjects who participated in more than one experimental session. Parafoveal L/M ratios are indicated beneath each subject identifier. (B) Data from (A) are replotted to illustrate the dependence of unique yellow on stimulus duration for stimuli of various sizes. In both panels, the y-axis is compressed at the extreme ends of the scale for visualization purposes. For subjects 10003L, 20053R, and 20236R, data for the 3.2 arcmin, one-frame condition were excluded due to poor psychometric function fits. Note: for subject 20236R, the middle-sized stimulus subtended 7.0 arcmin; these data are plotted with the 7.5 arcmin data obtained from the other participants. The data from Figure 6 are shown as a color-coded matrix in Supplementary Figure S2.
Figure 7.
Figure 7.
Light delivery contours for the four-frame stimuli. Yellow contours encircle 50% of the luminous power delivered across all trials; black contours encircle 90%. Columns correspond to different subjects, while rows correspond to different stimulus sizes. Scale bars indicating the stimulus diameter (black lines) are shown for each row. Unique yellow estimates corresponding to each condition are shown at the bottom of each retina map. Unique yellow measurements were made on two occasions for 10001R. The contours for the first measurement are solid and the ones for the second measurement are dashed. Scale bar in lower right panel indicates 5 arcmin of visual angle. Note: for subject 20236R, the middle-sized stimulus subtended 7.0 arcmin; these data are plotted with the 7.5 arcmin data obtained from the other participants.
Figure 8.
Figure 8.
Dependence of unique yellow on L/M ratio. (A) Unique yellow estimates plotted against the median L-cone proportion of retinal locations stimulated across all trials. Black, gray, and white markers with black edges correspond to stimulus sizes of 3.2′, 7.5′, and 10.7′, respectively. Marker shapes correspond to different subjects, as indicated in the legend. Gray-edged markers near the abscissa indicate the global L/M ratios of each subject. Vertical errors bars are the 95% bootstrapped confidence intervals on each unique yellow estimate, while horizontal error bars give the interquartile range of local L-cone proportions encountered across trials. (B) The same data as in (A), separated by stimulus size and plotted in individual panels. In each panel, the solid curve gives the unique yellow values predicted by a simple model of L–M cone opponency described in the text. Note: for subject 20236R, the middle-sized stimulus subtended 7.0 arcmin; these data are plotted with the 7.5 arcmin data obtained from the other participants.

Similar articles

Cited by

References

    1. Abramov, I., & Gordon, J. (2005). Seeing unique hues. Journal of the Optical Society of America A, 22(10), 2143–2153. - PubMed
    1. Abramov, I., Gordon, J., & Chan, H. (1991). Color appearance in the peripheral retina: Effects of stimulus size. Journal of the Optical Society of America A, 8(2), 404, 10.1364/josaa.8.000404. - DOI - PubMed
    1. Abramov, I., Gordon, J., & Chan, H. (1992). Color appearance across the retina: Effects of a white surround. Journal of the Optical Society of America A, 9(2), 195, 10.1364/JOSAA.9.000195. - DOI - PubMed
    1. Atchison, D. A., & Smith, G. (2005). Chromatic dispersions of the ocular media of human eyes. Journal of the Optical Society of America A, 22(1), 29–37, 10.1364/JOSAA.22.000029. - DOI - PubMed
    1. Ayama, M., Nakatsue, T., & Kaiser, P. K. (1987). Constant hue loci of unique and binary balanced hues at 10, 100, and 1000 Td. Journal of the Optical Society of America A, 4(6), 1136–1144, 10.1364/JOSAA.4.001136. - DOI - PubMed