. 2024 Oct 1;73(10):1728-1741.
doi: 10.2337/db23-0862.

A Neuron-Mast Cell Axis Regulates Skin Microcirculation in Diabetes

Affiliations

A Neuron-Mast Cell Axis Regulates Skin Microcirculation in Diabetes

Xinran Li et al. Diabetes. .

Abstract

Changes in microcirculation lead to the progression of organ pathology in diabetes. Although neuroimmune interactions contribute to a variety of conditions, it is still unclear whether abnormal neural activities affect microcirculation related to diabetes. Using laser speckle contrast imaging, we examined the skin of patients with type 2 diabetes and found that their microvascular perfusion was significantly compromised. This phenomenon was replicated in a high-fat diet-driven murine model of type 2 diabetes-like disease. In this setting, although both macrophages and mast cells were enriched in the skin, only mast cells and associated degranulation were critically required for the microvascular impairment. Sensory neurons exhibited enhanced TRPV1 activities, which triggered mast cells to degranulate and compromise skin microcirculation. Chemical and genetic ablation of TRPV1+ nociceptors robustly improved skin microcirculation status. Substance P (SP) is a neuropeptide and was elevated in the skin and sensory neurons in the context of type 2 diabetes. Exogenous administration of SP resulted in impaired skin microcirculation, whereas neuronal knockdown of SP dramatically prevented mast cell degranulation and consequently improved skin microcirculation. Overall, our findings indicate a neuron-mast cell axis underlying skin microcirculation disturbance in diabetes and shed light on neuroimmune therapeutics for diabetes-related complications.


Conflict of interest statement

Duality of Interest. No potential conflicts of interest relevant to this article were reported.

Figures

None
Graphical abstract
Figure 1
Figure 1
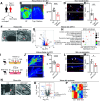
Type 2 diabetes exhibits microcirculatory impairment in the skin. A: Schematic of skin microcirculation examination and skin biopsy for HCs and participants with type 2 diabetes. B and C: Representative LSCI images of reduced perfusion velocity in type 2 diabetes footpad skin (B quantified in C; n = 7 HCs, n = 5 participants with type 2 diabetes). Color bar indicates blood perfusion velocity. D and E: Representative images showing reduced vascularization in type 2 diabetes skin (D quantified as CD31+density/mm2 in E; n = 4 individuals per group). White arrows in D indicate CD31+ IF signals. F: Pathological changes in human skin of HCs and participants with type 2 diabetes. Red arrows indicate tight junction between endothelium cells. Black arrows indicate basal membrane of the blood vessel. G: Volcano plot of up- and downregulated genes in the mRNA sequencing of biopsied skin from participants with type 2 diabetes. Blue dots represent downregulated genes, and red dots represent upregulated genes. H: KEGG enrichment analysis revealed that the overrepresentation of genes in neuroimmune-related pathways refer to the inflammatory profile. I: Schematic of the type 2 diabetes–like disease. WT mice were fed either normal-fat diet (NFD) or HFD for 49 days. While NFD-fed mice received vehicle injections (control [Ctrl]), HFD-fed mice were intraperitoneally (i.p.) administered STZ 30 mg/kg on day 21 (D21), D22, and D23. J and K: Representative LSCI images of paw skin showing decreased perfusion in type 2 diabetes–like disease. Color bar indicates blood perfusion velocity (J quantified in K; 9–10 animals per group). L and M: Representative images of CD31+ IF signals indicating microvascular reduction in the paw skin of mice with type 2 diabetes–like disease (L quantified in M; n = 4 animals per group). White arrows in L indicate CD31+ signals. N: Pathological changes in mouse skin of control (Ctrl) and type 2 diabetes–like mouse (HFD + STZ). Red arrows indicate a tight junction between endothelium cells. Black arrows indicate the basal membrane of the blood vessel. O: Volcano plots of differentially expressed proteins (log2 fold change [FC] on x-axis) of paw skin between groups (n = 3 animals per group). P: Heat map of differentially expressed inflammatory-related proteins in paw skin between groups (n = 3 animals per group). Scale bars in D and L are 100 μm and in F and N, 2 μm. All quantified data are mean ± SD. Statistical analysis by two-tailed Student t test. *P < 0.05, **P < 0.01, ***P < 0.001, ****P < 0.0001. ECM, extracellular matrix; PI3K, phosphoinositide 3-kinase; PU, perfusion unit.
Figure 2
Figure 2
Diabetes-associated skin microcirculation dysfunction depends on mast cells. A: Representative flow cytometry plots and frequency of CD45+ cells in alive cells from paw skin of control (Ctrl) mice and mice with type 2 diabetes–like disease (n = 6 mice per group). B and C: Representative flow cytometry plots and frequency of CD64+ MerTK+ macrophages (B) and Lin- (CD3e, CD5, CD11c, CD19, NK1.1) CD117 (c-Kit)+ FcεRIα/IgE+ mast cells (C) in CD45+ cells from paw skin of Ctrl mice and mice with type 2 diabetes–like disease (n = 6 mice per group). D: Schematic of type 2 diabetes–like disease in macrophage deficiency mouse strain homozygous Ccr2-Cx3cr1 and their littermate WT Ctrls. E and F: Representative LSCI images of paw skin indicating an equivalent perfusion pattern between the two groups (E quantified in F; n = 4–6 per group). G and H: Representative images of CD31+ IF signals indicated by white arrows presenting comparable vascularization in the paw skin between two groups (G quantified in H; n = 4–6 per group). I: Schematic of type 2 diabetes–like disease in mast cell–deficient Kitw-sh mice and their littermate WT Ctrls. J and K: Representative LSCI images of paw indicating improved skin microcirculation perfusion in Kitw-sh mice compared with WT Ctrls (J quantified in K; n = 8 animals per group). L and M: Representative images of CD31+ IF signals indicated by white arrows presenting increased vascularization in the paw skin of Kitw-sh mice (L quantified in M; n = 5 animals per group). Scale bars in G and L are 100 μm. All quantified data are mean ± SD. Statistical analysis by two-tailed Student t test. **P < 0.01, ***P < 0.001, ****P < 0.0001. D, day; i.p., intraperitoneal; PU, perfusion unit.
Figure 3
Figure 3
Mast cell degranulation mediates dysregulation of skin microcirculation in diabetes. A and B: Representative images of avidin-488–labeled mast cells and degranulation in lower-limb skin of HCs and participants with type 2 diabetes. Yellow arrows indicate degranulation, while white arrows indicate nondegranulated mast cells (A quantified in B; n = 4 individuals per group). C and D: Representative images of avidin-488–labeled cells showing more mast cell degranulation in paw skin from mice with type 2 diabetes–like disease than control (Ctrl) mice. Yellow arrows indicate degranulation, while white arrows indicate nondegranulated mast cells (C quantified in D; n = 4 animals per group). E: Schematic of administration of mast cell stabilizer SCG for WT mice from day 28 (D28) to D49 during the HFD + STZ procedure of type 2 diabetes–like disease. F and G: Representative images of avidin-488–labeled cells showing less mast cell degranulation in the group treated with SCG than the group treated with vehicle (Veh) (F quantified in G; n = 6–7 animals per group). Yellow arrows indicate degranulation, while white arrows indicate nondegranulated mast cells. H and I: Representative LSCI images showing increased perfusion velocity in paw skin following SCG treatment (H quantified in I; n = 5 animals per treatment). J and K: Representative images of CD31+ IF signals indicated by white arrows in paw skin showing improved skin vascularization in SCG-treated but not Veh-treated mice with type 2 diabetes–like disease (J quantified in K; n = 6–7 animals per group). Scale bars in A, C, and F are 50 μm and in J is 100 μm. All quantified data are mean ± SD. Statistical analysis by two-tailed Student t test. **P < 0.01, ***P < 0.001. i.p., intraperitoneal; PU, perfusion unit.
Figure 4
Figure 4
Sensory neurons have enhanced TRPV1 activity in type 2 diabetes–like disease. A: Volcano plot of differentially expressed genes (log2 fold change [FC] on x-axis) by bulk RNA sequencing of sensory neurons (DRG) from control (Ctrl) mice and mice with type 2 diabetes–like disease. Red dots represent upregulated genes, while blue dots represent downregulated genes. B: KEGG enrichment indicating that the neuroactive pathway is activated in DRG neurons from mice with type 2 diabetes–like disease compared with Ctrl mice. C: Behavior tests showing increased TRPV1 activity, including decreased paw withdrawal latency upon Hargreaves radial heat stimulation (n = 10 animals per group). D–F: Schematic of retrograde tracing via WGA-488 intradermal (i.d.) injection in the paw skin (D shows tracing path), indicating high innervation of TRPV1 immunoresponsive neurons (TRPV1-IR) in L3–L5 DRG in naive WT mice (E quantified in F; n = 3 animals). G and H: Behavior tests showing increased TRPV1 activity, including increased nociceptive behaviors to capsaicin (1 µg in 10 μL saline i.d.) in mice with type 2 diabetes–like disease compared with Ctrl mice. I: Representative images of in vitro calcium imaging to detect responses to capsaicin in DRG sensory neurons from Ctrl mice and mice with type 2 diabetes–like disease. Neurons were sequentially stimulated with capsaicin of 50 and 500 nmol/L. Yellow arrows indicate cells responsive to capsaicin. J: Representative calcium transients of sensory neurons responsive to capsaicin from Ctrl mice and mice with type 2 diabetes–like disease. Each color trace represents one neuron responsive to capsaicin. Images are representative of five independent experiments using DRG from at least three individual mice (I and J quantified in K; n = 5 independent tests). Scale bars in E and I are 100 μm. All quantified data are mean ± SD. Statistical analysis by two-tailed Student t test. *P < 0.05, **P < 0.01, ***P < 0.001, ****P < 0.0001. Cap, capsaicin.
Figure 5
Figure 5
TRPV1 and nociceptors are required for regulating skin microcirculation. A and B: Representative images of avidin-488–labeled cells showing less mast cell degranulation in the Trpv1−/− group than their littermate Trpv1+/+ controls (A quantified in B; n = 3 animals per group). Yellow arrows indicate degranulation, while white arrows indicate nondegranulated mast cells. C and D: Representative images of paw skin showing restored skin perfusion via LSCI in Trpv1−/− but not Trpv1+/+ mice with type 2 diabetes–like disease (C quantified in D; Trpv1+/+, n = 5 animals; Trpv1−/−, n = 8 animals). E and F: Representative images of paw skin showing increased CD31+ IF signals (indicated by white arrows) per mm2 in Trpv1−/− mice compared with their Trpv1+/+ controls with type 2 diabetes–like disease (E quantified in F; n = 5 animals per group). G–L: RTX to ablate TRPV1+ sensory neurons significantly inhibited mast cell degranulation as indicated by avidin-488 labeling (G quantified in H; n = 6 animals in vehicle [Veh] group and n = 4 in RTX-treated group), improved skin perfusion as revealed by LSCI (I quantified in J; n = 7 animals in Veh group and n = 7 in RTX-treated group), and restored CD31-labeled vascularization (K quantified in L; n = 4 per group). M–R: Genetic TRPV1 lineage neuronal ablation showing reduced mast cell degranulation ratio (M quantified in N; ROSA26iDTR/+ [iDTR], n = 3 animals; Trpv1Cre/+;ROSA26iDTR/+ [TRPV1-iDTR], n = 4 animals), improved skin perfusion velocity (O quantified in P; iDTR, n = 3 animals; TRPV1-iDTR, n = 6 animals), and restored skin vascularization (Q quantified in R; n = 6 animals per group). Scale bars in A, G, and M are 50 μm and in E, K, and Q are 100 μm. All quantified data are mean ± SD. Statistical analysis by two-tailed Student t test. *P < 0.05, **P < 0.01, ***P < 0.001, ****P < 0.0001. PU, perfusion unit.
Figure 6
Figure 6
SP is sufficient to induce skin mast cell activation and microcirculatory impairment. A–C: Representative images showing SP-IF response (SP-IR) (purple) in WGA-488 (green) retrograde labeling of TRPV1 lineage neurons (revealed as TRPV1-tdTomato red fluorescence) for paw skin innervation. Yellow arrows indicate triple staining of the overlapping L3–L5 DRG sensory neurons (A quantified in B for all retrograde WGA+ neurons and quantified in C for SP-expressed WGA retrograde neurons). D: Increased SP-IR in L3–L5 DRG from mice with type 2 diabetes–like disease compared with normal-fat diet–fed control (Ctrl) mice (n = 5 animals per group). E: Increased SP-IR signals per mm2 in paw skin from mouse with type 2 diabetes–like disease compared with that from Ctrl mice (n = 4 animals per group). F–I: Separate intradermal injections of SP 5 μg and vehicle (Veh) into the paws of Kitw-sh-naive mice and their littermate WT Ctrls in steady state, with WT mice showing more mast cell degranulation ratio (F quantified in G; n = 12 animals per WT Ctrl group and n = 7–8 animals per Kitw-sh group). Yellow arrows indicate degranulation, while white arrows indicate nondegranulated mast cells. Decreased skin perfusion was revealed by LSCI, but the Kitw-sh group showed no difference (H quantified in I; n = 14–15 animals per WT Ctrl group; n = 7–9 animals per Kitw-sh group). J and K: RTX to ablate TRPV1+ sensory neurons in mice that received exogenous SP, rather than Veh, intradermal injections exhibited decreased skin perfusion as revealed by LSCI (J quantified in K; n = 5–6 animals per group). L and M: Genetic TRPV1 lineage neuronal ablation mice that received exogenous SP, rather than Veh, intradermal injections exhibited decreased skin perfusion as revealed by LSCI (L quantified in M; n = 4–5 animals per group). Scale bar in A is 100 μm and in F is 50 μm. All quantified data are mean ± SD. Statistical analysis by two-tailed Student t test. **P < 0.01, ***P < 0.001, ****P < 0.0001. PU, perfusion unit.
Figure 7
Figure 7
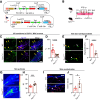
SP signaling on sensory neurons is necessary for skin microvascular impairment related to type 2 diabetes–like disease. A: SP (encoded by gene Tac1) knockdown strategy by shRNA in a Cre-dependent rAAV9-shRNA-Tac1 virus. B: Schematic of delivery of rAAV9-shRNA-Tac1 virus into WT and Trpv1Cre/+ mice by intrathecal (i.t.) injection during the procedure of type 2 diabetes–like disease. C and D: Representative images of L3–L5 DRG showing decreased percentage of SP-IF response in TRPV1 neurons of from Trpv1Cre/+ mice rather than WT mice that received rAAV9-shRNA-Tac1 virus (C quantified in D; n = 14 sections from n = 3 mice per group). Yellow arrows indicate overlapping neurons, while mCherry in red verifies fluorescence protein expression via Cre-dependent recombination. E and F: Representative images of avidin-488–labeled cells in the paw skin showing a decreased mast cell degranulation ratio following SP knockdown in Trpv1Cre/+ mice compared with WT control mice (E quantified in F; n = 4 WT animals, n = 5 Trpv1Cre/+ animals). Yellow arrows indicate degranulation, while white arrows indicate nondegranulated mast cells. G and H: Representative images of LSCI showing restored paw skin perfusion in Trpv1Cre/+ but not WT mice with type 2 diabetes–like disease after rAAV9-shRNA-Tac1 virus administration (G quantified in H; n = 9 WT animals, n = 8 Trpv1Cre/+ animals). I and J: Representative images of CD31+ IF signals (indicated by white arrows) of paw skin showing improved skin vascularization per mm2 in Trpv1Cre/+ mice but not in WT mice with type 2 diabetes–like disease following rAAV9 delivery (I quantified in J; n = 6 WT animals, n = 6 Trpv1Cre/+ animals). Scale bar in C is 50 μm and in I is 100 μm. All quantified data are mean ± SD. Statistical analysis by two-tailed Student t test. *P < 0.05, *** P < 0.001, ****P < 0.0001. D, day; i.p., intraperitoneal; PU, perfusion unit.

Comment in

References

    1. Donnelly R, Emslie-Smith AM, Gardner ID, Morris AD. ABC of arterial and venous disease: Vascular complications of diabetes. BMJ 2000;320:1062–1066 - PMC - PubMed
    1. Faselis C, Katsimardou A, Imprialos K, Deligkaris P, Kallistratos M, Dimitriadis K. Microvascular complications of type 2 diabetes mellitus. Curr Vasc Pharmacol 2020;18:117–124 - PubMed
    1. Aubdool AA, Brain SD. Neurovascular aspects of skin neurogenic inflammation. J Invest Derm Symp Proc 2011;15:33–39 - PubMed
    1. Sayin N, Kara N, Pekel G. Ocular complications of diabetes mellitus. World J Diabetes 2015;6:92–108 - PMC - PubMed
    1. Li Y, Liu Y, Liu S, et al. Diabetic vascular diseases: molecular mechanisms and therapeutic strategies. Signal Transduct Target Ther 2023;8:152. - PMC - PubMed