. 2024 Sep 2;196(1):124-136.
doi: 10.1093/plphys/kiae232.

A cellulose synthesis inhibitor affects cellulose synthase complex secretion and cortical microtubule dynamics

Affiliations

A cellulose synthesis inhibitor affects cellulose synthase complex secretion and cortical microtubule dynamics

Julien Renou et al. Plant Physiol. .

Abstract

P4B (2-phenyl-1-[4-(6-(piperidin-1-yl) pyridazin-3-yl) piperazin-1-yl] butan-1-one) is a novel cellulose biosynthesis inhibitor (CBI) discovered in a screen for molecules to identify inhibitors of Arabidopsis (Arabidopsis thaliana) seedling growth. Growth and cellulose synthesis inhibition by P4B were greatly reduced in a novel mutant for the cellulose synthase catalytic subunit gene CESA3 (cesa3pbr1). Cross-tolerance to P4B was also observed for isoxaben-resistant (ixr) cesa3 mutants ixr1-1 and ixr1-2. P4B has an original mode of action as compared with most other CBIs. Indeed, short-term treatments with P4B did not affect the velocity of cellulose synthase complexes (CSCs) but led to a decrease in CSC density in the plasma membrane without affecting their accumulation in microtubule-associated compartments. This was observed in the wild type but not in a cesa3pbr1 background. This reduced density correlated with a reduced delivery rate of CSCs to the plasma membrane but also with changes in cortical microtubule dynamics and orientation. At longer timescales, however, the responses to P4B treatments resembled those to other CBIs, including the inhibition of CSC motility, reduced growth anisotropy, interference with the assembly of an extensible wall, pectin demethylesterification, and ectopic lignin and callose accumulation. Together, the data suggest that P4B either directly targets CESA3 or affects another cellular function related to CSC plasma membrane delivery and/or microtubule dynamics that is bypassed specifically by mutations in CESA3.


Conflict of interest statement

Conflict of interest statement. None declared.

Figures

Figure 1.
Figure 1.
P4B inhibits cell elongation. A) The chemical structure of P4B. B) Phenotypes of 3-d-old Col-0 seedlings grown in the dark on either 0.5% (v/v) DMSO (left), 20 µm (middle), or 50 µm P4B (right). Scale bar = 2 mm. C) Dose–response curve of dark-grown hypocotyl length on P4B. IC50 = 20 µm. Data represent mean ± Sd, n = 20. D) Propidium iodide (PI)-stained 3-d-old etiolated hypocotyl cells treated with 0.5% DMSO or 50 µm P4B. Scale bar = 100 µm.
Figure 2.
Figure 2.
Mutations in CESA3 confer increased tolerance to P4B. A, B) Three-day-old phenotypes of WT and cesa3pbr1 mutant seedlings grown in the dark in the presence of 50 µm P4B or control (0.5% [v/v] DMSO). A) Photo of the complementation of cesa3pbr1 (pbr1) phenotype by a pCESA3-CESA3 transgene, scale bar = 2 mm. B) Quantification of hypocotyl length in presence of 50 µm P4B; bars represent Sd, *P < 0.05, **P < 0.01, Student's t test, n = 20. C) Dose–response curve of dark-grown hypocotyl length of control, cesa3pbr1, cesa3ixr1–1 (ixr1-1) , and cesa3ixr1–2 (ixr1-2) on P4B. cesa3ixr1–1 and cesa3ixr1–2 mutations also confer resistance to P4B. Data represent mean ± Sd, n = 20. D) Genetic mapping and cloning of pbr1 mutant locus. E) Photos of cesa3ixr1–1 and cesa3ixr1–2 dark-grown seedlings on either DMSO or 50 µm P4B, scale bar = 2 mm. F) Photo of cesa3pbr1/cesa3ixr1–1 F1 cross grown on either DMSO or 50 µm P4B, scale bar = 2 mm.
Figure 3.
Figure 3.
P4B is a cellulose synthesis inhibitor. Col0 Arabidopsis seedlings were grown for 3 d in the dark in the presence of buffer only, P4B (10 µm or 50 µm), or isoxaben (2 nm). A) Cellulosic glucose content (in µg/mg AIR). B) Ratio between 5 and 24 h of the amount of C13-glucose incorporation into crystalline cellulose in Col0 and cesa3 pbr1 (pbr1) mutants treated with DMSO or 50 mm P4B. Bars represent Sd, *P < 0.05, **P < 0.01, Student's t test, n = 4 for each experiment.
Figure 4.
Figure 4.
P4B inhibits GFP-CESA3 delivery and affects its plasma membrane organization. Three-day-old dark-grown seedlings of GFP-CESA3/cesa3je5 (A to E) or LTI6-GFP (F, G) were transferred to Arabidopsis liquid medium containing 0.5% (v/v) DMSO or 100 µm P4B and incubated for 5 h. A, B) Representative single frame and time-projected images (10 min, 61 frames) of GFP-CESA3/cesa3je5 in 5 h mock and P4B-treated hypocotyl cells. Arrowheads indicate brighter punctae. B) Coverage of GFP-CESA3 particles in DMSO and P4B-treated hypocotyl cells after 5 h treatment. Error bars represent Se. ****P < 0.0001 Student's t test, n = 92 cells in each treatment. C) Distribution of velocities of GFP-CESA3/cesa3je5 in 5 h mock (mean velocity: 260 ± 53 nm/min) and P4B-treated (mean velocity: 276 ± 60 nm/min) hypocotyl cells. D) Representative time-course images of photobleaching of GFP-CESA3 in 5 h mock and treated P4B hypocotyl cells. E) Quantification of the rate of GFP-CESA3 recovery in the plasma membrane after photobleaching in 5 h mock and P4B-treated hypocotyl cells. The graph summarizes 3 independent experiments. Error bars represent Se. **P < 0.01 Student's t test, n = 15 cells in each treatment (1 cell imaged per seedling). F) Representative images of the plasma membrane marker, GFP-LTI6b, in mock and P4B-treated plants after 5 h treatment. G) Quantification of signal intensity from GFP-LTI6b signal represented in (F). Error bars represent Sen = 30 cells in each treatment. Scale bars = 10 µm.
Figure 5.
Figure 5.
In cesa3pbr1 mutant, the density and the velocity of CSC is restored. Three-day-old dark-grown seedlings of GFP-KOR1/korlit(A to C) or GFP-KOR1/korlitxcesa3pbr1(D to F) were transferred to Arabidopsis liquid medium containing 0.5% DMSO or 100 µm P4B and incubated for 5 h. A) Representative single frame and time-projected images (10 min, 61 frames) of GFP-KOR1 in 5 h mock- and P4B-treated korlit hypocotyl cells. B) Coverage of GFP-KOR1 particles in DMSO- and P4B-treated korlit hypocotyl cells after 5 h treatment. Error bars represent Se. ****P < 0.0001 Student's t test, n = 115 cells in each treatment. C) Distribution of GFP-KOR1 velocities in 5 h mock (mean velocity: 266 ± 73 nm/min) and P4B-treated hypocotyl cells (mean velocity: 258 ± 77 nm/min). Arrows indicate brighter puncta. D) Representative single frame and time-projected images (10 min, 61 frames) of GFP-KOR1/korlitxcesa3pbr1 in 5 h mock- and P4B-treated hypocotyl cells. E) Coverage of GFP-KOR1 particles in DMSO- and P4B-treated korlitxcesa3pbr1hypocotyl cells after 5 h treatment. Error bars represent Se, n = 115 cells in each treatment. F) Distribution of velocities of GFP-KOR1 in 5 h mock- (mean velocity: 297 ± 77 nm/min) and P4B-treated korlitxcesa3pbr1 hypocotyl cells (mean velocity: 289 ± 83 nm/min). Scale bars = 10 µm.
Figure 6.
Figure 6.
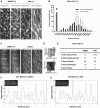
P4B affects the dynamic instability of CMT. Three-day-old dark-grown seedlings of EB1a-GFP (A to B), GFP-TUA6 (C to E), and GFP-MAP4 (F, G) were transferred to Arabidopsis liquid medium containing 0.5% DMSO or 100 µm P4B during 5 h. A) Representative single frame and time-projected images (2 min, 120 frames) of the EB1a-GFP marker in epidermal cells. Arrows indicate immobile foci. B) Distribution of the velocities of EB1 comets in epidermal cells (data from 40 cells from 20 plants with 629 measurements in mock samples and with 647 measurements in P4B-treated samples) calculated from kymographs extracted from the time series realized during these experiments. C) Representative single frame and time-projected images (2 min, 120 frames) of the GFP-TUA6 marker in epidermal cells after 5 h treatment. D) Representative image of a kymograph obtained from the time series realized during these experiments after mock (upper panel) and P4B (lower panel) treatment (2 min, 120 frames). E) Measurements of single CMT of plus-end growth phases in vivo. Measurements of 20 CMT in 5 cells in mock and P4B-treated samples. F) Representative image of GFP-MAP4 marker after 5 h DMSO treatment and the corresponding profile of intensity peaks along the line. G) Representative image of GFP-MAP4 marker after 5 h P4B treatment and the corresponding profile of intensity peaks along the line. Scale bars = 10 µm.
Figure 7.
Figure 7.
P4B promotes microtubule reorientation but does not affect microtubule–CSC interaction. Single frame images (A) and quantification of the angle of GFP-CESA3 trajectories or CMTs (B) of epidermal cells of 3-d-old etiolated hypocotyls expressing GFP-CESA3 and RFP-MBD after 5 h mock or 100 µm P4B treatment. Scale bar = 10 µm. Error bars represent Se. **P < 0.01 Student's t test, n = 15 cells in each treatment.

Similar articles

Cited by

References

    1. Albersheim P, Darvill A, Roberts K, Sederoff RR, Staehelin LA. Plant cell walls, from chemistry to biology. New York, USA: Garland Science; 2012. 10.1201/9780203833476 - DOI
    1. Barton DA, Vantard M, Overall RL. Analysis of cortical arrays from Tradescantia virginiana at high resolution reveals discrete microtubule subpopulations and demonstrate that confocal images of arrays can be misleading. Plant Cell. 2008:20(4):982–994. 10.1105/tpc.108.058503 - DOI - PMC - PubMed
    1. Bischoff V, Cookson SJ, Wu S, Scheible WR. Thaxtomin A affects CESA-complex density, expression of cell wall genes, cell wall composition, and causes ectopic lignification in Arabidopsis thaliana seedlings. J Exp Bot. 2009:60(3):955–965. 10.1093/jxb/ern344 - DOI - PMC - PubMed
    1. Brabham C, Lei L, Stork J, Barrett M, Gu Y, DeBolt S. Indaziflam herbicidal action: a potent cellulose biosynthesis inhibitor. Plant Physiol. 2014:166(3):1177–1185. 10.1104/pp.114.241950 - DOI - PMC - PubMed
    1. Bringmann M, Li E, Sampathkumar A, Kocabek T, Hauser MT, Persson S. POM-POM2/CELLULOSE SYNTHASE INTERACTING1 is essential for the functional association of cellulose synthase and microtubules in Arabidopsis. Plant Cell. 2012:24(1):163–177. 10.1105/tpc.111.093575 - DOI - PMC - PubMed

MeSH terms

LinkOut - more resources