. 2024 Jun 4;134(14):e159569.
doi: 10.1172/JCI159569.

Antigen specificities and proviral integration sites differ in HIV-infected cells by timing of antiretroviral treatment initiation

Affiliations

Antigen specificities and proviral integration sites differ in HIV-infected cells by timing of antiretroviral treatment initiation

Jaimy Joy et al. J Clin Invest. .

Abstract

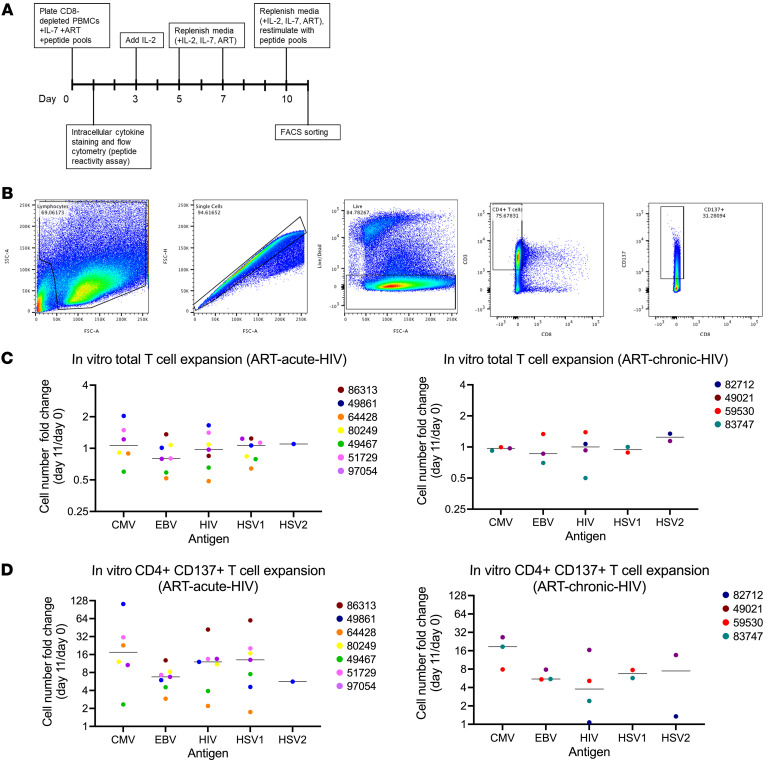
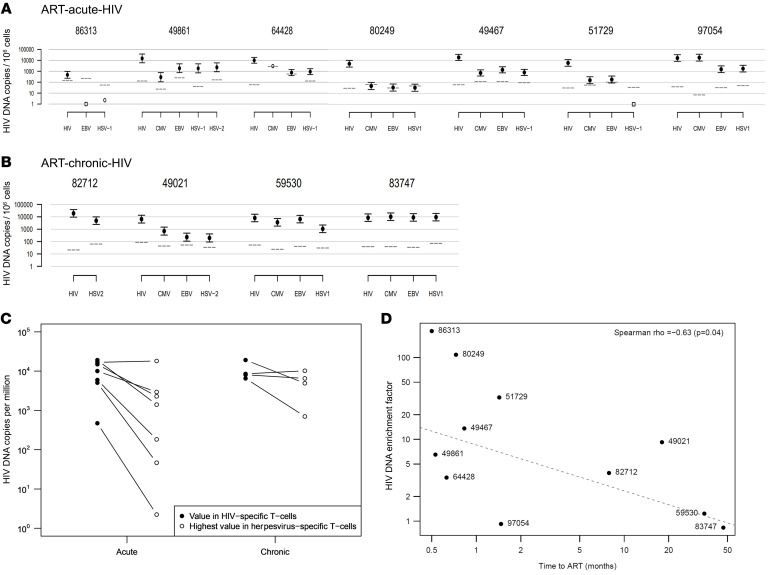
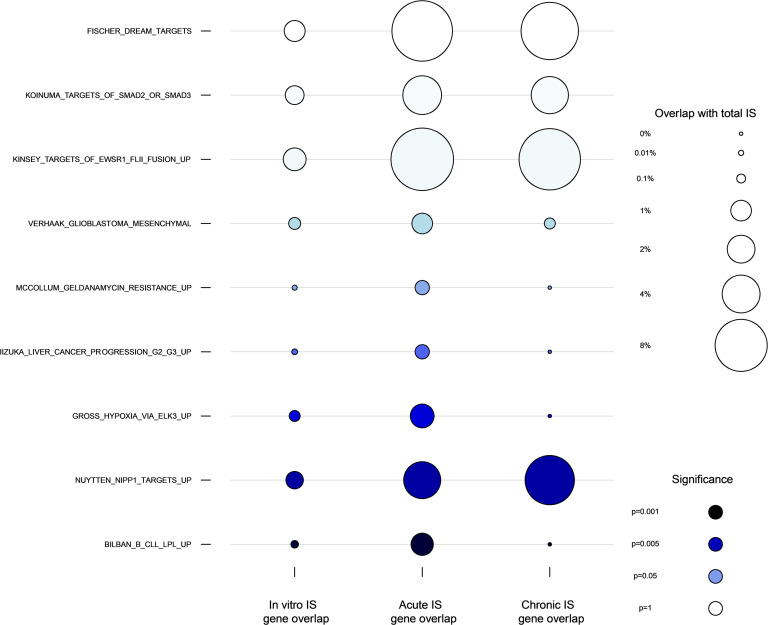
Despite effective antiretroviral therapy (ART), persons living with HIV harbor reservoirs of persistently infected CD4+ cells, which constitute a barrier to cure. Initiation of ART during acute infection reduces the size of the HIV reservoir, and we hypothesized that in addition, it would favor integration of proviruses in HIV-specific CD4+ T cells, while initiation of ART during chronic HIV infection would favor relatively more proviruses in herpesvirus-specific cells. We further hypothesized that proviruses in acute ART initiators would be integrated into antiviral genes, whereas integration sites (ISs) in chronic ART initiators would favor genes associated with cell proliferation and exhaustion. We found that the HIV DNA distribution across HIV-specific versus herpesvirus-specific CD4+ T cells was as hypothesized. HIV ISs in acute ART initiators were significantly enriched in gene sets controlling lipid metabolism and HIF-1α-mediated hypoxia, both metabolic pathways active in early HIV infection. Persistence of these infected cells during prolonged ART suggests a survival advantage. ISs in chronic ART initiators were enriched in a gene set controlling EZH2 histone methylation, and methylation has been associated with diminished long terminal repeat transcription. These differences that we found in antigen specificities and IS distributions within HIV-infected cells might be leveraged in designing cure strategies tailored to the timing of ART initiation.

Keywords: AIDS/HIV; Antigen; Cytokines; T cells; Virology.


Figures

Figure 1
Figure 1. Peptide antigen stimulation and CD3+CD8CD137+ cell expansion in vitro.
(A) Experimental schema. CD8+ T cell–depleted PBMCs were incubated with anti-CD3/anti-CD28 Dynabeads (positive control), media alone (negative control), or peptide antigens derived from HIV, CMV, EBV, HSV1, or HSV2 (see Table 2) for 10 days, all with efavirenz, raltegravir, and IL-7 (ART). On day 3, IL-2 was added to the cultures. On days 5, 7, and 10, the media, ART, and growth factors were replenished. On day 10, cells were restimulated with peptide antigens to upregulate activation markers for cell sorting. Following 24 hours of restimulation, cells were harvested for intracellular cytokine staining and flow cytometry to assess reactivity to each antigen, i.e., “antigen discovery.” Cells were stained for CD3, CD8, and CD137 for cell sorting. CD8+ T cell–depleted PBMCs were plated on day 0, cultured as shown in A, and enumerated on day 11. (B) Representative flow cytometry plots for cell sorting based on CD3+CD8CD137+ cell surface expression. (C) Fold change of total cells on day 11 versus day 0 and (D) fold change of CD3+CD8CD137+ cells on day 11 versus day 0 are shown for individuals who initiated ART-chronic-HIV in left panels and for individuals who initiated ART-chronic-HIV in right panels. Horizontal lines indicate median of data points.
Figure 2
Figure 2. HIV DNA levels in antigen-specific CD4+ T cells of participants initiating ART during acute or chronic HIV infection.
(A and B) HIV DNA levels (y axis) in CD4+ T cells reactive (CD3+CD8CD137+) to HIV or various herpesviruses (x axis) 11 days after peptide antigen stimulation are shown for participants initiating ART during acute (A) or chronic (B) HIV infection. The ART-acute-HIV cohort (n = 7) was defined as 1.5 months or less between estimated time of infection and ART initiation and the ART-chronic-HIV cohort (n = 4) was defined as more than 6 months between estimated time of infection and ART initiation. HIV DNA loads were measured by amplification of HIV genomic regions (env, gag, LTR) multiplexed with the human gene transferrin gene (hTFR) by qPCR. HIV DNA is represented as LTR copies per 106 cells. Each solid circular symbol is the mean log(LTR/hTFR) of 2 replicate measures, with bars indicating 2 standard errors. When only one replicate was above the limit of detection, an open circular symbol is shown, and when neither replicate was above the limit of detection, an open square at 1 is shown. Dotted lines represent equivalent of 1 copy of HIV per million cells (see Methods). (C) Comparison of within-participant differences of HIV DNA in HIV-specific CD4+ T cells versus highest HIV DNA among herpesviruses-specific CD4+ T cells across ART-acute-HIV and ART-chronic-HIV groups. Wilcoxon’s P = 0.79. (D) The HIV DNA enrichment factor (y axis, defined as the HIV DNA load in HIV-specific cells divided by the herpesviruses-specific cells with the greatest HIV DNA load) versus time from acute HIV infection to ART initiation (x axis); Spearman’s δ (P = 0.04) shows a negative correlation.
Figure 3
Figure 3. HIV IS gene set enrichment analysis comparing ISs in gene pathways (GSEA) from in vitro acutely HIV-infected primary CD4+ T cells, ART-acute-HIV, and ART-chronic-HIV groups.
Three columns of bubbles represent the proportion of HIV ISs in the 9 gene sets (see Supplemental Table 4) from acute in vitro HIV infections of cells (leftmost column) (11, 27) compared to those we detected in the ART-acute-HIV and ART-chronic-HIV IS (center and rightmost columns). The size of the bubble indicates the magnitude of overlap between the gene set and unique ISs in each group and the color of the bubble represents the statistical significance of the acute versus chronic comparison. In vitro ISs are included in this plot to highlight the statistically significant difference in representation of ISs in the gene set in either ART-acute-HIV or ART-chronic-HIV versus in vitro (see Supplemental Table 4), which implies selection for HIV ISs in these gene sets over time on ART.

Similar articles

Cited by

References

    1. Ananworanich J, et al. HIV DNA set point is rapidly established in acute HIV infection and dramatically reduced by early ART. EBioMedicine. 2016;11:68–72. doi: 10.1016/j.ebiom.2016.07.024. - DOI - PMC - PubMed
    1. Ananworanich J, et al. How does the timing of antiretroviral therapy initiation in acute infection affect HIV reservoirs? Curr Opin HIV AIDS. 2015;10(1):18–28. doi: 10.1097/COH.0000000000000122. - DOI - PMC - PubMed
    1. Jain V, et al. Antiretroviral therapy initiated within 6 months of HIV infection is associated with lower T-cell activation and smaller HIV reservoir size. J Infect Dis. 2013;208(8):1202–1211. doi: 10.1093/infdis/jit311. - DOI - PMC - PubMed
    1. Archin NM, et al. Immediate antiviral therapy appears to restrict resting CD4+ cell HIV-1 infection without accelerating the decay of latent infection. Proc Natl Acad Sci U S A. 2012;109(24):9523–9528. doi: 10.1073/pnas.1120248109. - DOI - PMC - PubMed
    1. Strain MC, et al. Effect of treatment, during primary infection, on establishment and clearance of cellular reservoirs of HIV-1. J Infect Dis. 2005;191(9):1410–1418. doi: 10.1086/428777. - DOI - PubMed

MeSH terms