Observational Study
. 2024 Jun 4;9(13):e180750.
doi: 10.1172/jci.insight.180750.

Factors associated with immune responses to SARS-CoV-2 vaccination in individuals with autoimmune diseases

Affiliations
Observational Study

Factors associated with immune responses to SARS-CoV-2 vaccination in individuals with autoimmune diseases

Erik Anderson et al. JCI Insight. .

Abstract

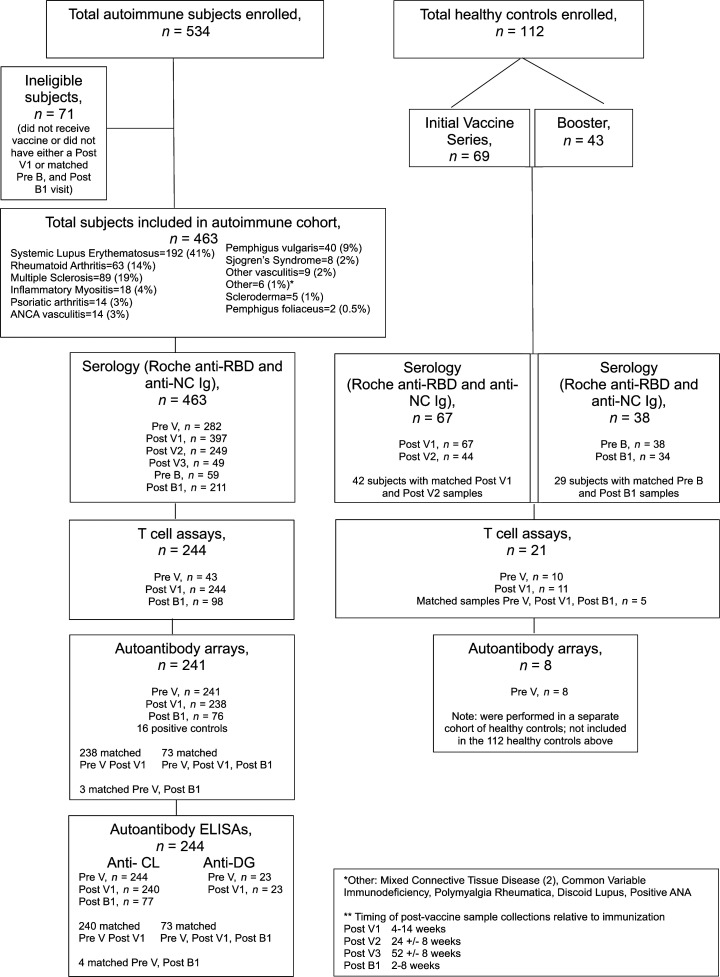
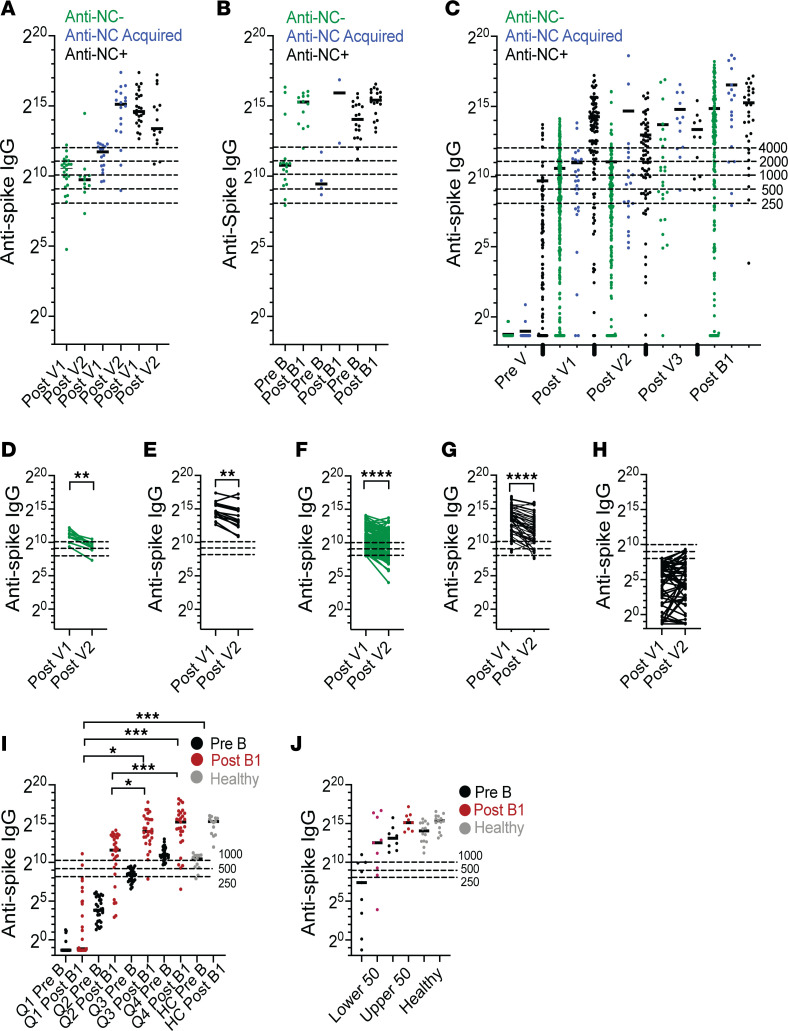
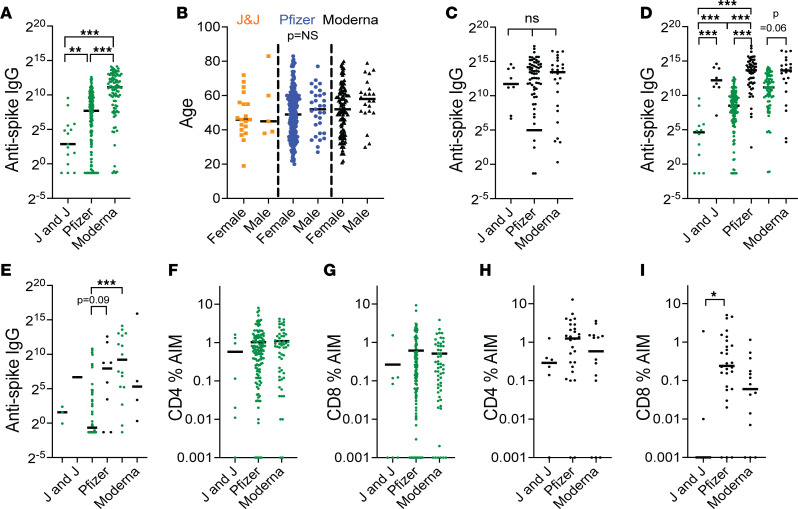
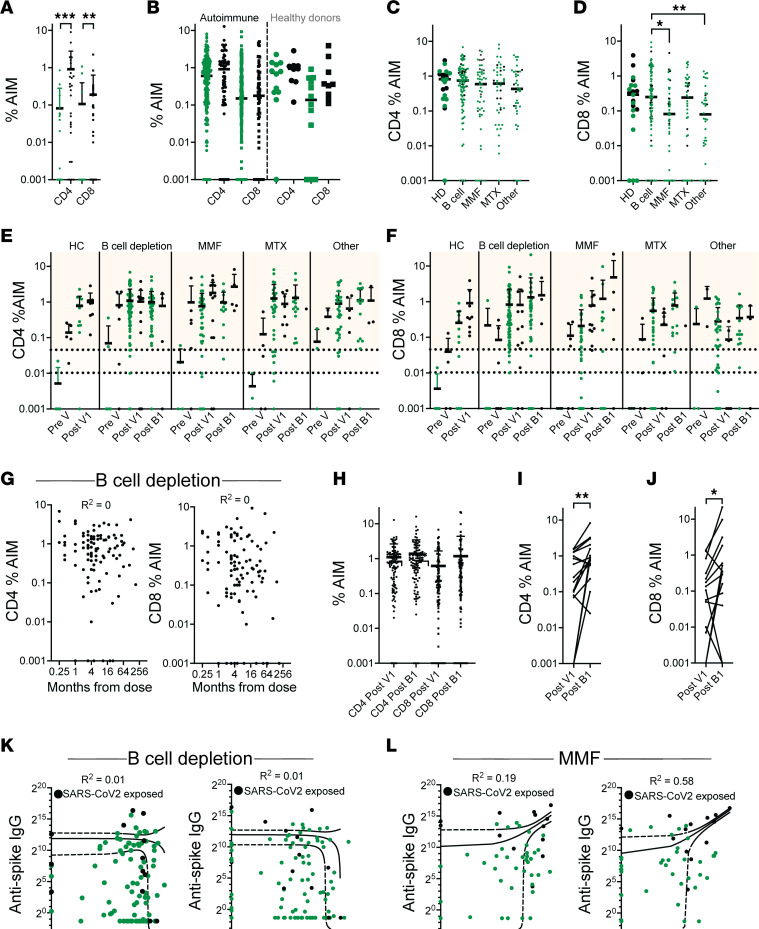
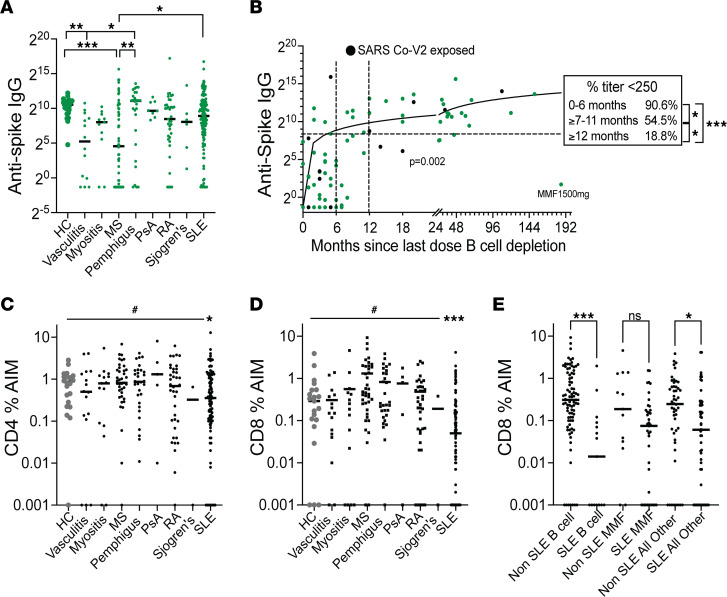
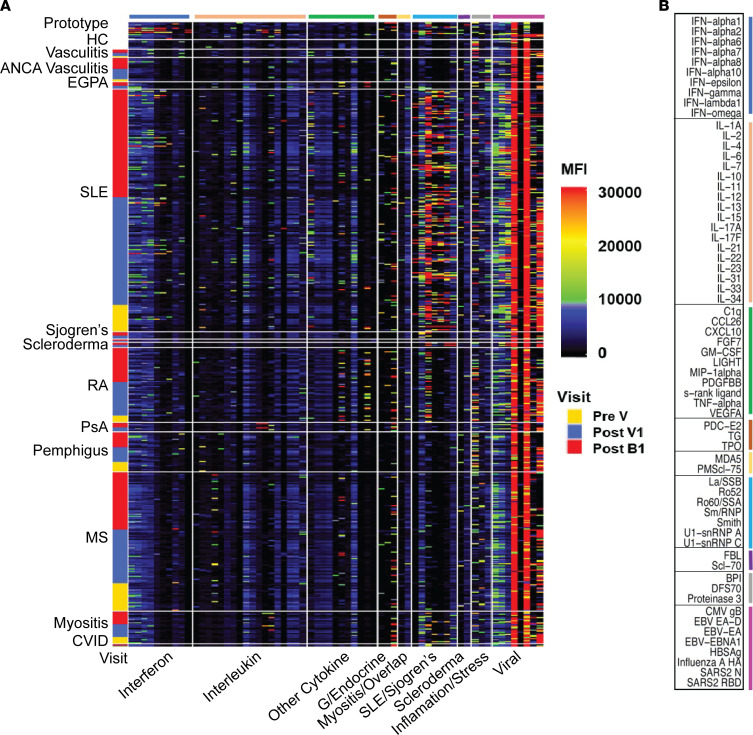
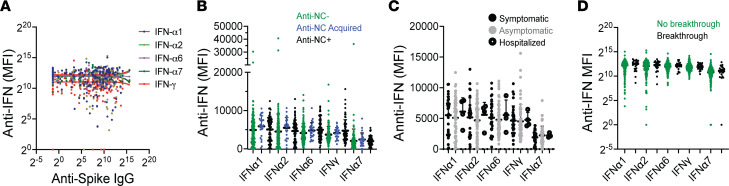
Patients with autoimmune diseases are at higher risk for severe infection due to their underlying disease and immunosuppressive treatments. In this real-world observational study of 463 patients with autoimmune diseases, we examined risk factors for poor B and T cell responses to SARS-CoV-2 vaccination. We show a high frequency of inadequate anti-spike IgG responses to vaccination and boosting in the autoimmune population but minimal suppression of T cell responses. Low IgG responses in B cell-depleted patients with multiple sclerosis (MS) were associated with higher CD8 T cell responses. By contrast, patients taking mycophenolate mofetil (MMF) exhibited concordant suppression of B and T cell responses. Treatments with highest risk for low anti-spike IgG response included B cell depletion within the last year, fingolimod, and combination treatment with MMF and belimumab. Our data show that the mRNA-1273 (Moderna) vaccine is the most effective vaccine in the autoimmune population. There was minimal induction of either disease flares or autoantibodies by vaccination and no significant effect of preexisting anti-type I IFN antibodies on either vaccine response or breakthrough infections. The low frequency of breakthrough infections and lack of SARS-CoV-2-related deaths suggest that T cell immunity contributes to protection in autoimmune disease.

Keywords: Autoimmune diseases; Autoimmunity.


Figures

Figure 1
Figure 1. Patient recruitment.
Flow chart of patients and analyses. Pre V, Prevaccine visit; Post V1, first visit 4–14 weeks after completion of first vaccine series; Post V2, second visit 24 ± 8 weeks after completion of first vaccine series; Post V3, third visit 52 ± 8 weeks after completion of first vaccine series; Pre-B, day of first booster; Post B1, visit 2–8 weeks after first booster.
Figure 2
Figure 2. Serological response to SARS-CoV-2 vaccination in patients with autoimmune diseases versus healthy controls according to SARS-CoV-2 exposure status.
Patients are divided into anti-nucleocapsid (anti-NC) IgG (green, no SARS-CoV-2 infection documented throughout the study), anti–NC Acquired (anti–NC Acq) (blue, SARS-CoV-2 infection documented at or after Post V2), and anti-NC+ (black, SARS-CoV-2 infection documented before initial vaccination) groups. (A and B) Anti–spike IgG levels (U/mL) in HC at each visit after the initial (A) and booster vaccination (B). (C) Anti–spike IgG levels in patients with autoimmune diseases at each visit before and after the initial vaccination and after booster vaccination. Statistical analyses are shown in Supplemental Figure 2. (D and E) Trajectory of anti–spike IgG levels after the initial vaccine series in anti-NC (D) and anti-NC+ (E) HC who responded to the initial vaccination. (F and G) Trajectory of anti–spike IgG levels after the initial vaccine series in anti-NC (F) and anti-NC+ (G) patients with autoimmune diseases who responded to the initial vaccination. (H) Trajectory of anti–spike IgG levels after the initial vaccine series in anti-NC patients with autoimmune diseases with an inadequate response (<250 U/mL). (I) Anti–spike IgG levels in anti-NC patients with autoimmune diseases versus HC before and after booster vaccination according to quartile of prebooster anti–spike IgG levels. (J) Anti–spike IgG levels in anti-NC+ patients with autoimmune diseases versus HC before and after booster vaccination according to the upper and lower 50th percentile of prebooster anti–spike IgG levels. Each data point represents an individual patient. (DG) Wilcoxon signed-rank test. (I and J) Kruskal-Wallis ANOVA with DSCF correction for multiple comparisons. *P < 0.05, **P < 0.01, ***P < 0.001, ****P < 0.0001. Timing of sample collections is shown in Figure 1.
Figure 3
Figure 3. Adaptive immune responses following different SARS-CoV-2 vaccines in anti-NC (green symbols) and anti-NC+ (black symbols) patients.
(A and B) Anti–spike IgG responses to different vaccines in anti-NC patients shows a better response to Moderna than to either Pfizer or Johnson & Johnson vaccines (A) that is not associated with differences in age or sex (B). (C) No difference in responses to the different vaccines in anti-NC+ patients. (D and E) Differences in anti-NC patients occur regardless of whether they were unexposed (D) or exposed (E) to B cell–depleting agents. (FI) CD4 (F and H) and CD8 (G and I) T cell responses to SARS-CoV-2 spike peptides in anti-NC (F and G) and anti-NC+ (H and I) patients by vaccine type. Each data point represents an individual patient. Kruskal-Wallis ANOVA with Dunn’s correction for multiple comparisons. *P < 0.05, **P < 0.01, ***P < 0.001.
Figure 4
Figure 4. T cell responses to SARS-CoV-2 peptides.
(A) CD4 and CD8 responses to spike peptides measured by activation-induced marker (AIM) assay in patients with autoimmune diseases before vaccination (A) and in HC and patients with autoimmune diseases at Post V1 (B) according to prior SARS-CoV-2 exposure. (C and D) CD4 (C) and CD8 (D) responses to spike peptides at Post V1 in patients with autoimmune diseases according to medication use. (E and F) CD4 (E) and CD8 (F) responses to spike peptides at sequential visits according to SARS-CoV-2 exposure and medication use. (G) No correlation between T cell responses to spike peptides at Post V1 and time since last dose of B cell depletion. (H) Change in CD4 and CD8 response to spike peptides after boosting in matched samples from the whole cohort. (I and J) Change in CD4 (I) and CD8 (J) response to spike peptides after boosting in matched samples from patients who were adherent to MMF treatment. (K and L) Correlation between T cell responses at Post V1 to spike peptides and anti–spike IgG values in patients treated with B cell depletion (K) or MMF (L). Each data point represents an individual patient. Anti-NC patients are shown as green symbols. Anti-NC+ patients are shown as black symbols. (A and D) Kruskal-Wallis ANOVA with Dunn’s correction for multiple comparisons. *P < 0.05, **P < 0.01, ***P < 0.001. (I and J) Mann Whitney U test. (EH, K, and L) Univariable linear mixed regression.
Figure 5
Figure 5. B and T cell responses to vaccination according to drug and diagnosis.
(A) Anti–spike IgG values at Post V1 in anti-NC patients according to diagnosis. (B) Correlation of IgG anti-spike responses (U/mL) with time since last dose of B cell–depleting drug. Each data point represents an individual patient. Anti-NC patients are in green, and anti-NC+ patients are in black. Simple linear regression, P = 0.002. Inset shows percentage of nonresponders for each time window. (C and D) CD4 (C) and CD8 (D) T cell responses at the Post V1 visit according to diagnosis. Statistics for the linear mixed regression model (#) are shown in the bar. (E) Comparison of CD8 percentage of AIM responses in patients with and without SLE separated by those taking or not taking B cell–depleting drugs or MMF. Each data point represents an individual patient. Results of the linear mixed regression model are shown. *P < 0.05, **P <0.01, ***P < 0.001.
Figure 6
Figure 6. Autoantibody MFI values remain stable throughout vaccine course, with rare exceptions.
(A) Heatmap representing serum IgG detected with an 83-plex array of cytokines and chemokines, traditional autoimmune-associated antigens, and viral antigens. Two hundred and forty-one vaccinated patients are represented and grouped into 1 of 15 different primary diagnoses. Within each diagnosis group, samples are clustered and annotated by the visit at which the sample was taken (Pre V, yellow; Post V1, blue; Post B1, red). Representative data from 16 prototype samples and 8 HC are included. ACE2 and CENPA were excluded from the analyses because of cross-reactivity. Only those analytes with values above 5,000 MFI are shown in the heatmap. Analytes in each group of antigens are color coded, and individual antigens in each group of antigens are shown in B. Comparisons were performed by either Mann-Whitney U test or linear mixed regression model.
Figure 7
Figure 7. Correlation of autoantibodies to IFNs, measured at Post V1, with anti–spike IgG and SARS-CoV-2 infections.
(A) No correlation of anti-IFN MFI with anti–spike IgG values. (B) No correlation of prior SARS-CoV-2 exposure with anti-IFN MFI. (C) No correlation of anti-IFN MFI with severity of prevaccination SARS-CoV-2 infections. (D) No correlation of anti-IFN MFI with frequency of breakthrough SARS-CoV-2 infections. Comparisons performed using Kruskal-Wallis ANOVA.

Similar articles

Cited by

References

    1. Akiyama S, et al. Prevalence and clinical outcomes of COVID-19 in patients with autoimmune diseases: a systematic review and meta-analysis. Ann Rheum Dis. 2021;80(3):384–391. doi: 10.1136/annrheumdis-2020-218946. - DOI - PubMed
    1. Guimarães LE, et al. Vaccines, adjuvants and autoimmunity. Pharmacol Res. 2015;100:190–209. doi: 10.1016/j.phrs.2015.08.003. - DOI - PMC - PubMed
    1. Teijaro JR, Farber DL. COVID-19 vaccines: modes of immune activation and future challenges. Nat Rev Immunol. 2021;21(4):195–197. doi: 10.1038/s41577-021-00526-x. - DOI - PMC - PubMed
    1. Zecca E, et al. Ongoing mycophenolate treatment impairs anti-SARS-CoV-2 vaccination response in patients affected by chronic inflammatory autoimmune diseases or liver transplantation recipients: results of the RIVALSA prospective cohort. Viruses. 2022;14(8):1766. doi: 10.3390/v14081766. - DOI - PMC - PubMed
    1. Spiera R, et al. Rituximab, but not other antirheumatic therapies, is associated with impaired serological response to SARS- CoV-2 vaccination in patients with rheumatic diseases. Ann Rheum Dis. 2021;80(10):1357–1359. doi: 10.1136/annrheumdis-2021-220604. - DOI - PubMed

Publication types

MeSH terms