Clinical Trial
. 2024 Jun 4;134(14):e173096.
doi: 10.1172/JCI173096.

CAR+ extracellular vesicles predict ICANS in patients with B cell lymphomas treated with CD19-directed CAR T cells

Affiliations
Clinical Trial

CAR+ extracellular vesicles predict ICANS in patients with B cell lymphomas treated with CD19-directed CAR T cells

Gianluca Storci et al. J Clin Invest. .

Abstract

BACKGROUNDPredicting immune effector cell-associated neurotoxicity syndrome (ICANS) in patients infused with CAR T cells is still a conundrum. This complication, thought to be consequent to CAR T cell activation, arises a few days after infusion, when circulating CAR T cells are scarce and specific CAR T cell-derived biomarkers are lacking.METHODSCAR+ extracellular vesicle (CAR+EV) release was assessed in human CD19.CAR T cells cocultured with CD19+ target cells. A prospective cohort of 100 patients with B cell lymphoma infused with approved CD19.CAR T cell products was assessed for plasma CAR+EVs as biomarkers of in vivo CD19.CAR T cell activation. Human induced pluripotent stem cell-derived (iPSC-derived) neural cells were used as a model for CAR+EV-induced neurotoxicity.RESULTSIn vitro release of CAR+EVs occurs within 1 hour after target engagement. Plasma CAR+EVs are detectable 1 hour after infusion. A concentration greater than 132.8 CAR+EVs/μL at hour +1 or greater than 224.5 CAR+EVs/μL at day +1 predicted ICANS in advance of 4 days, with a sensitivity and a specificity outperforming other ICANS predictors. ENO2+ nanoparticles were released by iPSC-derived neural cells upon CAR+EV exposure and were increased in plasma of patients with ICANS.CONCLUSIONPlasma CAR+EVs are an immediate signal of CD19.CAR T cell activation, are suitable predictors of neurotoxicity, and may be involved in ICANS pathogenesis.TRIAL REGISTRATIONNCT04892433, NCT05807789.FUNDINGLife Science Hub-Advanced Therapies (financed by Health Ministry as part of the National Plan for Complementary Investments to the National Recovery and Resilience Plan [NRRP]: E.3 Innovative health ecosystem for APC fees and immunomonitoring).

Keywords: Hematology; Immunology; Immunotherapy; Lymphomas.


Figures
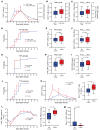
Figure 1
Figure 1. Kinetics of peripheral blood CAR+T cells and CAR_DNA copies in CAR T cell–infused patients.
(A) Peripheral blood kinetics of CAR+T cells (n = 37) and CAR_DNA copies (n = 41), assessed by MFC and ddPCR, respectively (mean ± SEM). (B) Expansion peak values of CAR+T cells (n = 36) and CAR_DNA copies (n = 40). (C) AUC0–30 value estimates for CAR+T cells (n = 36) and CAR_DNA copies (n = 40). (D) Kaplan-Meier (KM) estimate of time to peak (TTP) for CAR+T cells (n = 37) and CAR_DNA copies (n = 41). (E) CAR+T cell expansion peak values in NO ICANS (n = 25) versus ICANS (n = 11); Mann-Whitney (MW) test. (F) CAR+T cell AUC0–30 value estimate in NO ICANS (n = 25) versus ICANS (n = 11); MW test. (G) KM estimate of CAR+T cell TTP in NO ICANS (n = 25) versus ICANS (n = 12); log-rank test. (H) Expansion peak values of CAR_DNA copies in NO ICANS (n = 29) versus ICANS (n = 11); MW test. (I) AUC0–30 value estimates for CAR_DNA copies in NO ICANS (n = 29) versus ICANS (n = 11); MW test. (J) KM estimate of TTP for CAR_DNA copies in NO ICANS (n = 29) versus ICANS (n = 12); log-rank test. (K) Peripheral blood kinetics of CAR+T cells in NO ICANS (n = 25) versus ICANS (n = 12), and day +7 CAR+T cells in NO ICANS (n = 25) versus ICANS (n = 11); MW test. (L) Kinetics of CAR_DNA copies (mean ± SEM) in NO ICANS (n = 29) versus ICANS (n = 12), and day +7 CAR_DNA copies in NO ICANS (n = 29) versus ICANS (n = 7); MW test. (M) Day +1 CAR_DNA copies in NO ICANS (n = 29) versus ICANS (n = 12); MW test. Unless otherwise indicated, data are presented as boxes and whiskers; boxes show median and interquartile range (IQR), and whiskers represent minimum and maximum values.
Figure 2
Figure 2. IL-15 and CX3CL1/CX3CR1 interplay in ICANS and NO ICANS patients.
(A) Day +1 IL-15 plasma levels in NO ICANS (n = 21) versus ICANS (n = 11); MW test. (B) Day +1 CX3CL1 plasma levels in NO ICANS (n = 36) versus ICANS (n = 17); MW test. (C and D) Heatmaps (Pearson’s r coefficients) of day +1 IL-15 and CX3CL1 plasma levels and biochemical profile at pre-lymphodepletion (_PLD) (C) and day +1 (_+1) (D). (E) Day +1 IL-15 plasma levels in patients treated with chemotherapy as bridging therapy (Chemo, n = 13) versus others (No chemo, n = 19); MW test. (F) Day +1 plasma CX3CL1 in No chemo (n = 36) versus Chemo (n = 17); MW test. (GI) CX3CR1 mean fluorescence intensity (MFI) and percentage of CX3CR1+ cells in bag leftover (BL, n = 9) and 19BBζ.CAR T cells (n = 3) (G), 19BBζ.CAR T cells cocultured with CD19+ or CD19K562 cells (n = 3) for 1 hour (logFC t test and paired t test; mean ± SD) (H), and day +5 and day +7 peripheral blood CD19.CAR T cells in ICANS (n = 1) and NO ICANS (n = 3, 1-sample t test; mean ± SD) (I). Unless otherwise indicated, data are presented as boxes and whiskers; boxes show median and IQR, and whiskers represent minimum and maximum values.
Figure 3
Figure 3. MFC analysis of CAR+EVs in the supernatants of 19BBζ.CAR T or 19BBζ.eGFP.CAR T cells cocultured with CD19+ target cells.
MFC analysis of CAR+EVs released in vitro in coculture supernatants of 19BBζ.CAR T or 19BBζ.eGFP.CAR T cells with CD19+ target cells. (A and B) Representative scatter plots. (C) CAR+EV kinetics for each coculture (19BBζ.CAR T cells, n = 4; 19BBζ.eGFP.CAR T cells, n = 3). (D) CAR+EVs in 19BBζ.CAR T and 19BBζ.eGFP.CAR T cell cocultures (n = 7) at different time points and at peak level (logFC t test; P values ≤ 0.02 were considered significant according to Benjamini-Hochberg correction for multiple comparisons). Data are presented as boxes and whiskers; boxes show median and IQR, and whiskers represent minimum and maximum values.
Figure 4
Figure 4. Combined confocal/STORM analysis of 19BBζ.CAR T and 19BBζ.eGFP.CAR T cells and CAR+EVs.
(A) Analysis of 19BBζ.eGFP.CAR T cell coculture supernatants (24 hours): 19BBζ.eGFP.CAR protein (eGFP.CAR; green, wide-field signal) and CD63/CD9/CD81 pool (red, STORM signal). Scale bars: 500 nm (n = 6). (B) 19BBζ.CAR T cell coculture supernatants (24 hours): 2D-STORM analysis of anti-CD19.CAR Ab–mediated pull-down CAR+EVs (CAR; red; scale bar: 500 nm); 3D-STORM analysis of a single CAR+EV (colors represent Z-depth; scale bar: 50 nm). White arrowheads highlight CD19.CAR antigen clusters on the EV (n = 17). (C) 3D-STORM analysis (colors represent Z-depth; scale bar: 50 nm) of CAR T cell supernatants purified by size-exclusion chromatography. White arrowheads highlight CD19.CAR antigen clusters on the EV (n = 3). (D) Schematic representation of the combined confocal/STORM analysis workflow. (E) Combined confocal/STORM analysis with 3D rendering of a 19BBζ.CAR T cell (CAR, red; DAPI, blue); detail of a CAR+ intracellular vesicle observed in 2D- and 3D-STORM (blue box, magnification ×13) (n = 3). Scale bars: 5 μm and 50 nm. (F) Confocal microscopy imaging of a 19BBζ.CAR T cell (CAR, red; CD63, green; DAPI, blue). Colocalization details (blue box, ×3 magnification; purple box, ×22 magnification) measured by Manders’ overlap coefficients (CD63 over CAR, and CAR over CD63, n = 13, MW test) (n = 7). Scale bars: 5 μm, 3 μm, and 0.3 μm. (G) Combined microscopy of 19BBζ.eGFP.CAR T cells: confocal imaging of eGFP.CAR (green) and DAPI (blue), and correlative wide-field (eGFP.CAR, green)/STORM analysis (CD63, white, and CAR, red). Colocalization details (blue boxes, magnification ×2) measured by Manders’ overlap coefficients (CD63 over CAR, and CAR over CD63, n = 5, MW test) (n = 2). Scale bars: 5 μm. Data are presented as boxes and whiskers; boxes show median and IQR, and whiskers represent minimum and maximum values.
Figure 5
Figure 5. Plasma CAR+EV phenotype by ExoView, MFC, and STORM analysis.
(A) Schematic representation of ExoView platform analysis: CD63-, CD9-, or CD81-immunocaptured CAR+EVs are triple-stained by PE–anti-CD19.CAR, Alexa Fluor 647–anti-CD63, and Alexa Fluor 488–anti-CD9 Abs. (BD) ExoView analysis of whole (n = 14; B) (see also Supplemental Figure 5A), 20,000g plasma fraction (n = 2; C), and 100,000g plasma fraction (n = 2; D). (E) Anti-CD19.CAR Ab–mediated pull-down of plasma CAR+EVs (n = 2). (F) Pie charts represent the tetraspanin profile of CAR+EVs analyzed in BE, as ratio of CD63+, CD81+, or CD9+ CAR+EVs to total CAR+EVs. (G) MFC analysis of plasma (n = 5) and BL (n = 2) CAR+EVs. (H) Plasma CAR+EV STORM analysis. Double-positive CAR+CD63+ EVs are shown (n = 6). Scale bars: 200 nm. Data are presented as boxes and whiskers; boxes show median and IQR, and whiskers represent minimum and maximum values.
Figure 6
Figure 6. Plasma CAR+EVs: early markers of ICANS.
(A) Day +1 plasma CAR+EVs measured by ExoView in NO ICANS (n = 8) versus ICANS (n = 6); MW test. (BE) Plasma CAR+EVs assessed by MFC in NO ICANS (n = 12) versus ICANS (n = 8): (B) Twenty-one-day kinetics (mean ± SEM; *P < 0.05, **P < 0.01, ***P < 0.001, multiple MW test). (C) AUC0–21 estimate value; MW test. (D) KM estimate of TTP; log-rank test. (E) Peak value; MW test. (F and G) MFC analysis of hour +1 plasma CAR+EVs in NO ICANS (n = 59) versus ICANS (n = 28) and day +1 plasma CAR+EVs in NO ICANS (n = 56) versus ICANS (n = 29), MW test (F); and respective ROC curve analysis (G). (H and I) MFC analysis of hour +1 plasma CAR+EVs in grade 0 (G0) to G1 ICANS (n = 67) versus G≥2 ICANS (n = 20) and day +1 plasma CAR+EVs in G0–G1 ICANS (n = 65) versus G≥2 ICANS (n = 20), MW test (H); and respective ROC curve analysis (I). Unless otherwise indicated, data are presented as boxes and whiskers; boxes show median and IQR, and whiskers represent minimum and maximum values.
Figure 7
Figure 7. Neuron-specific Enolase 2–positive NPs: markers of neural damage.
(A) Representative pictures of healthy donor iPSC-derived neural cells: neural precursor cells (NPCs) stained with Abs against Pax6 (green) and nestin (red), and enriched midbrain neurons stained with Abs against β3-tubulin (red) and NeuN (green) or Abs against tyrosine hydroxylase (TH; green) and β3-tubulin (red). Nuclei were counterstained with DAPI (blue) (n = 3). Scale bars: 50 μm. (B) MTT assay of iPSC-derived neural cells exposed to EVs from CD19+ cell supernatants (CTRL, n = 6) versus BL (n = 14). (C) MFC analysis of Enolase 2–positive (ENO2+) NP release by iPSC-derived neural cells exposed to EVs from CD19+ cell supernatants (CTRL, n = 4) versus BL (n = 4); MW test. (D and E) Day +5 analysis of plasma ENO2+NPs assessed by MFC (D) and miR-1246 assessed by ddPCR (E) in ICANS (n = 8) versus NO ICANS (n = 12); MW test. Data are presented as boxes and whiskers; boxes show median and IQR, and whiskers represent minimum and maximum values.

References

    1. June CH, Sadelain M. Chimeric antigen receptor therapy. N Engl J Med. 2018;379(1):64–73. doi: 10.1056/NEJMra1706169. - DOI - PMC - PubMed
    1. Neelapu SS, et al. Axicabtagene ciloleucel CAR T-cell therapy in refractory large B-cell lymphoma. N Engl J Med. 2017;377(26):2531–2544. doi: 10.1056/NEJMoa1707447. - DOI - PMC - PubMed
    1. Locke FL, et al. Axicabtagene ciloleucel as second-line therapy for large B-cell lymphoma. N Engl J Med. 2022;386(7):640–654. doi: 10.1056/NEJMoa2116133. - DOI - PubMed
    1. Jacobson CA, et al. Axicabtagene ciloleucel in relapsed or refractory indolent non-Hodgkin lymphoma (ZUMA-5): a single-arm, multicentre, phase 2 trial. Lancet Oncol. 2022;23(1):91–103. doi: 10.1016/S1470-2045(21)00591-X. - DOI - PubMed
    1. Schuster SJ, et al. Tisagenlecleucel in adult relapsed or refractory diffuse large B-cell lymphoma. N Engl J Med. 2019;380(1):45–56. doi: 10.1056/NEJMoa1804980. - DOI - PubMed

Publication types