. 2024 Jun 25;43(6):114289.
doi: 10.1016/j.celrep.2024.114289. Epub 2024 Jun 2.

Opposing tumor-cell-intrinsic and -extrinsic roles of the IRF1 transcription factor in antitumor immunity

Affiliations

Opposing tumor-cell-intrinsic and -extrinsic roles of the IRF1 transcription factor in antitumor immunity

Prabhat K Purbey et al. Cell Rep. .

Abstract

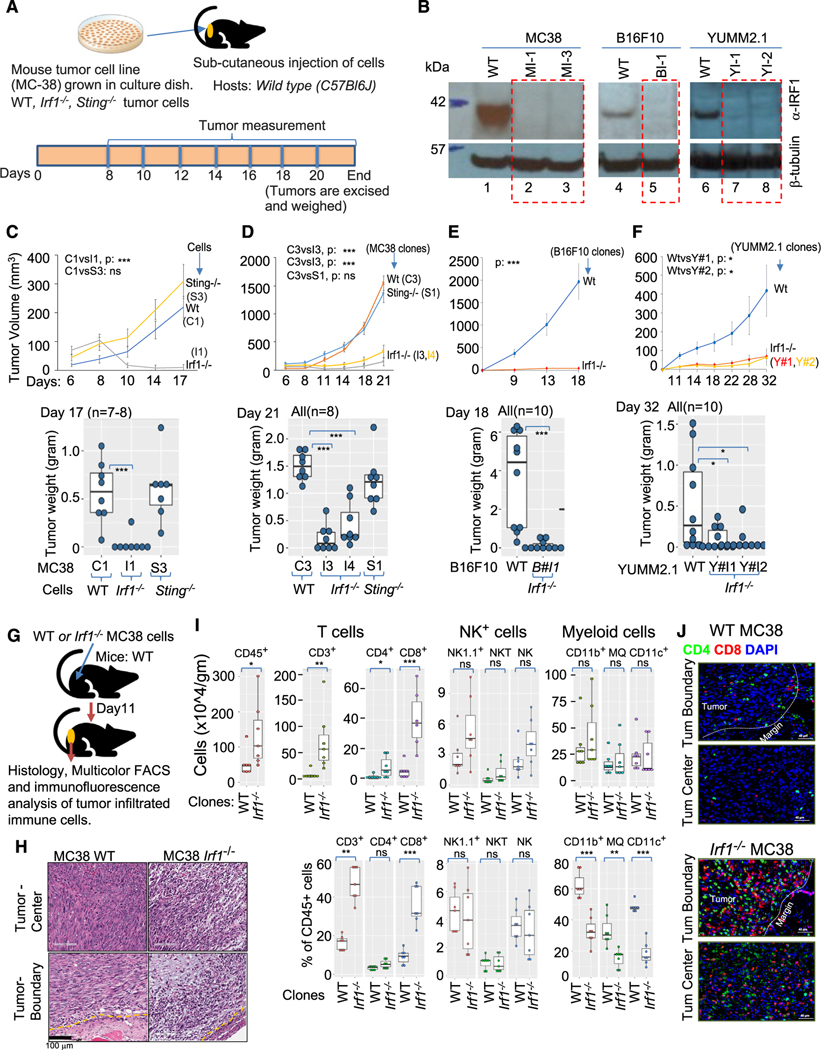
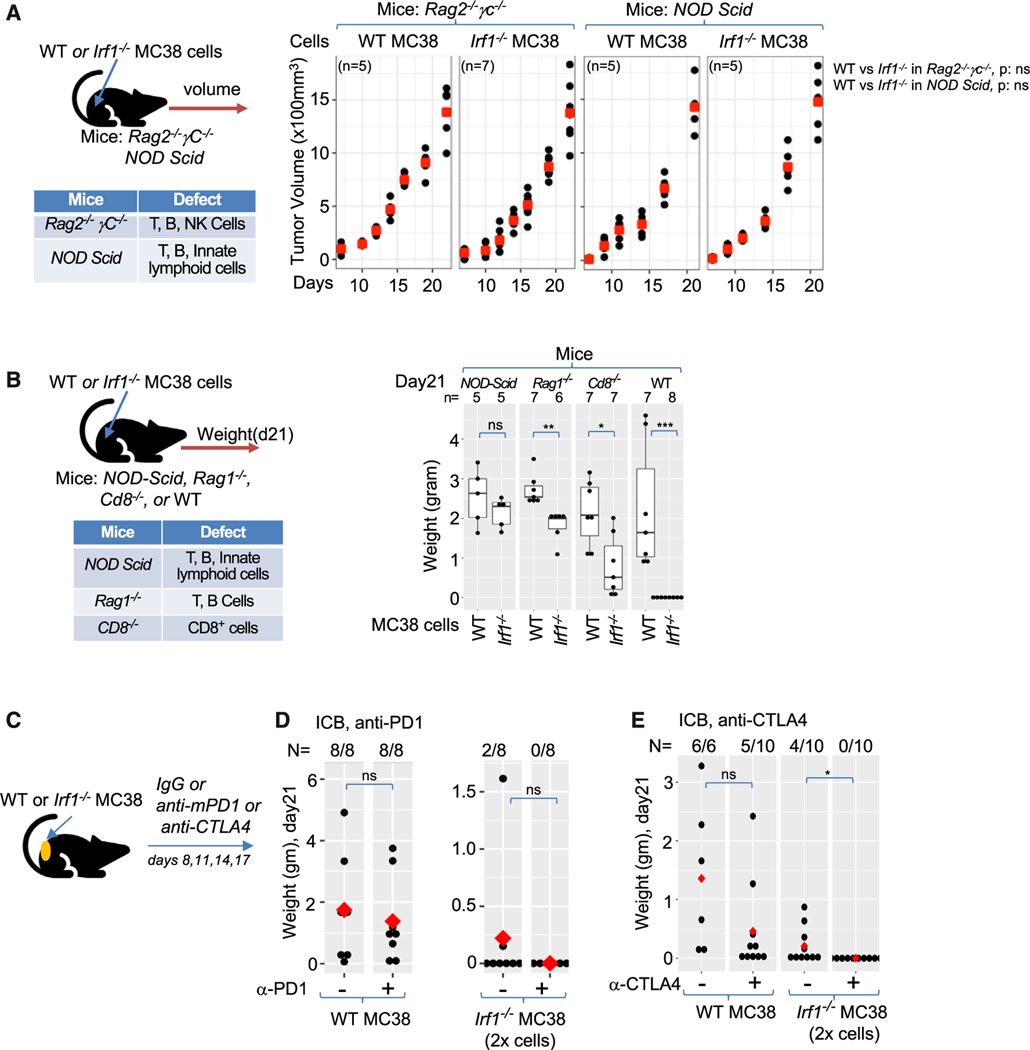
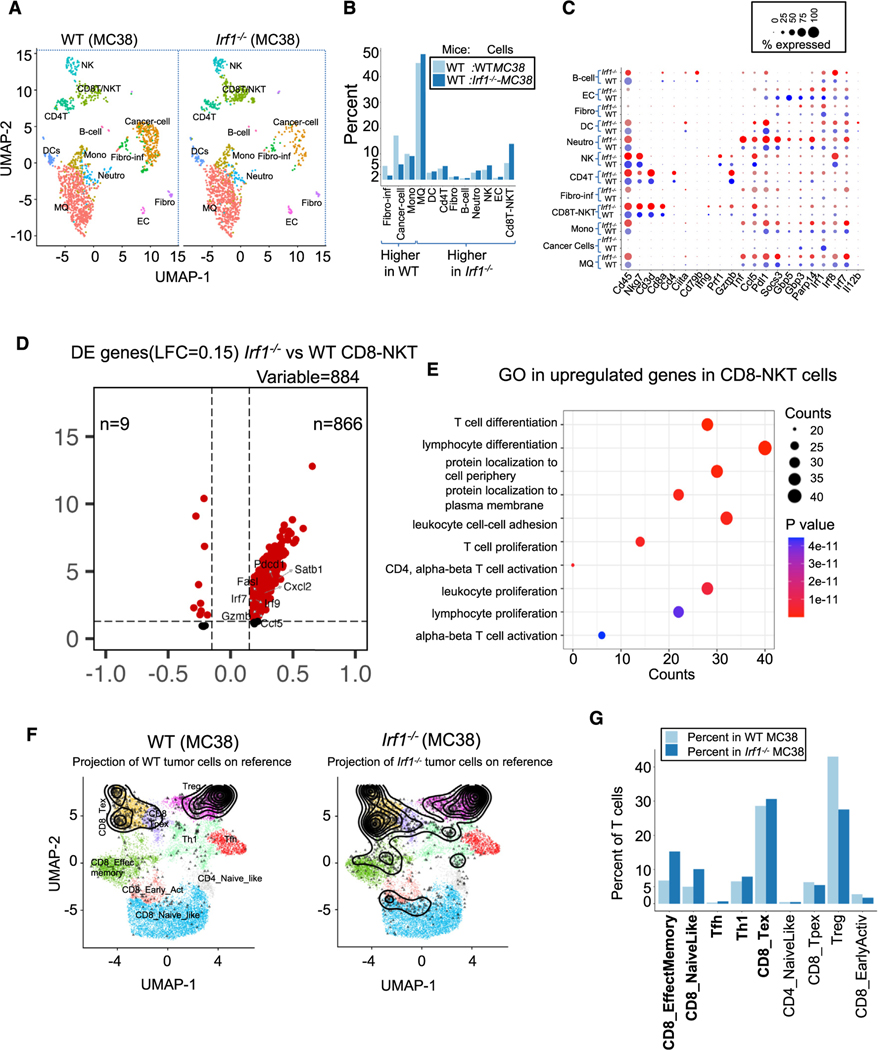
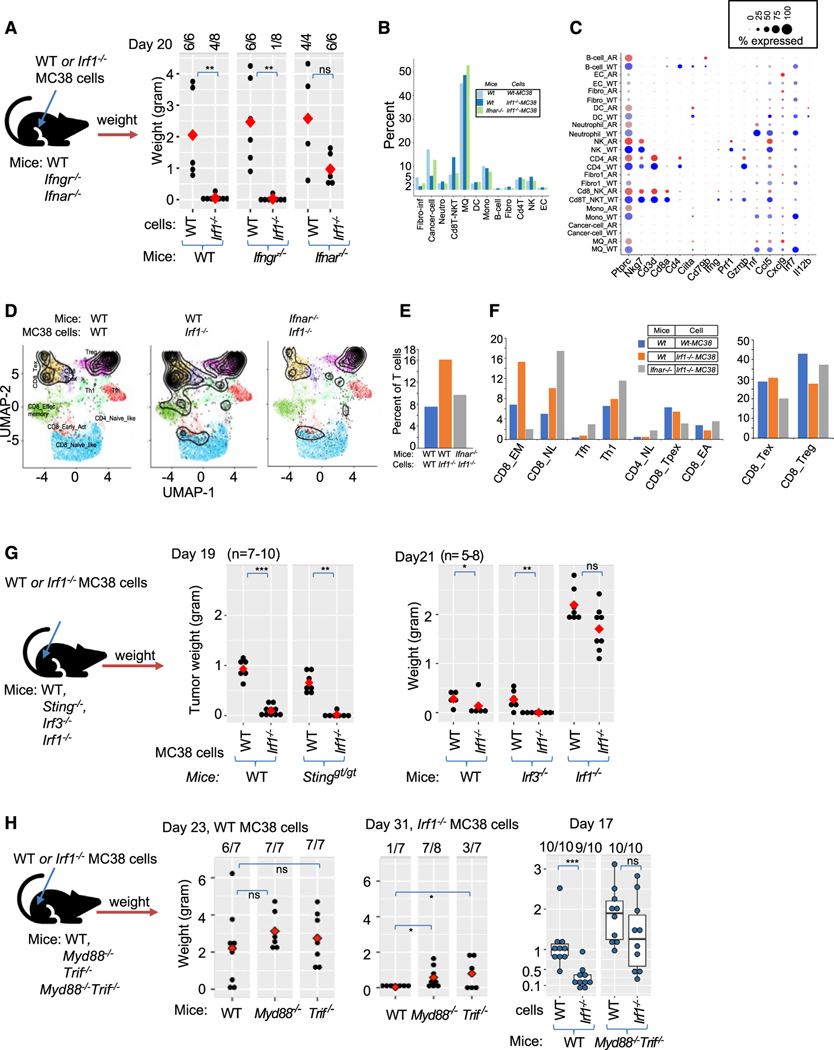
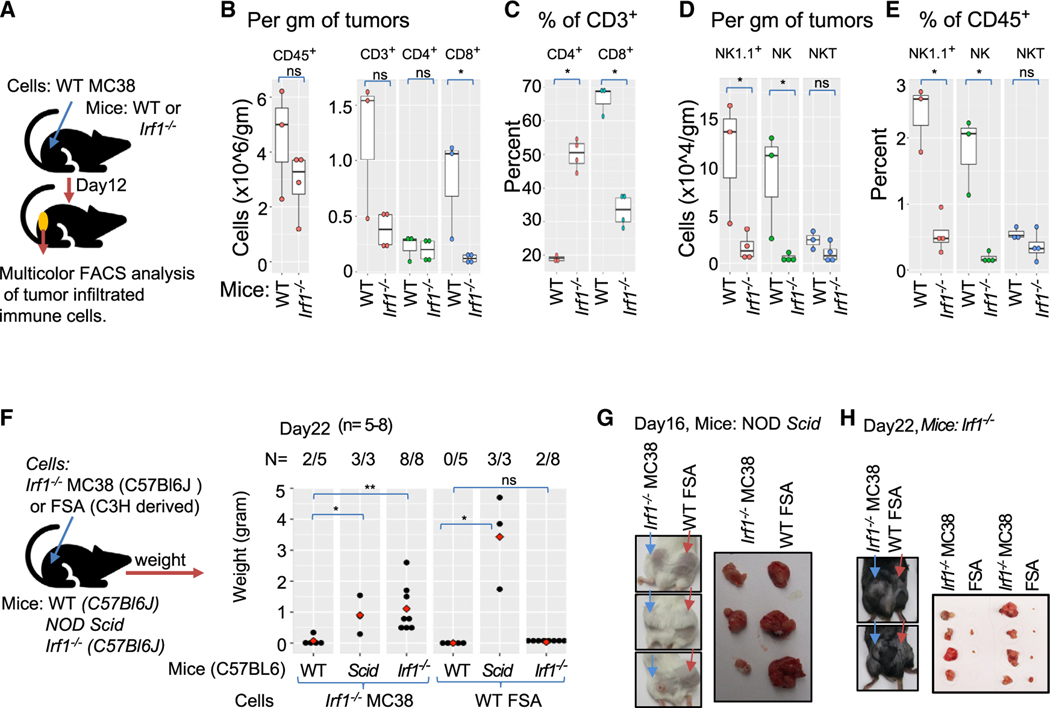
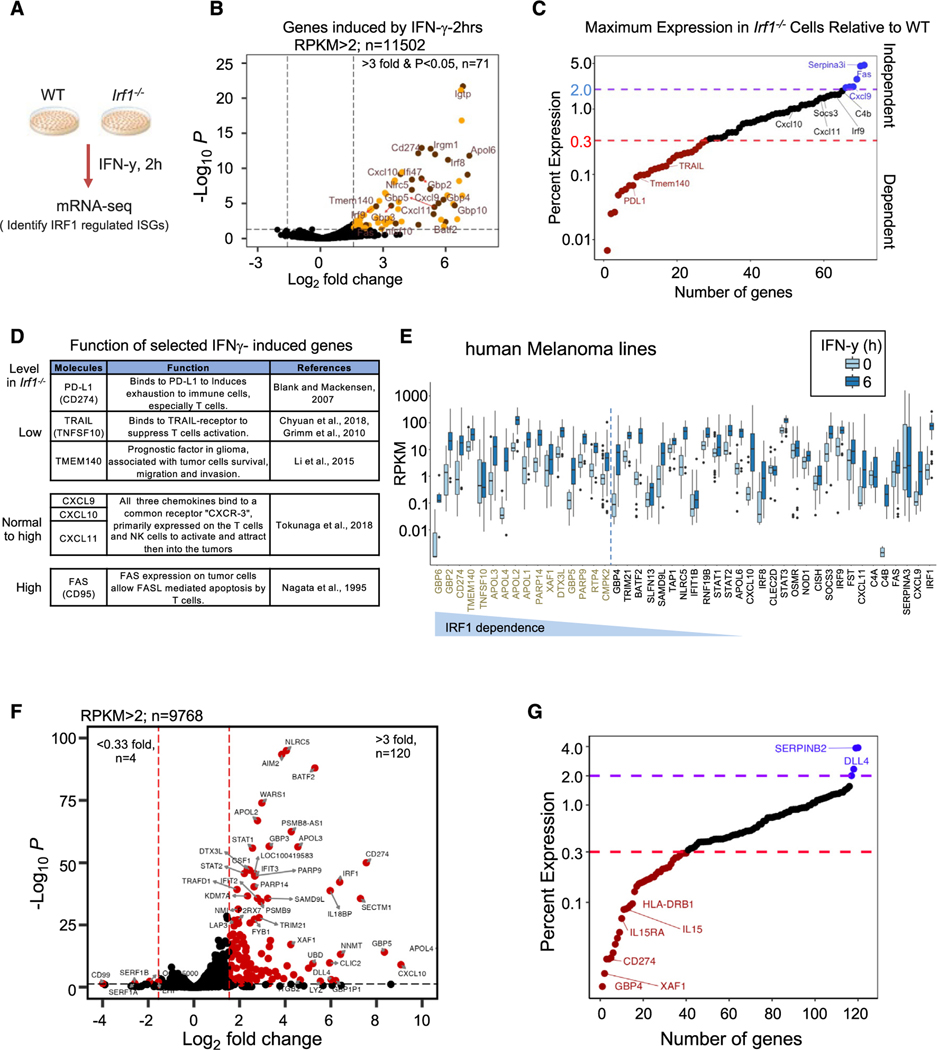
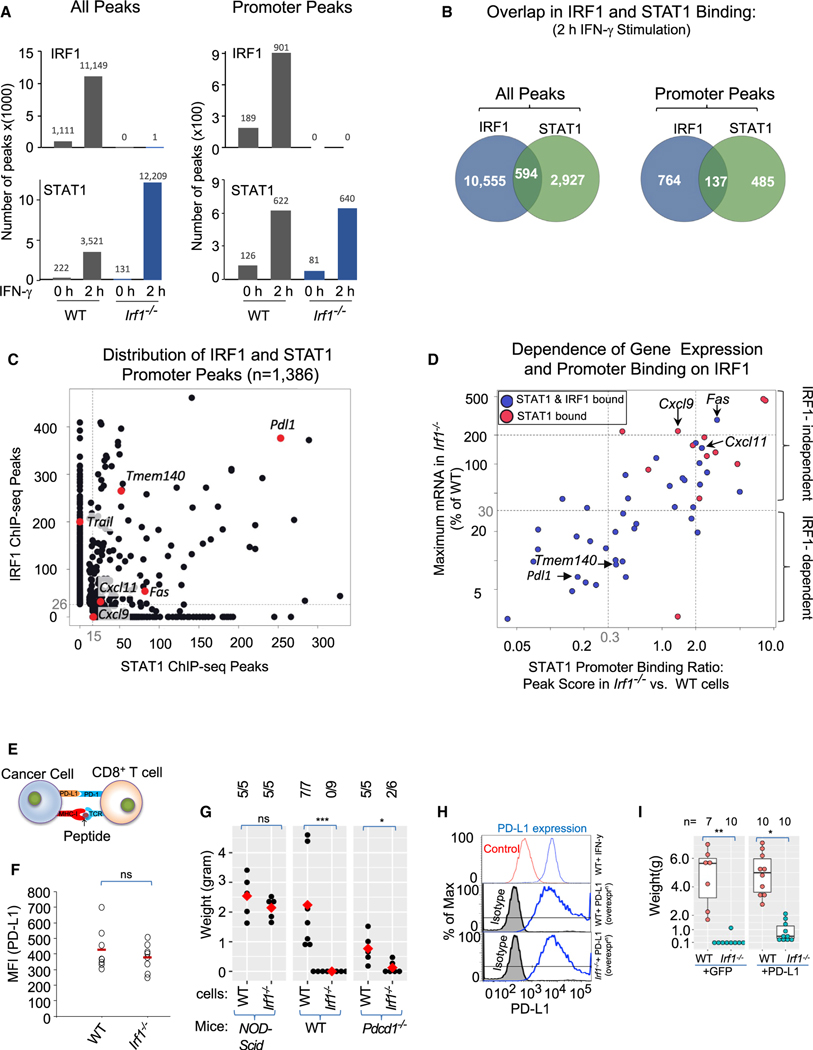
Type I interferon (IFN-I) and IFN-γ foster antitumor immunity by facilitating T cell responses. Paradoxically, IFNs may promote T cell exhaustion by activating immune checkpoints. The downstream regulators of these disparate responses are incompletely understood. Here, we describe how interferon regulatory factor 1 (IRF1) orchestrates these opposing effects of IFNs. IRF1 expression in tumor cells blocks Toll-like receptor- and IFN-I-dependent host antitumor immunity by preventing interferon-stimulated gene (ISG) and effector programs in immune cells. In contrast, expression of IRF1 in the host is required for antitumor immunity. Mechanistically, IRF1 binds distinctly or together with STAT1 at promoters of immunosuppressive but not immunostimulatory ISGs in tumor cells. Overexpression of programmed cell death ligand 1 (PD-L1) in Irf1-/- tumors only partially restores tumor growth, suggesting multifactorial effects of IRF1 on antitumor immunity. Thus, we identify that IRF1 expression in tumor cells opposes host IFN-I- and IRF1-dependent antitumor immunity to facilitate immune escape and tumor growth.

Keywords: CP: Cancer; CP: Immunology; IRF1; PD-L1 regulation; TLR signaling; antitumor immunity; cytotoxic T lymphocytes; immune checkpoint blockade; immune evasion; interferon signaling; scRNA-seq; transcription.


Conflict of interest statement

Declaration of interests K.M.C. reports being a shareholder in Geneoscopy and has received consulting fees from Geneoscopy, PACT Pharma, Tango Therapeutics, Flagship Labs 81, and the Rare Cancer Research Foundation. S.M.D. reports service on scientific advisory boards for LungLife AI and Early Diagnostics. A.R. has received honoraria from consulting with Amgen, Bristol Myers Squibb, and Merck; is or has been a member of the scientific advisory board and holds stock in Advaxis, Appia, Apricity, Arcus, Compugen, CytomX, Highlight, ImaginAb, ImmPact, ImmuneSensor, Inspirna, Isoplexis, Kite-Gilead, Lutris, MapKure, Merus, PACT, Pluto, RAPT Therapeutics, Synthekine, and Tango; and has received research funding from Agilent and from Bristol Myers Squibb through SU2C and patent royalties from Arsenal Bio. P.O.S. reports research support from Castle Biosciences, advisory board service for Castle Biosciences, and being a co-founder and shareholder of Tempo Therapeutics.

Figures

Figure 1.
Figure 1.. Increased infiltration of adaptive immune cells is associated with growth impairment of immunogenic Irf1−/− tumor
(A) Schematic representation of syngeneic tumor model. (B) Immunoblot using anti-IRF1 antibody (top panel) anti-β-tubulin (bottom panel) loading control showing loss of IRF1 expression in various CRISPR-Cas9 mutant tumor clones. (C) Upper panel shows growth kinetics of a representative experiment of WT (C1), Irf1−/− (I1), and Sting−/− (S3) MC38 clones in wild-type (C57BL/6J) hosts. Lower panel represents weight of tumors at termination of experiment in upper panel. (D) Upper panel shows tumor growth kinetics (average tumor volume) of additional WT (C3), Sting−/− (S1), and Irf1−/− (I3 and I4) MC38 clones in wild-type (C57BL/6J) hosts. Lower panel shows weight of tumors from panel above on day 21. (E) Upper panel shows growth kinetics of one each of WT and Irf1−/− B16F10 clones. Lower panel represents weight of tumors on day 18 from the experiment shown above. (F) Upper panel shows growth kinetics of one WT and two Irf1−/− YUMM2.1 clones. Lower panel represents weight of tumors on day 32 from the experiment above. For (C)–(F), p values were determined. Error bars represent mean ± standard error. *p ≤ 0.05; **p < 0.01; ***p < 0.001; ****p < 0.0001 by Mann-Whitney U/Wilcoxon rank-sum test or Student’s paired t test as appropriate. (G) Schematic representation of experimental approach for (H)–(J). (H) Histology of tumor center and tumor boundary from WT (top left, bottom left) and Irf1−/− (top right, bottom right) from WT (bottom left) and Irf1−/− (bottom right) MC38 tumors grown in WT mice. (I) Flow cytometry analysis of tumors for CD8+ and NK cells in the Irf1−/− MC38 tumors from WT (C57BL/6J) mice. Upper and lower panels represent immune cells/gram tumors and percent tumor CD45+ cells, respectively. p values were determined by a Mann-Whitney U/Wilcoxon rank-sum test or Student’s paired t test as appropriate. *p ≤ 0.05; **p < 0.01; ***p < 0.001; ****p < 0.0001. (J) Representative immunofluorescence photomicrographs of tumor boundary (top panel) and tumor center (bottom panel) of WT (upper) and Irf1−/− (lower) MC38 tumors in WT mice.
Figure 2.
Figure 2.. Generation of adaptive immune memory and ICB control of Irf1−/− tumors
(A) Schematic representation (top left panel) and of experimental design and table (bottom left panel) of immunological defects in indicated immunodeficient mice. Growth kinetics of WT and Irf1−/− MC38 tumors in Rag2−/− γC−/− (middle panel) and NOD/Scid (right panel) mice. (B) Experimental schema (top left panel) and table of immune deficiencies (bottom left panel). Right panel shows weight of WT and Irf1−/− MC38 tumors in various mouse strains after 21 days. (C) Experimental scheme for panels (D) and (E). (D) Effect of anti-PD-1 treatment on WT and Irf1−/− MC38 tumors. (E) Effect of anti-CTLA4 treatment on WT and Irf1−/− MC38 tumors. For (A)–(E), *p ≤ 0.05; **p < 0.01; ***p < 0.001; ****p < 0.0001 by Mann-Whitney U/Wilcoxon rank-sum test.
Figure 3.
Figure 3.. Enhanced effector T cell response in Irf1−/− tumors
(A) UMAP showing 12 distinct cell populations in WT and Irf1−/− tumors. (B) Percentage of indicated cell populations in WT and Irf1−/− tumors. (C) Dot plot showing expression of select cell-type-specific and immune activation genes in cells from WT and Irf1−/− tumors. (D) Differential expression (DE) of genes enriched in the CD8-NKT cell cluster. (E) Gene Ontology analysis of cells in the CD8-NKT cluster from Irf1−/− tumors. (F) Projection of T cells (black profile) from WT and Irf1−/− tumor scRNA-seq onto reference T cell atlas (colored distinct T cell states) from ProjectTILs. (G) Proportion of various T cell states in WT and Irf1−/− tumors as defined by the reference T cell atlas. All data were generated by comparison of scRNA-seq data pooled from 4 WT and 6 Irf1−/− mouse tumors.
Figure 4.
Figure 4.. Responsiveness to type I but not the type II interferon (IFN-γ) mediates Irf1−/− tumor control
(A) Experimental design (left) for test the role of host IFN-I and IFN-II in WT and Irf1−/− MC38 tumors. Right dot plot represents weight of WT and Irf1−/− MC38 tumors from mice on day 20. (B) Proportion of indicated cell populations among WT MC38 tumor grown in WT mice and Irf1−/− MC38 tumor grown in WT or Ifnar−/− mice. (C) Dot plot showing expression of activation markers and ISGs in distinct cell types from Irf1−/− MC38 tumor grown in WT or Ifnar−/− mice. (D) Projection of scRNA-seq data of T cells (black profile) from indicated tumors onto reference T cell atlas (colored distinct T cell states) from ProjectTILs. (E) Percentage of T cells mapped to reference T cell states in the scRNA-seq data from indicated tumors. (F) Proportion of various T cell states in the scRNA-seq data from the indicated tumors. (G) Left side shows the experimental scheme of upcoming experimental testing. Middle boxplot shows weight of WT and Irf1−/− MC38 tumor from WT and Stinggt/gt mice, and right boxplot shows weight of WT and Irf1−/− tumors in indicated mice. (H) Left side shows scheme of testing host TLR pathways in Irf1−/− tumors. First two dot plot panels show weight of WT (1st dot plot, day 23) and Irf1−/− (2nd dot plot, day 31) MC38 tumors in WT, Myd88−/−, and Trif−/− mice. Last boxplot shows weight of WT and Irf1−/− MC38 tumor in WT and Myd88−/−Trif−/− (double mutant) mice on day 17. For (A), (G), and (H) plots, *p ≤ 0.05; **p < 0.01; ***p < 0.001; ****p < 0.0001 by Mann-Whitney U/Wilcoxon rank-sum test.
Figure 5.
Figure 5.. IRF1 expression in the host microenvironment is required for the clearance of Irf1−/− tumors
(A) Experimental scheme for (B)–(E). (B) Left panel shows total CD45+ cells/gram of tumors, and right panel displays CD45+CD3+, CD3+CD4+, and CD3+CD8+ T cells/gram of WT tumors in WT or Irf1−/− mice. (C) Frequency of CD4+ and CD8+ T cells relative to CD3+ cells in WT tumors grown in WT (n = 3) and Irf1−/− mice (n = 4). (D) Infiltration of “total NK1.1+,” “NK,” and “NKT” cells per gram of WT tumors from WT and Irf1−/− mice. (E) Frequency of “total NK1.1”, “NK” and “NKT” cells relative to CD45+ cells infiltrated in WT tumors grown in WT (n = 3) and Irf1−/− (n = 4) mice. (F) Left panel: schematic representation of experimental setup to monitor for (F)–(H). Right panel: weight of Irf1−/− MC38 (syngeneic; first 3 columns) and FSA (allogeneic; last 3 columns) subcutaneous tumors grown in WT (C57Bl6/J), NOD/Scid, or Irf1−/− mice for 22 days. (G) Images of Irf1−/− MC38- or FSA-tumor-bearing mice (left panel) and harvested tumors (right panel) on day 16 in NOD/Scid mice. (H) Images of tumor-bearing mice (left panel) and harvested tumors (right panel) on day 22 in Irf1−/− mice. For (B)–(F) plots, *p ≤ 0.05; **p < 0.01; ***p < 0.001; ****p < 0.0001 by Mann-Whitney U/Wilcoxon rank-sum test.
Figure 6.
Figure 6.. IRF1 positively regulates a subset of IFN-γ-inducible genes that can promote the tumor progression
(A) Scheme of in vitro model of WT and Irf1−/− tumor cells, IFN-γ stimulation, and RNA-seq data analysis. (B) Volcano plot of expressed genes in MC38, B16F10, and YUMM2.1 cell lines induced with IFN-γ for 2 h (RPKM > 2, isoform removed, n = 11,502). Top-right quadrant shows 71 induced genes (red and gold dots are genes induced more than 3-fold; p < 0.05 from 5 control and 5 IFN-γ-treated datasets). (C) Dot plot display of average percent expression of IFN-γ-induced genes in Irf1−/− mutant clones relative to WT clones: red dotted line shows <30% expression and purple dotted line shows >200% expression in IFN-γ-stimulated Irf1−/− vs. WT tumor cells considered IRF1-dependent genes. Important IRF1-regulated genes (both up and down) are labeled. (D) Table detailing known function of important IFN-γ-induced genes and how they are regulated by IRF1. (E) RPKM distribution of basal and IFN-γ-stimulated genes from 43 human melanoma cell lines (5 ng/mL IFN-γ for 6 h). (F) Volcano plot of all the expressed genes in a representative human melanoma line (M238) induced with IFN-γ for 6 h (average RPKM > 2, isoform removed, n = 9,768). The top-right quadrant (red dots) shows genes induced >3-fold (n = 120) with p < 0.05 from two IFN-γ-treated datasets. (G) A dot plot display of average percent expression of IFN-γ-induced genes in Irf1−/− M238 (human melanoma cell line) relative to WT M238 cells.
Figure 7.
Figure 7.. ChIP-seq highlights distinct and co-operative binding of IRF-1 and STAT-1 at promoters to regulate distinct set of ISGs
(A) Bar graph represents number of genome-wide (left panels) and promoter (promoter = ±1 kb of transcription start site [TSS], right panels) ChIP-seq peaks for IRF1 (top graphs) and STAT1 (bottom graphs) in MC38 cells. (B) Venn diagram showing overlap of IRF1 and STAT1 binding in IFN-γ-stimulated cells at genome-wide (left) and promoter regions (right). (C) Scatterplot shows the distribution of IRF1 (Y axis ChIP-seq peak score) and STAT1 (X axis ChIP-seq peak score) promoter binding strength at IRF1-dependent (Pdl1, Trail, and Tmem140) and -independent (Cxcl9, Cxcl11, and Fas) genes. (D) Scatterplot showing dependence of gene expression (Y axis) and STAT1 binding (X axis) on IRF1 for a subgroup of ISGs that showed promoter STAT1 binding in IFN-γ-stimulated WT MC38 cells highlighting the dependence of STAT1 binding on IRF1 in the expression of IRF1-dependent (Pdl1, Tmem140, etc.) and -independent (Cxcl9, Cxcl11, Fas, etc.) genes. (E) Cartoon depicting context of PD-L1 in T cell function. (F) Dot plot showing surface expression of PD-L1 on cancer cells from WT (n = 8) and Irf1−/− (n = 8) tumors on day 12 (red horizontal bar = mean). (G) Dot plot showing weight of WT and Irf1−/− MC38 tumors in NOD/Scid, WT, or Pd1−/− mice. (H) Top panel shows the expression of PD-L1 at baseline (control) and post-IFN-γ stimulation. Middle and bottom panels show stable overexpression of PD-L1 in the WT and Irf1−/− MC38 cells. (I) Boxplot showing weight of tumors on day 23 from WT hosts injected with GFP or PD-L1 overexpressing WT and Irf1−/− MC38 cells. For (F), (G), and (I) plots, *p ≤ 0.05; **p < 0.01; ***p < 0.001; ****p < 0.0001 by Mann-Whitney U/Wilcoxon rank-sum test.

References

    1. Ribas A, and Wolchok JD (2018). Cancer immunotherapy using checkpoint blockade. Science 359, 1350–1355. 10.1126/science.aar4060. - DOI - PMC - PubMed
    1. Mittal D, Gubin MM, Schreiber RD, and Smyth MJ (2014). New insights into cancer immunoediting and its three component phases–elimination, equilibrium and escape. Curr. Opin. Immunol 27, 16–25. 10.1016/j.coi.2014.01.004. - DOI - PMC - PubMed
    1. Koebel CM, Vermi W, Swann JB, Zerafa N, Rodig SJ, Old LJ, Smyth MJ, and Schreiber RD (2007). Adaptive immunity maintains occult cancer in an equilibrium state. Nature 450, 903–907. 10.1038/nature06309. - DOI - PubMed
    1. Shankaran V, Ikeda H, Bruce AT, White JM, Swanson PE, Old LJ, and Schreiber RD (2001). IFNgamma and lymphocytes prevent primary tumour development and shape tumour immunogenicity. Nature 410, 1107–1111. 10.1038/35074122. - DOI - PubMed
    1. Dunn GP, Bruce AT, Sheehan KCF, Shankaran V, Uppaluri R, Bui JD, Diamond MS, Koebel CM, Arthur C, White JM, and Schreiber RD (2005). A critical function for type I interferons in cancer immunoediting. Nat. Immunol 6, 722–729. 10.1038/ni1213. - DOI - PubMed

Publication types