. 2024 Jun;132(6):67003.
doi: 10.1289/EHP14074. Epub 2024 Jun 4.

Effects of Developmental Lead and Phthalate Exposures on DNA Methylation in Adult Mouse Blood, Brain, and Liver: A Focus on Genomic Imprinting by Tissue and Sex

Affiliations

Effects of Developmental Lead and Phthalate Exposures on DNA Methylation in Adult Mouse Blood, Brain, and Liver: A Focus on Genomic Imprinting by Tissue and Sex

Rachel K Morgan et al. Environ Health Perspect. 2024 Jun.

Abstract

Background: Maternal exposure to environmental chemicals can cause adverse health effects in offspring. Mounting evidence supports that these effects are influenced, at least in part, by epigenetic modifications. It is unknown whether epigenetic changes in surrogate tissues such as the blood are reflective of similar changes in target tissues such as cortex or liver.

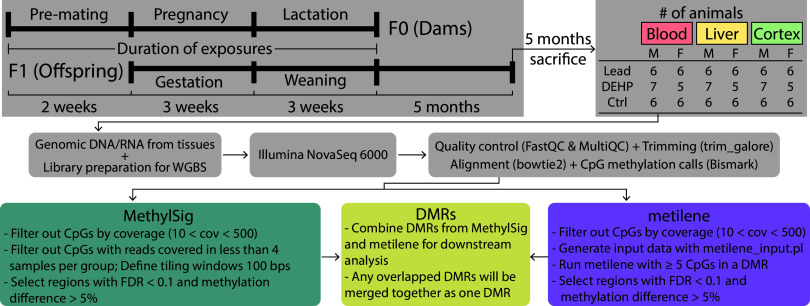
Objective: We examined tissue- and sex-specific changes in DNA methylation (DNAm) associated with human-relevant lead (Pb) and di(2-ethylhexyl) phthalate (DEHP) exposure during perinatal development in cerebral cortex, blood, and liver.

Methods: Female mice were exposed to human relevant doses of either Pb (32 ppm) via drinking water or DEHP (5mg/kg-day) via chow for 2 weeks prior to mating through offspring weaning. Whole genome bisulfite sequencing (WGBS) was utilized to examine DNAm changes in offspring cortex, blood, and liver at 5 months of age. Metilene and methylSig were used to identify differentially methylated regions (DMRs). Annotatr and ChIP-enrich were used for genomic annotations and gene set enrichment tests of DMRs, respectively.

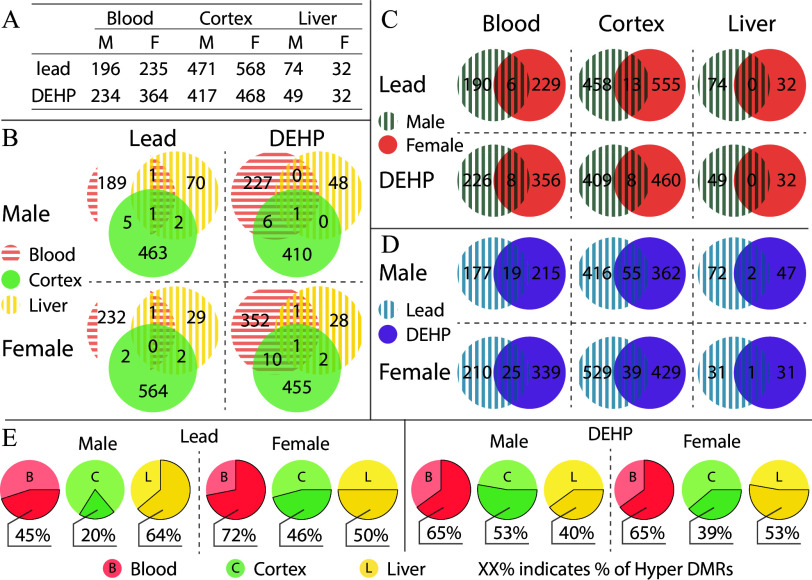
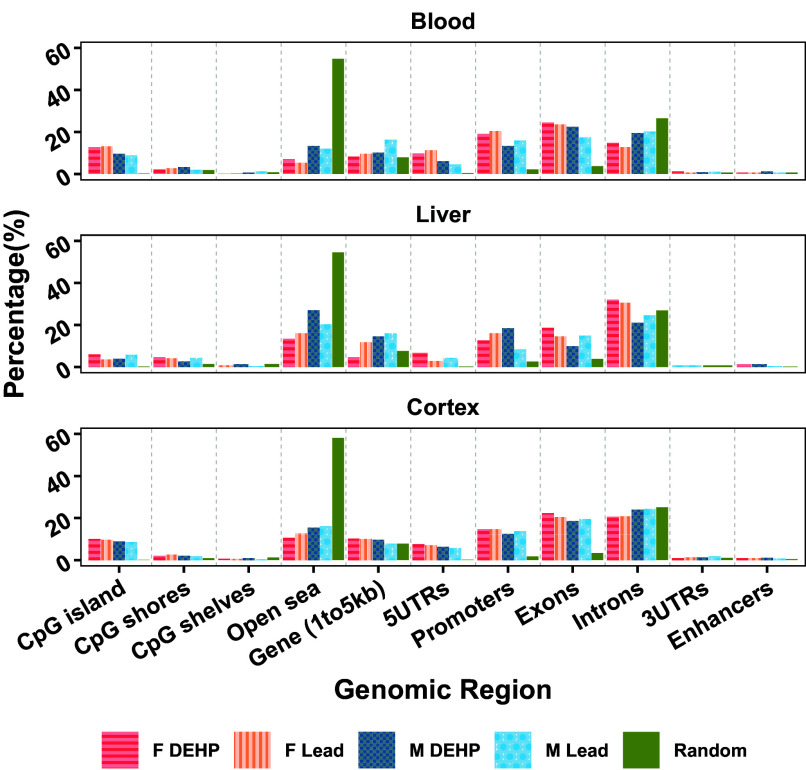
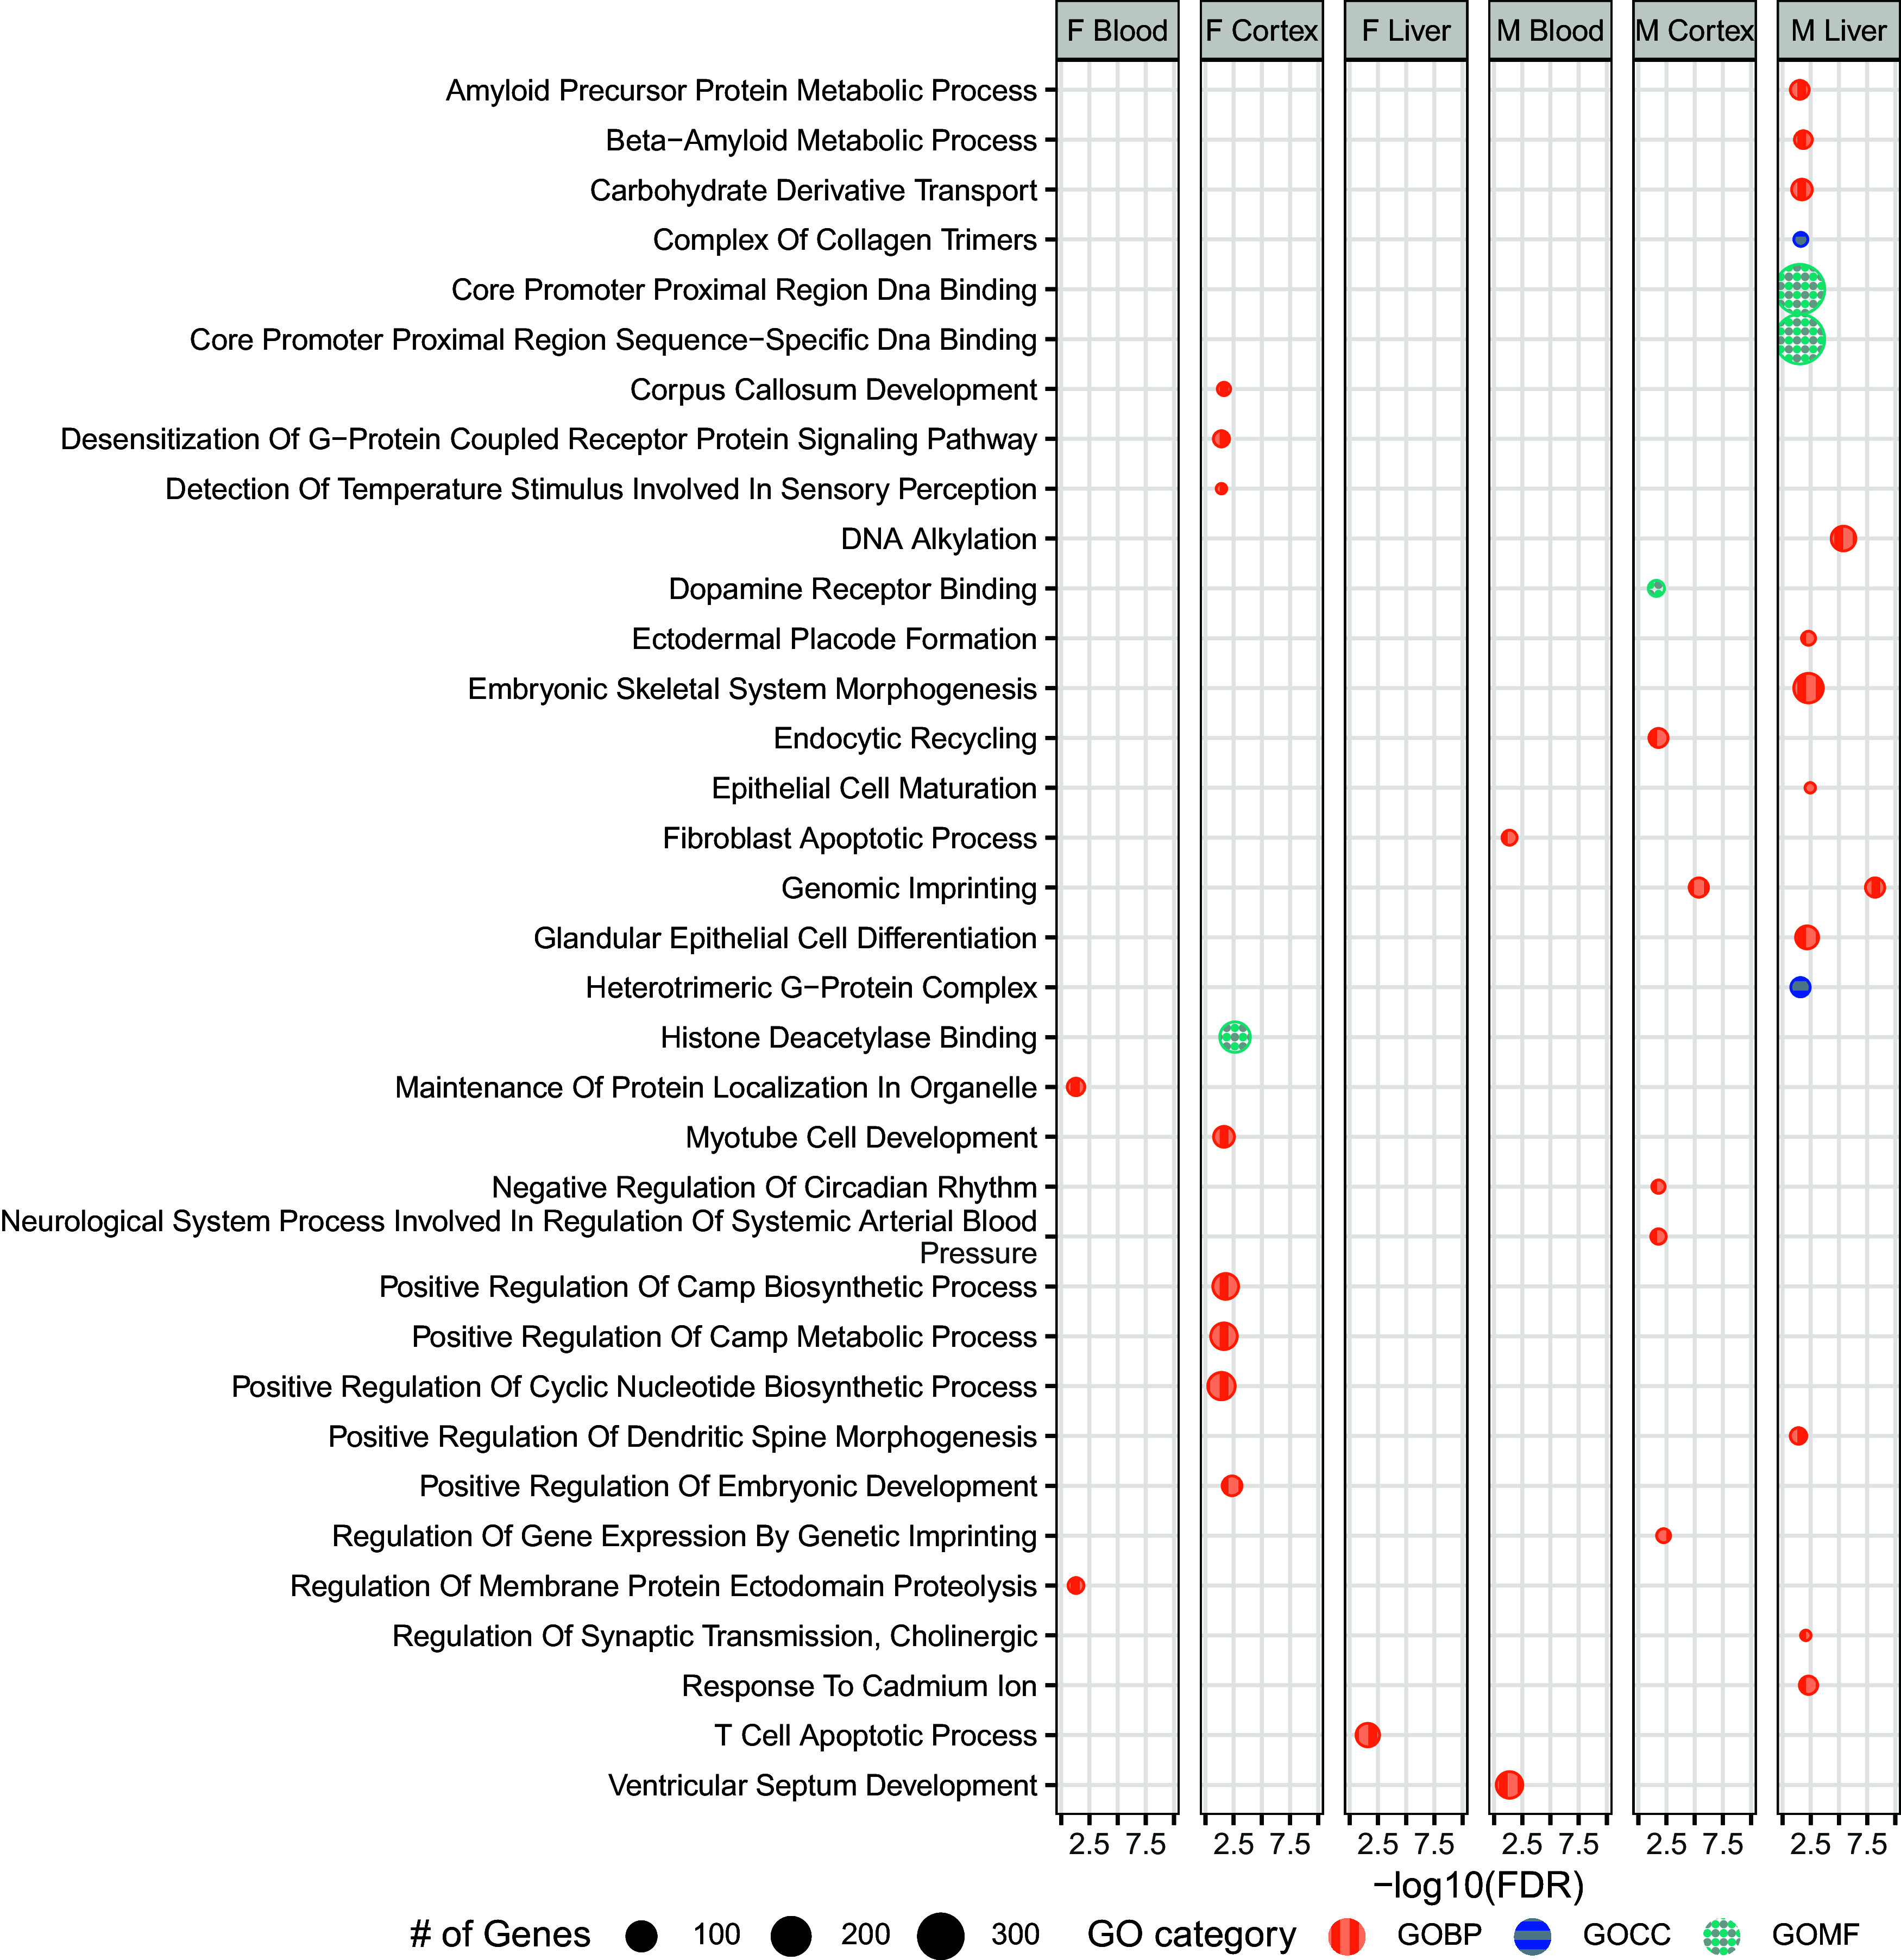
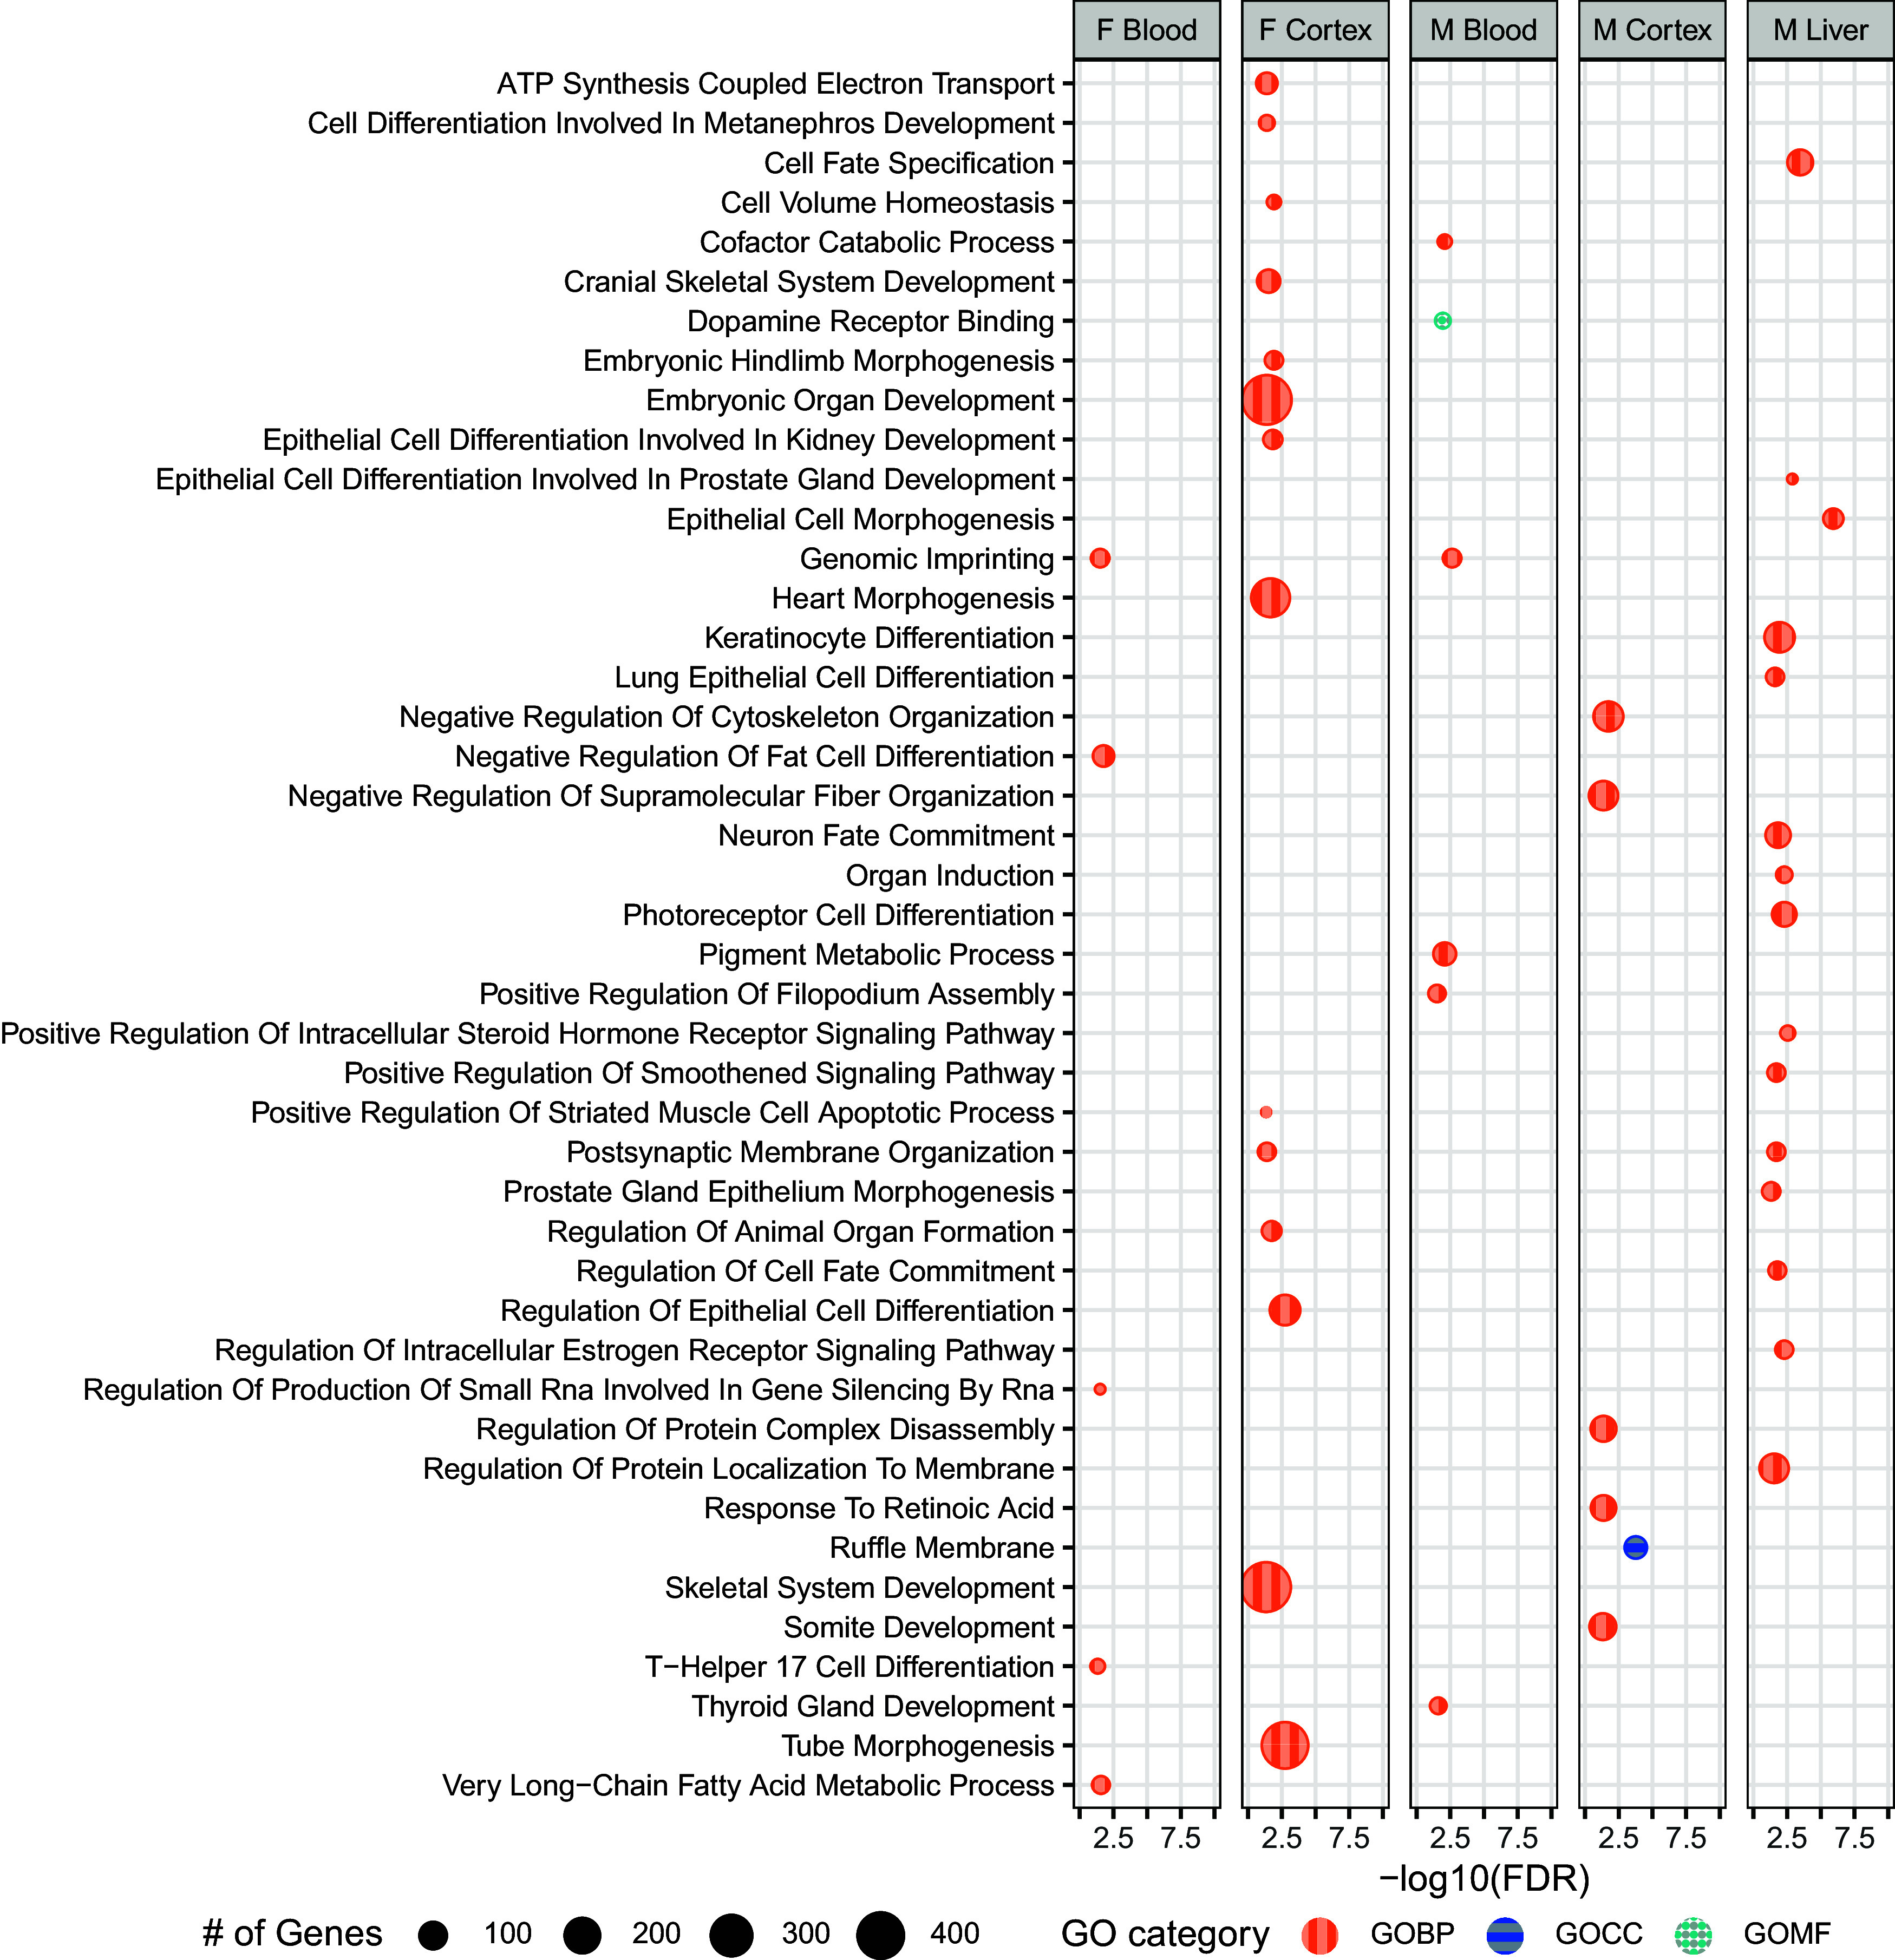
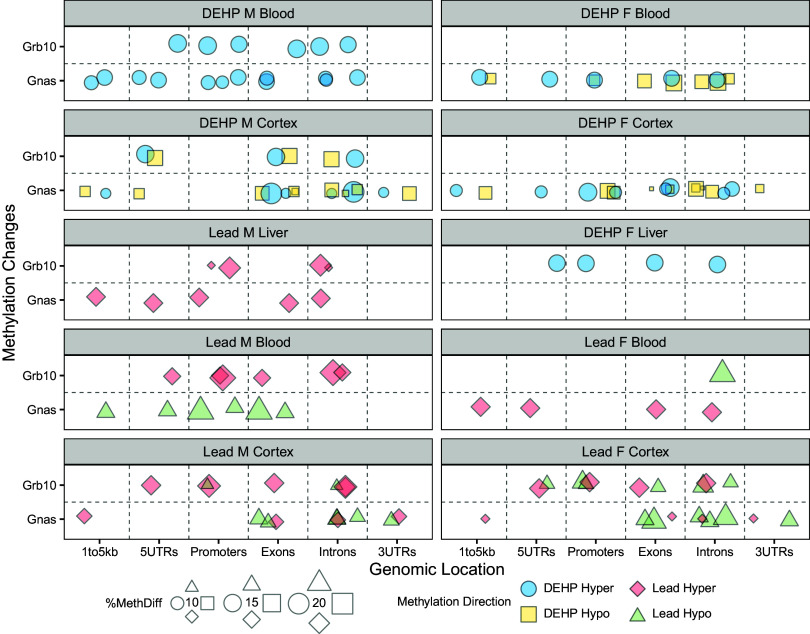
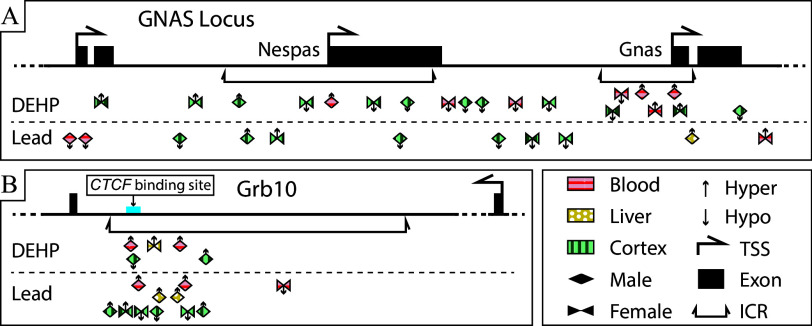
Results: The cortex contained the majority of DMRs associated with Pb (66%) and DEHP (57%) exposure. The cortex also contained the greatest degree of overlap in DMR signatures between sexes (n=13 and 8 DMRs with Pb and DEHP exposure, respectively) and exposure types (n=55 and 39 DMRs in males and females, respectively). In all tissues, detected DMRs were preferentially found at genomic regions associated with gene expression regulation (e.g., CpG islands and shores, 5' UTRs, promoters, and exons). An analysis of GO terms associated with DMR-containing genes identified imprinted genes to be impacted by both Pb and DEHP exposure. Of these, Gnas and Grb10 contained DMRs across tissues, sexes, and exposures, with some signatures replicated between target and surrogate tissues. DMRs were enriched in the imprinting control regions (ICRs) of Gnas and Grb10, and we again observed a replication of DMR signatures between blood and target tissues. Specifically, we observed hypermethylation of the Grb10 ICR in both blood and liver of Pb-exposed male animals.

Conclusions: These data provide preliminary evidence that imprinted genes may be viable candidates in the search for epigenetic biomarkers of toxicant exposure in target tissues. Additional research is needed on allele- and developmental stage-specific effects, as well as whether other imprinted genes provide additional examples of this relationship. https://doi.org/10.1289/EHP14074.


Figures

Figure 1 is a flowchart with six steps. Step 1: F0 (Dams): The duration of exposures includes pre-mating, pregnancy, and lactation. The pre-mating exposure period was for 2 weeks, gestation was for 3 weeks, lactation was for 3 weeks, and sacrifice was after 5 months. Step 2: A tabular representation titled number of animals has three main columns, namely, blood, liver, and cortex. The blood, liver, and cortex columns are each subdivided into two columns, namely, male and female. Row 1: lead, 6,6,6,6,6,6. Row 2: D E H P, 7,5,7,5,7,5. Row 3: control, 6,6,6,6,6,6. Step 3: Genomic D N A or ribonucleic acid from tissues, library preparation for whole genome bisulfite sequencing. Step 4: Illumina NovaSeq 6000. Step 5: Quality control (FastQC and MultiQC) plus trimming (trim underscore galore) and alignment (bowtie2) plus cytosine base adjacent to a guanine calling (Bismark). Step 6: MethylSig: Filter out cytosine base adjacent to a guanine by coverage (10 less than coverage less than 500); Filter out cytosine base adjacent to a guanine with reads covered in less than 4 samples per group; define tiling windows with 100 basis points; select regions with a false discovery rate less than 0.1 and a methylation difference greater than 5 percent; Differentially Methylated Regions: Combine Differentially Methylated Regions from MethylSig and Metilene for downstream analysis, and any overlapped Differentially Methylated Regions will be merged together as one Differentially Methylated Region; and Metilene: Filter out cytosine base adjacent to a guanine by coverage (10 less than coverage less than 500); Generate input data with Metilene underscore input.pl, run metilene with greater than or equal to 5 cytosine base adjacent to a guanine in a differentially methylated region. Select regions with a false discovery rate less than 0.1 and a methylation difference greater than 5 percent.
Figure 1.
Overview of experimental workflow. F0 generation females (6–8 wk of age) were exposed to either 32 ppm of Pb via drinking water or 5mg/kg/d of DEHP via food, beginning 2 wk prior to mating using virgin males (8–10 wk of age). Exposure to Pb or DEHP or control continued through gestation and weaning, when F1 mice (na=36) were removed from the dams and placed on control water or chow. At 5 months of age, F1 mice were sacrificed, and genomic DNA was extracted from blood, liver, and cortex tissues (nt=108). DNA was used to prepare libraries for WGBS. Following initial data processing, DMRs were called using MethylSig and metilene. Note: DEHP, di(2-ethylhexyl) phthalate; DMR, differentially methylated region; Pb, lead; WGBS, whole genome bisulfite sequencing.
Figure 2A is a tabular representation with three main columns, namely, blood, cortex, and liver. The blood, cortex, and liver columns are each sub divided into three columns, namely, male and female. Row 1: Lead, 196, 235, 471, 568, 74, and 32. Row 2: di(2-ethylhexyl) phthalate, 234, 364, 417, 468, 49, and 32. Figure 2B is a set of four Venn diagrams. On the top, the two Venn diagrams are titled Male. On the left, the Venn diagram is titled Lead displays three circles. The circle on the left is labeled blood with 189 cases, the circle on the right is labeled liver with 70 cases, the circle at the bottom is labeled cortex with 463 cases. The area between left circle and bottom circle is labeled 5, the area between left circle and right circle is labeled 1, the area between right circle and bottom circle is labeled 2. The intersection area is labeled 1. On the right, the Venn diagram is titled di(2-ethylhexyl) phthalate displays three circles. The circle on the left is labeled blood with 227 cases, the circle on the right is labeled liver with 48 cases, the circle at the bottom is labeled cortex with 410 cases. The area between left circle and bottom circle is labeled 6, the area between left circle and right circle is labeled 0, the area between right circle and bottom circle is labeled 0. The intersection area is labeled 1. At the bottom, the two Venn diagrams are titled Female. On the left, the Venn diagram is titled Lead displays three circles. The circle on the left is labeled blood with 232 cases, the circle on the right is labeled liver with 29 cases, the circle at the bottom is labeled cortex with 564 cases. The area between left circle and bottom circle is labeled 2, the area between left circle and right circle is labeled 1, the area between right circle and bottom circle is labeled 2. The intersection area is labeled 0. On the right, the Venn diagram is titled di(2-ethylhexyl) phthalate displays three circles. The circle on the left is labeled blood with 352 cases, the circle on the right is labeled liver with 28 cases, the circle at the bottom is labeled cortex with 455 cases. The area between left circle and bottom circle is labeled 10, the area between left circle and right circle is labeled 1, the area between right circle and bottom circle is labeled 2. The intersection area is labeled 1. Figure 2C is a set of six Venn diagrams. On the top, the three Venn diagrams are titled lead. On the left, the Venn diagram is titled Blood displays two circles. The circle on the left is labeled male with 190 cases and the circle on the right is labeled female with 229 cases. The intersection area is labeled 6. At the center, the Venn diagram is titled Cortex displays two circles. The circle on the left is labeled male with 458 cases and the circle on the right is labeled female with 555 cases. The intersection area is labeled 13. On the right, the Venn diagram is titled Liver displays two circles. The circle on the left is labeled male with 74 cases and the circle on the right is labeled female with 32 cases. The intersection area is labeled 0. At the bottom, the three Venn diagrams are titled di(2-ethylhexyl) phthalate. On the left, the Venn diagram is titled Blood displays two circles. The circle on the left is labeled male with 226 cases and the circle on the right is labeled female with 356 cases. The intersection area is labeled 8. At the center, the Venn diagram is titled Cortex displays two circles. The circle on the left is labeled male with 409 cases and the circle on the right is labeled female with 460 cases. The intersection area is labeled 8. On the right, the Venn diagram is titled Liver displays two circles. The circle on the left is labeled male with 49 cases and the circle on the right is labeled female with 32 cases. The intersection area is labeled 0. Figure 2D is a set of six Venn diagrams. On the top, the three Venn diagrams are titled lead. On the left, the Venn diagram is titled Blood displays two circles. The circle on the left is labeled male with 177 cases and the circle on the right is labeled female with 215 cases. The intersection area is labeled 19. At the center, the Venn diagram is titled Cortex displays two circles. The circle on the left is labeled male with 416 cases and the circle on the right is labeled female with 362 cases. The intersection area is labeled 55. On the right, the Venn diagram is titled Liver displays two circles. The circle on the left is labeled male with 72 cases and the circle on the right is labeled female with 47 cases. The intersection area is labeled 2. At the bottom, the three Venn diagrams are titled di(2-ethylhexyl) phthalate. On the left, the Venn diagram is titled Blood displays two circles. The circle on the left is labeled male with 210 cases and the circle on the right is labeled female with 339 cases. The intersection area is labeled 25. At the center, the Venn diagram is titled Cortex displays two circles. The circle on the left is labeled male with 529 cases and the circle on the right is labeled female with 429 cases. The intersection area is labeled 39. On the right, the Venn diagram is titled Liver displays two circles. The circle on the left is labeled male with 31 cases and the circle on the right is labeled female with 31 cases. The intersection area is labeled 1. Figure 2E is a set of twelve pie charts. On the left, the six pie charts are titled Lead. From the left, the three pie charts are titled Male displays the following information: Blood 45 percent, cortex 20 percent, and liver 64 percent. On the right, the pie charts are titled Female displays the following information: Blood 72 percent, cortex 46 percent, and liver 50 percent. On the right, the six pie charts are titled di(2-ethylhexyl) phthalate. From the left, the three pie charts are titled Male displays the following information: Blood 65 percent, cortex 53 percent, and liver 40 percent. On the right, the pie charts are titled Female displays the following information: Blood 65 percent, cortex 39 percent, and liver 53 percent. The X X percent indicates percentage of hyper Differentially Methylated Regions.
Figure 2.
Summary of detected DMRs. (A) DMRs were categorized by tissue (blood, cortex, and liver), sex (F: female, M: male), and exposure group (Pb, DEHP, and control) with a methylation difference of >5% and an FDR cutoff of <0.1 using MethylSig and metilene, and (B) DMRs found in more than one tissue type were further categorized by sex and exposure. DMRs shared by both sexes (C) and by exposure group (D) were quantified and broken down by tissue type. Proportions of DMR directional changes were generally summarized for each tissue–sex–exposure combination, with %XX designating the percent of DMRs that were hypermethylated (E). A summary of DMRs detected with MethylSig and metilene can be found in Excel Table S1. Exposure, sex, and tissue specific DMRs are summarize in Excel Tables S3–S14. A summary of hypermethylation vs. hypomethylation is included in Excel Table S15. Note: DEHP, di(2-ethylhexyl) phthalate; DMR, differentially methylated region; FDR, false discovery rate; Pb, lead.
Figure 3 is a set of three clustered bar graphs are titled Blood, liver, and cortex, plotting percentage, ranging from 0 to 60 in increments of 20 (y-axis) across cytosine base adjacent to a guanine island, cytosine base adjacent to a guanine shores, cytosine base adjacent to a guanine shelves, open sea, gene (1 to 5 kilobytes), 5′-untranslated regions, promoters, exons, introns, 3′-untranslated regions, and enhancers (x-axis) for Genomic region, including female di(2-ethylhexyl) phthalate, female lead, male di(2-ethylhexyl) phthalate, male lead, and random, respectively.
Figure 3.
Genomic region of detected DMRs. DMRs were mapped to the mouse reference genome (mm10) and their genomic region annotated as percentage of total DMRs (comparing control and exposed samples) for that sex and exposure within each tissue. This distribution was compared to what would be expected in a random distribution. Annotation of all regions performed using Bioconductor package annotatr. Summary data for this figure can be found in Excel Table S16. Note: DMR, differentially methylated region.
Figure 4 is a set of six dot plots titled female blood, female cortex, female liver, male blood, male cortex, and male liver, plotting Ventricular Septum Development, T Cell Apoptotic Process, Response To Cadmium Ion. Regulation Of Synaptic Transmission, Cholinergic, Regulation Of Membrane Protein Ectodomain Proteolysis, Regulation Of Gene Expression By Genetic Imprinting, Positive Regulation Of Embryonic Development, Positive Regulation Of Dendritic Spine Morphogenesis, Positive Regulation Of Cyclic Nucleotide Biosynthetic Process, Positive Regulation Of Camp Metabolic Process, Positive Regulation Of Camp Biosynthetic Process, Neurological System Process Involved In Regulation Of Systemic Arterial Blood, Pressure, Negative Regulation Of Circadian Rhythm, Myotube Cell Development, Maintenance Of Protein Localization In Organelle, Histone Deacetylase Binding, Heterotrimeric G−Protein Complex, Glandular Epithelial Cell Differentiation, Genomic Imprinting, Fibroblast Apoptotic Process, Epithelial Cell Maturation, Endocytic Recycling, Embryonic Skeletal System Morphogenesis, Ectodermal Placode Formation, Dopamine Receptor Binding, DNA Alkylation, Detection Of Temperature Stimulus Involved In Sensory Perception, Desensitization Of G−Protein Coupled Receptor Protein Signaling Pathway, Corpus Callosum Development, Core Promoter Proximal Region Sequence−Specific DNA Binding, Core Promoter Proximal Region DNA Binding, Complex Of Collagen Trimers, Carbohydrate Derivative Transport, Beta−Amyloid Metabolic Process, Amyloid Precursor Protein Metabolic Process (y-axis) across negative log 10 (false discovery rate), ranging from 2.5 to 7.5 in increments of 5 (x-axis) for Gene Ontology category; Gene Ontology Biological Process, Gene Ontology Cellular Component, Gene Ontology Molecular Function, respectively. The number of genes ranges from 100 to 300 increments of 100.
Figure 4.
GO-terms associated with DMR-containing genes among Pb-exposed tissues. DMR-containing genes found in Pb-exposed tissues were submitted for GO term analysis across three categories: Biological Process (GOBP), Cellular Component (GOCC), and Molecular Function (GOMF). Bioconductor package ChIP-enrich was used to identify related GO terms, with an FDR cutoff of <0.05. Summary data for this figure can be found in Excel Table S17. Note: DMR, differentially methylated region; FDR, false discovery rate; GO, gene ontology; Pb, lead.
Figure 5 is a set of five dot plots titled female blood, female cortex, male blood, male cortex, and male liver, plotting Very Long−Chain Fatty Acid Metabolic, Process, Tube Morphogenesis, Thyroid Gland Development, T−Helper 17 Cell Differentiation, Somite Development, Skeletal System Development, Ruffle Membrane, Response To Retinoic Acid, Regulation Of Protein Localization To Membrane, Regulation Of Protein Complex Disassembly, Regulation Of Production Of Small RNA Involved In Gene Silencing By RNA, Regulation Of Intracellular Estrogen Receptor Signaling Pathway, Regulation Of Epithelial Cell Differentiation, Regulation Of Cell Fate Commitment, Regulation Of Animal Organ Formation, Prostate Gland Epithelium Morphogenesis, Postsynaptic Membrane Organization, Positive Regulation Of Striated Muscle Cell Apoptotic Process, Positive Regulation Of Smoothened Signaling Pathway, Positive Regulation Of Intracellular Steroid Hormone Receptor Signaling Pathway, Positive Regulation Of Filopodium Assembly, Pigment Metabolic Process, Photoreceptor Cell Differentiation, Organ Induction, Neuron Fate Commitment, Negative Regulation Of Supramolecular Fiber Organization, Negative Regulation Of Fat Cell Differentiation, Negative Regulation Of Cytoskeleton Organization, Lung Epithelial Cell Differentiation, Keratinocyte Differentiation, Heart Morphogenesis, Genomic Imprinting, Epithelial Cell Morphogenesis, Epithelial Cell Differentiation Involved In Prostate Gland Development, Epithelial Cell Differentiation Involved In Kidney Development, Embryonic Organ Development, Embryonic Hindlimb Morphogenesis, Dopamine Receptor Binding, Cranial Skeletal System Development, Cofactor Catabolic Process, Cell Volume Homeostasis, Cell Fate Specification, Cell Differentiation Involved In Metanephros Development, ATP Synthesis Coupled Electron Transport (y-axis) across negative log 10 (false discovery rate), ranging from 2.5 to 7.5 in increments of 5 (x-axis) for Gene Ontology category; Gene Ontology Biological Process, Gene Ontology Cellular Component, Gene Ontology Molecular Function, respectively. The number of genes ranges from 100 to 400 increments of 100.
Figure 5.
GO-terms associated with DMR-containing genes among DEHP-exposed tissues. DMR-containing genes found in DEHP-exposed tissues were submitted for GO term analysis across three categories: Biological Process (GOBP), Cellular Component (GOCC), and Molecular Function (GOMF). Bioconductor package chipenrich was used to identify related GO terms, with an FDR cutoff of <0.05. Summary data for this figure can be found in Excel Table S18. Note: DEHP, di(2-ethylhexyl) phthalate; DMR, differentially methylated region; FDR, false discovery rate; GO, gene ontology.
Figure 6 is a set of ten graphs titled di(2-ethylhexyl) phthalate male blood, di(2-ethylhexyl) phthalate female blood, di(2-ethylhexyl) phthalate male cortex, di(2-ethylhexyl) phthalate female cortex, lead male liver, di(2-ethylhexyl) phthalate female liver, lead male blood, lead female blood, lead male cortex, and lead female cortex, plotting Methylation Changes, ranging as Methylated Regions in the Gnas and Grb 10 (y-axis) across genomic location, ranging as 1 to 5 kilobytes, 5′-untranslated regions, Promoters, Exons, Introns, 3′-untranslated regions (x-axis) for Methylation Direction, including di(2-ethylhexyl) phthalate hyper, di(2-ethylhexyl) phthalate hypo, lead hyper, and lead hypo, respectively. The percentage of meth difference ranges from 10 to 20 in increments of 5.
Figure 6.
Genomic location and direction of Pb and DEHP-associated DMRs in the Gnas and Grb10 loci. DMRs detected in the Gnas and Grb10 loci were classified as to their genomic location within each gene. Percentage change in methylation is denoted by size and direction of methylation change by color (circles: hypermethylated DMRs among DEHP samples; squares: hypomethylation among DEHP samples; diamonds: hypermethylation among Pb samples; triangles: among hypomethylation among Pb samples). Bioconductor package annotatr was used to annotate the genomic locations of these DMRs. Summary data for this figure can be found in Excel Table S21 and S22 for Pb and DEHP exposure, respectively. Note: DEHP, di(2-ethylhexyl) phthalate; DMR, differentially methylated region; Pb, lead.
Figure 7A is an illustration depicting the differentially methylated regions detected within Gnas ICRs Nespas and Gnas for di(2-ethylhexyl) phthalate and lead exposures. Figure 7B is an illustration depicting the differentially methylated regions detected within Grb10, including the C T C F binding site for di(2-ethylhexyl) phthalate and lead exposures. The legend includes blood, liver, cortex, male, female, hyper, hypo, T S S, exon, and I C R.
Figure 7.
DMRs detected within Gnas and Grb10 ICRs among Pb- and DEHP-exposed tissues. (A) DMRs detected within Gnas ICRs Nespas and Gnas. (B) DMRs detected within Grb10. DMRs only represents the related genomic locations corresponding to the genomic coordinates of ICRs. The genomic coordinates of these DMRs can be found in Excel Table S25 and S26 for Pb and DEHP exposure, respectively. Note: DEHP, di(2-ethylhexyl) phthalate; DMR, differentially methylated region; ICR, imprinting control region; Pb, lead; TSS, transcription start site.

Update of

Similar articles

Cited by

References

    1. Gillman MW. 2005. Developmental origins of health and disease. N Engl J Med 353(17):1848–1850, PMID: 16251542, 10.1056/NEJMe058187. - DOI - PMC - PubMed
    1. Bernal AJ, Jirtle RL. 2010. Epigenomic disruption: the effects of early developmental exposures. Birth Defects Res A Clin Mol Teratol 88(10):938–944, PMID: 20568270, 10.1002/bdra.20685. - DOI - PMC - PubMed
    1. Bollati V, Baccarelli A. 2010. Environmental epigenetics. Heredity (Edinb) 105(1):105–112, PMID: 20179736, 10.1038/hdy.2010.2. - DOI - PMC - PubMed
    1. Lyko F. 2018. The DNA methyltransferase family: a versatile toolkit for epigenetic regulation. Nat Rev Genet 19(2):81–92, PMID: 29033456, 10.1038/nrg.2017.80. - DOI - PubMed
    1. Siegfried Z, Simon I. 2010. DNA methylation and gene expression. Wiley Interdiscip Rev Syst Biol Med 2(3):362–371, PMID: 20836034, 10.1002/wsbm.64. - DOI - PubMed

LinkOut - more resources