

Determinants of aggregate anthropometric failure among children under-five years in Ethiopia: Application of multilevel mixed-effects negative binomial regression modeling
- PMID: 38833430
- PMCID: PMC11149882
- DOI: 10.1371/journal.pgph.0003305
Determinants of aggregate anthropometric failure among children under-five years in Ethiopia: Application of multilevel mixed-effects negative binomial regression modeling
Abstract
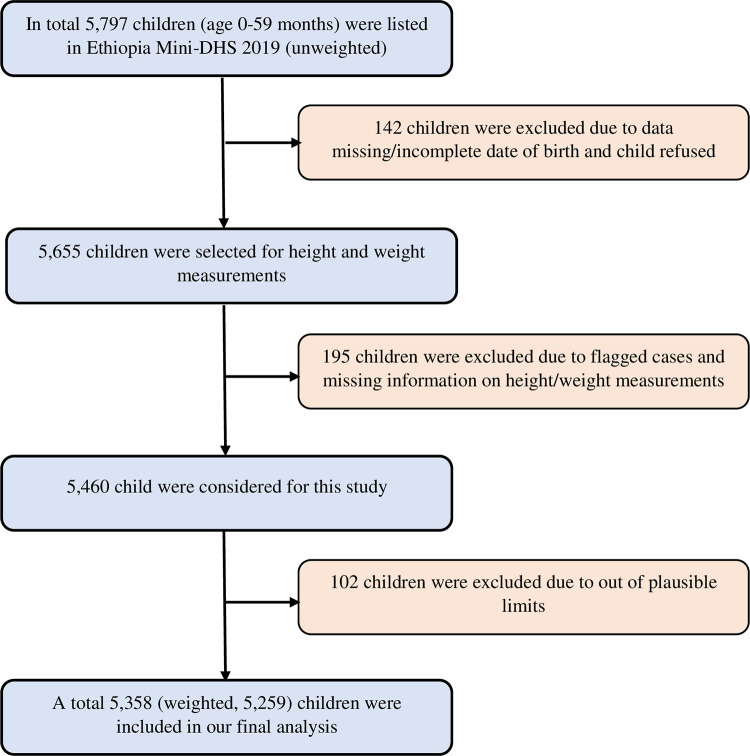
Undernutrition significantly contributes to failure to thrive in children under five, with those experiencing multiple forms of malnutrition facing the highest risks of morbidity and mortality. Conventional markers such as stunting, wasting, and underweight have received much attention but are insufficient to identify multiple types of malnutrition, prompting the development of the Composite Index of Anthropometric Failure (CIAF) and the Composite Index of Severe Anthropometric Failure (CISAF) as an aggregate indicators. This study aimed to identify factors associated with CIAF and CISAF among Ethiopian children aged 0-59 months using data from the 2019 Ethiopia Mini Demographic and Health Survey. The study included a weighted sample of 5,259 children and used multilevel mixed-effects negative binomial regression modeling to identify determinants of CIAF and CISAF. The result showed higher incidence-rate ratio (IRR) of CIAF in male children (adjusted IRR = 1.27; 95% CI = 1.13-1.42), children aged 12-24 months (aIRR = 2.01, 95%CI: 1.63-2.48), and 24-59 months (aIRR = 2.36, 95%CI: 1.91-2.92), those from households with multiple under-five children (aIRR = 1.16, 95%CI: 1.01-1.33), poorer households (aIRR = 1.48; 95%CI: 1.02-2.15), and those who lived in houses with an earthen floor (aIRR = 1.37, 95%CI: 1.03-1.82). Similarly, the factors positively associated with CISAF among children aged 0-59 months were male children (aIRR = 1.47, 95% CI = 1.21-1.79), age group 6-11 months (aIRR = 2.30, 95%CI: 1.40-3.78), age group 12-24 months (aIRR = 3.76, 95%CI: 2.40-5.88), age group 25-59 months (aIRR = 4.23, 95%CI: 2.79-6.39), children from households living with two and more under-five children (aIRR = 1.27, 95%CI:1.01-1.59), and children from poorer households (aIRR = 1.93, 95% CI = 1.02-3.67). Children were more likely to suffer from multiple anthropometric failures if they were: aged 6-23 months, aged 24-59 months, male sex, living in households with multiple under-five children, and living in households with poor environments. These findings underscore the need to employ a wide range of strategies to effectively intervene in multiple anthropometric failures in under-five children.
Copyright: © 2024 Sahiledengle, Mwanri. This is an open access article distributed under the terms of the Creative Commons Attribution License, which permits unrestricted use, distribution, and reproduction in any medium, provided the original author and source are credited.
Conflict of interest statement
The authors have declared that no competing interests exist.
Figures
Similar articles
-
Anthropometric failures and its predictors among under five children in Ethiopia: multilevel logistic regression model using 2019 Ethiopian demographic and health survey data.BMC Public Health. 2024 Apr 24;24(1):1149. doi: 10.1186/s12889-024-18625-4. BMC Public Health. 2024. PMID: 38658941 Free PMC article.
-
Urban-rural differences in the associated factors of severe under-5 child undernutrition based on the composite index of severe anthropometric failure (CISAF) in Bangladesh.BMC Public Health. 2021 Nov 23;21(1):2147. doi: 10.1186/s12889-021-12038-3. BMC Public Health. 2021. PMID: 34814880 Free PMC article.
-
Bivariate binary analysis on composite index of anthropometric failure of under-five children and household wealth-index.BMC Pediatr. 2021 Jul 31;21(1):332. doi: 10.1186/s12887-021-02770-5. BMC Pediatr. 2021. PMID: 34332585 Free PMC article.
-
Assessment of undernutrition using the composite index of anthropometric failure (CIAF) and its determinants: A cross-sectional study in the rural area of the Bogor District in Indonesia.BMC Nutr. 2022 Nov 16;8(1):133. doi: 10.1186/s40795-022-00627-3. BMC Nutr. 2022. PMID: 36384860 Free PMC article.
-
High burden of undernutrition among primary school-aged children and its determinant factors in Ethiopia; a systematic review and meta-analysis.Ital J Pediatr. 2020 Aug 26;46(1):118. doi: 10.1186/s13052-020-00881-w. Ital J Pediatr. 2020. PMID: 32847566 Free PMC article.
Cited by
-
Socio-ecological determinants of multiple anthropometric failures among under-five children: A systematic review and meta-analysis of observational studies.PLOS Glob Public Health. 2025 Jul 31;5(7):e0005008. doi: 10.1371/journal.pgph.0005008. eCollection 2025. PLOS Glob Public Health. 2025. PMID: 40743231 Free PMC article.
References
-
- World Health Organization. The state of food security and nutrition in the world 2022: Repurposing food and agricultural policies to make healthy diets more affordable. Food & Agriculture Org. 2022.
-
- World Health Organization. Levels and trends in child malnutrition: UNICEF. (Cited (Accessed 20 March, 2024). Available from: https://www.unicef.org/media/69816/file/Joint-malnutrition-estimates-202....
-
- EDHS. Central Statistical Agency [Ethiopia] and ORC Macro. Ethiopia Demographic and Health Survey 2005. Central Statistical Agency/Ethiopia and ORC Macro; 2006. 2005.
-
- EPHI and ICF. EPHI ICF. Ethiopia MiniDemographic and Health Survey 2019: Key indicators. Rockville, Maryland, USA: EPHI and ICF. 2019. 2019.
LinkOut - more resources
Full Text Sources