

Association between gait speed deterioration and EEG abnormalities
- PMID: 38833443
- PMCID: PMC11149873
- DOI: 10.1371/journal.pone.0305074
Association between gait speed deterioration and EEG abnormalities
Abstract
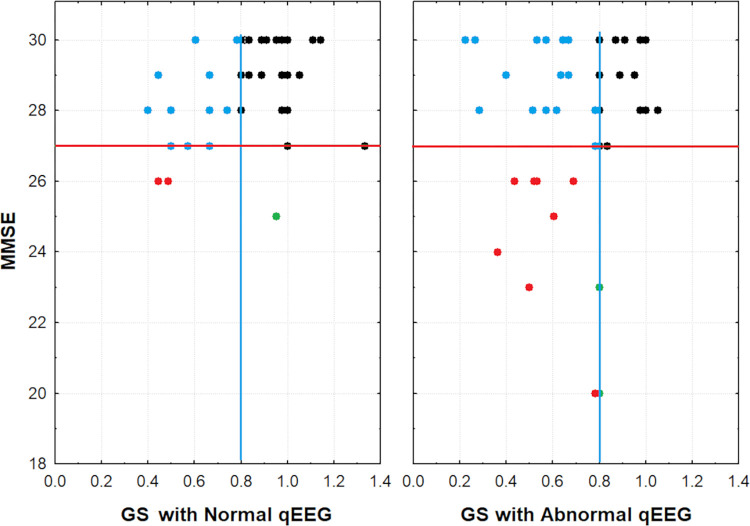
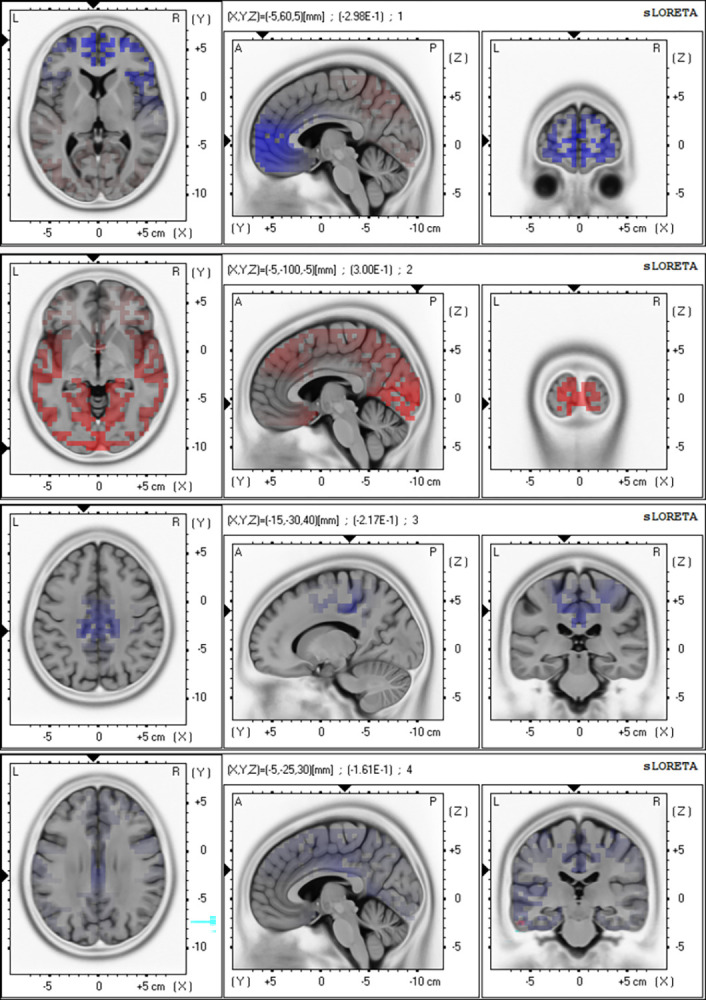
Physical and cognitive decline at an older age is preceded by changes that accumulate over time until they become clinically evident difficulties. These changes, frequently overlooked by patients and health professionals, may respond better than fully established conditions to strategies designed to prevent disabilities and dependence in later life. The objective of this study was twofold; to provide further support for the need to screen for early functional changes in older adults and to look for an early association between decline in mobility and cognition. A cross-sectional cohort study was conducted on 95 active functionally independent community-dwelling older adults in Havana, Cuba. We measured their gait speed at the usual pace and the cognitive status using the MMSE. A value of 0.8 m/s was used as the cut-off point to decide whether they presented a decline in gait speed. A quantitative analysis of their EEG at rest was also performed to look for an associated subclinical decline in brain function. Results show that 70% of the sample had a gait speed deterioration (i.e., lower than 0.8 m/s), of which 80% also had an abnormal EEG frequency composition for their age. While there was no statistically significant difference in the MMSE score between participants with a gait speed above and below the selected cut-off, individuals with MMSE scores below 25 also had a gait speed<0.8 m/s and an abnormal EEG frequency composition. Our results provide further evidence of early decline in older adults-even if still independent and active-and point to the need for clinical pathways that incorporate screening and early intervention targeted at early deterioration to prolong the years of functional life in older age.
Copyright: © 2024 García-Agustin et al. This is an open access article distributed under the terms of the Creative Commons Attribution License, which permits unrestricted use, distribution, and reproduction in any medium, provided the original author and source are credited.
Conflict of interest statement
The authors have declared that no competing interests exist.
Figures
Similar articles
-
Role of gait speed and grip strength in predicting 10-year cognitive decline among community-dwelling older people.BMC Geriatr. 2019 Jul 5;19(1):186. doi: 10.1186/s12877-019-1199-7. BMC Geriatr. 2019. PMID: 31277579 Free PMC article.
-
Risk factors for cognitive decline associated with gait speed in community-dwelling elderly Koreans with MMSE scores of 30.Aging Clin Exp Res. 2017 Apr;29(2):183-189. doi: 10.1007/s40520-016-0565-y. Epub 2016 Apr 5. Aging Clin Exp Res. 2017. PMID: 27048507
-
The Association of Gait Speed and Frontal Lobe among Various Cognitive Domains: The Korean Frailty and Aging Cohort Study (KFACS).J Nutr Health Aging. 2020;24(1):91-97. doi: 10.1007/s12603-019-1276-9. J Nutr Health Aging. 2020. PMID: 31886814
-
The Association Between Gait Speed and Cognitive Status in Community-Dwelling Older People: A Systematic Review and Meta-analysis.J Gerontol A Biol Sci Med Sci. 2019 May 16;74(6):943-948. doi: 10.1093/gerona/gly140. J Gerontol A Biol Sci Med Sci. 2019. PMID: 29917045
-
Walking ability to predict future cognitive decline in old adults: A scoping review.Ageing Res Rev. 2016 May;27:1-14. doi: 10.1016/j.arr.2016.02.001. Epub 2016 Feb 6. Ageing Res Rev. 2016. PMID: 26861693
Cited by
-
Effects of visual impairment and its restoration on electroencephalogram during walking in aged females.Chin Med J (Engl). 2025 Mar 20;138(6):738-744. doi: 10.1097/CM9.0000000000003549. Epub 2025 Feb 21. Chin Med J (Engl). 2025. PMID: 39981564 Free PMC article.
References
-
- Wolinsky FD, Miller DK, Andresen EM, Malmstrom TK, Miller JP. Further Evidence for the Importance of Subclinical Functional Limitation and Subclinical Disability Assessment in Gerontology and Geriatrics. J Gerontol B Psychol Sci Soc Sci. 2005;60(3):S146–51. doi: 10.1093/geronb/60.3.s146 - DOI - PubMed
-
- Abellan Van Kan G, Rolland Y, Andrieu S, Bauer J, Beauchet O, Bonnefoy M, et al.. Gait speed at usual pace as a predictor of adverse outcomes in community-dwelling older people an International Academy on Nutrition and Aging (IANA) Task Force. J Nutr Health Aging. 2009;13(10):881–9. doi: 10.1007/s12603-009-0246-z - DOI - PubMed
MeSH terms
LinkOut - more resources
Full Text Sources
