Clinical Trial
. 2024 Aug 1;84(15):2501-2517.
doi: 10.1158/0008-5472.CAN-24-0398.

Comprehensive Target Engagement by the EZH2 Inhibitor Tulmimetostat Allows for Targeting of ARID1A Mutant Cancers

Affiliations
Clinical Trial

Comprehensive Target Engagement by the EZH2 Inhibitor Tulmimetostat Allows for Targeting of ARID1A Mutant Cancers

Patricia J Keller et al. Cancer Res. .

Abstract

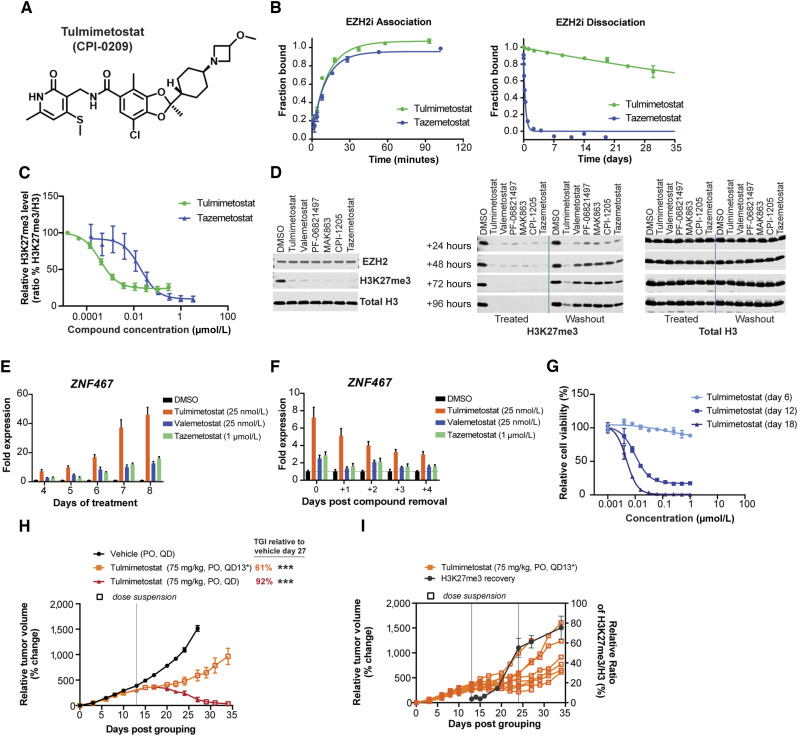
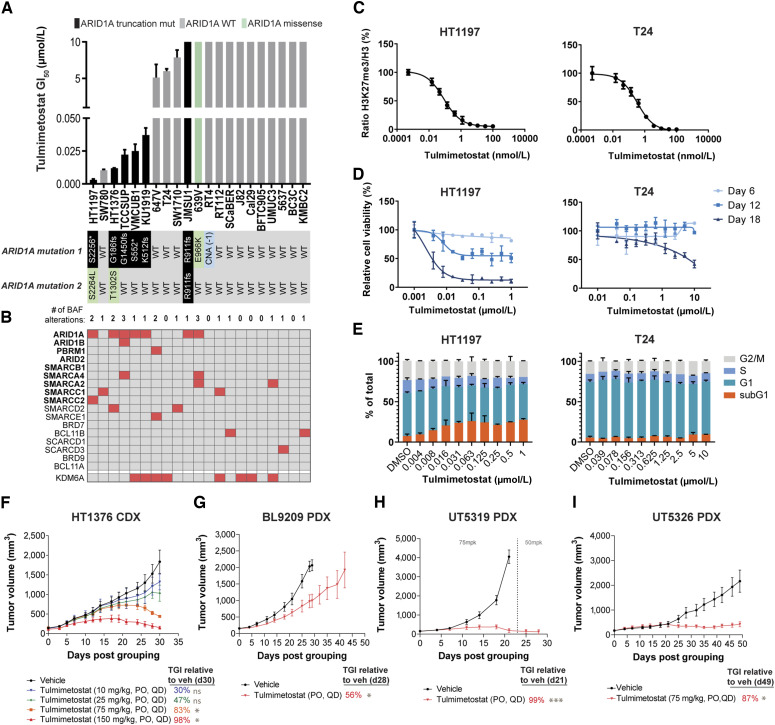
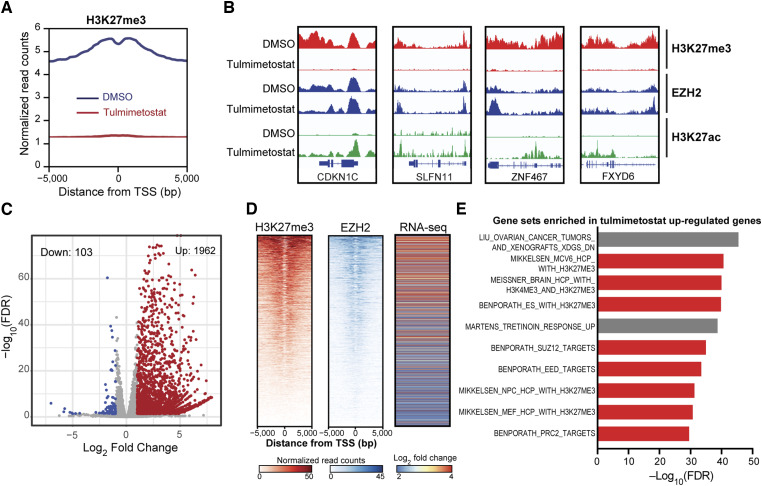
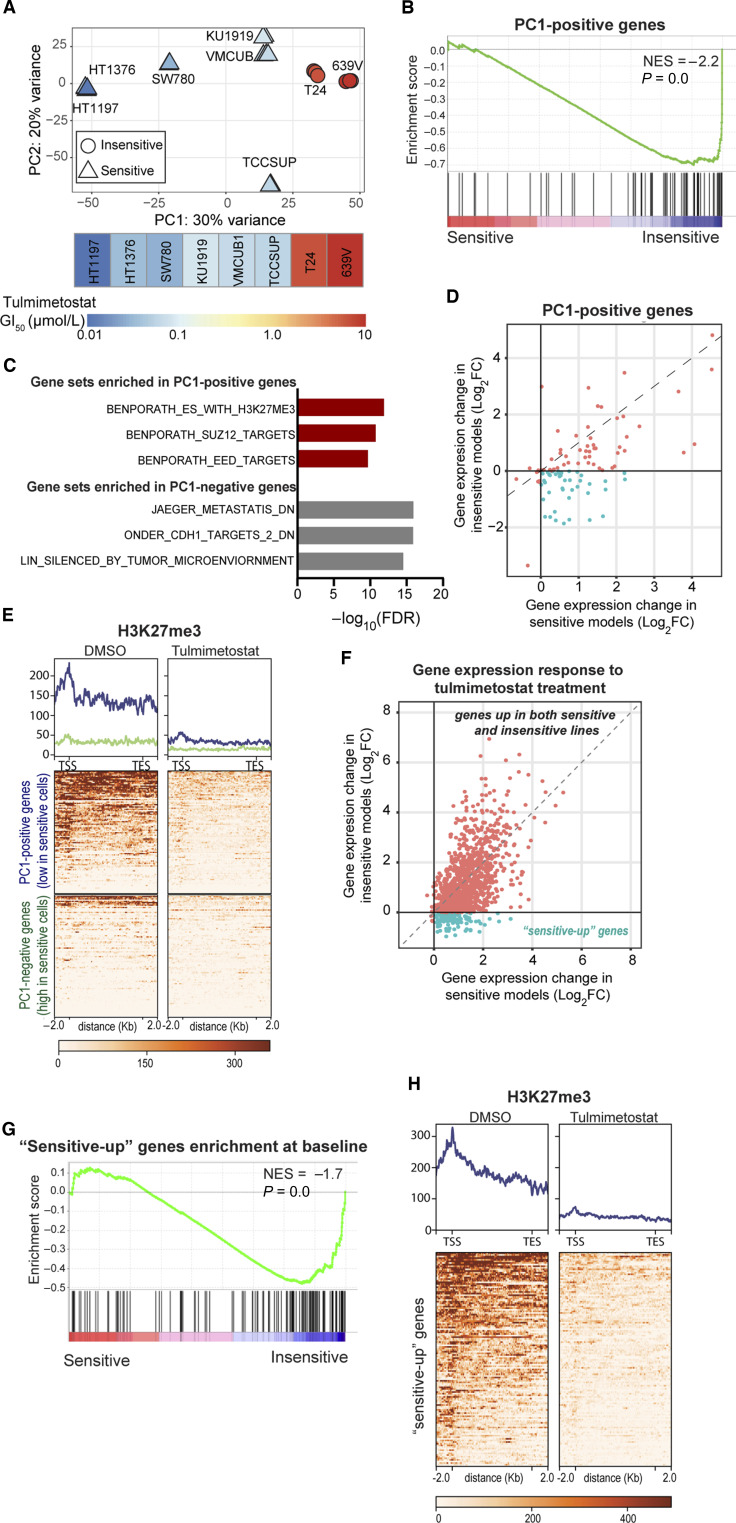
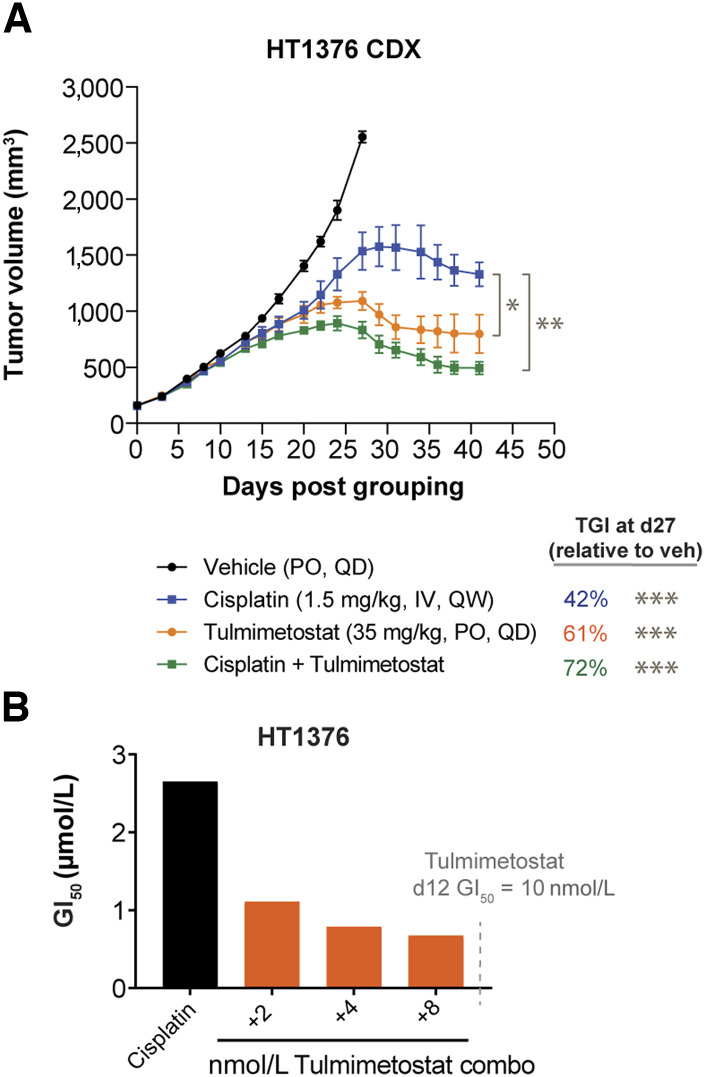
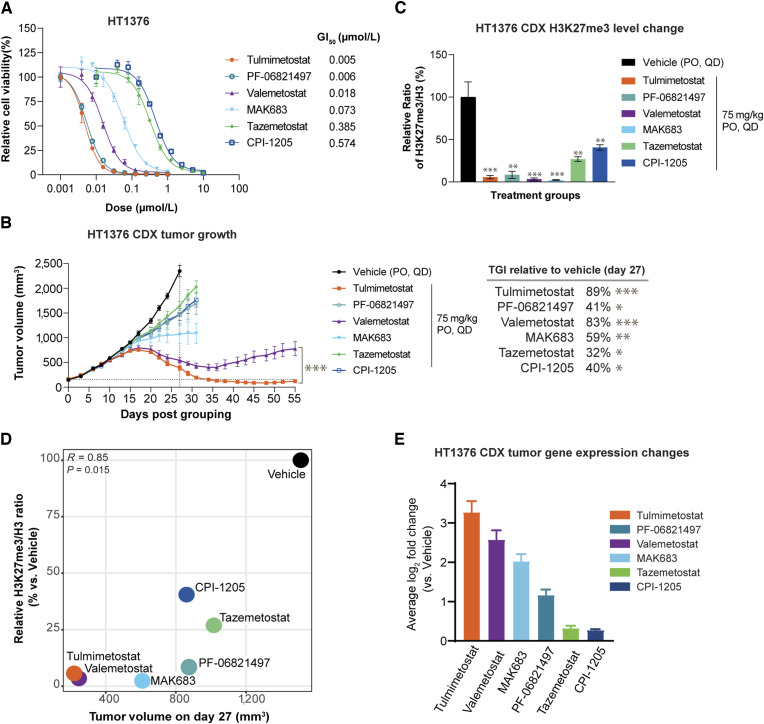
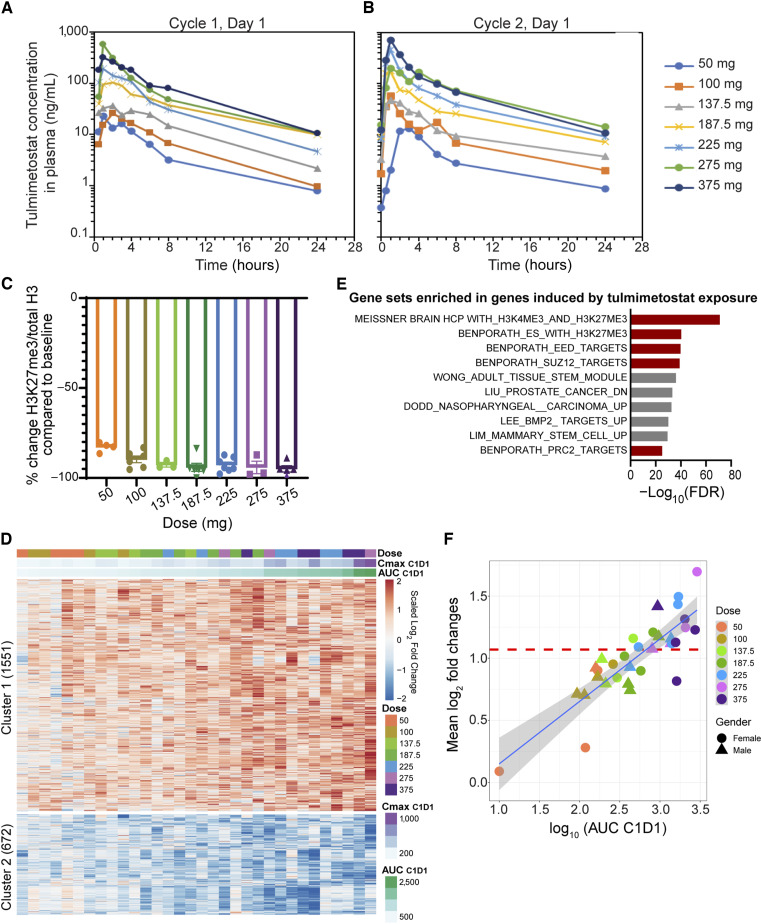
Recurrent somatic mutations in the BRG1/BRM-associated factor (BAF) chromatin remodeling complex subunit ARID1A occur frequently in advanced urothelial, endometrial, and ovarian clear cell carcinomas, creating an alternative chromatin state that may be exploited therapeutically. The histone methyltransferase EZH2 has been previously identified as targetable vulnerability in the context of ARID1A mutations. In this study, we describe the discovery of tulmimetostat, an orally available, clinical stage EZH2 inhibitor, and it elucidates the aspects of its application potential in ARID1A mutant tumors. Tulmimetostat administration achieved efficacy in multiple ARID1A mutant bladder, ovarian, and endometrial tumor models and improved cisplatin response in chemotherapy-resistant models. Consistent with its comprehensive and durable level of target coverage, tulmimetostat demonstrated greater efficacy than other PRC2-targeted inhibitors at comparable or lower exposures in a bladder cancer xenograft mouse model. Tulmimetostat mediated extensive changes in gene expression, in addition to a profound reduction in global H3K27me3 levels in tumors. Phase I clinical pharmacokinetic and pharmacodynamic data indicated that tulmimetostat exhibits durable exposure and profound target engagement. Importantly, a tulmimetostat controlled gene expression signature identified in whole blood from a cohort of 32 patients with cancer correlated with tulmimetostat exposure, representing a pharmacodynamic marker for the assessment of target coverage for PRC2-targeted agents in the clinic. Collectively, these data suggest that tulmimetostat has the potential to achieve clinical benefit in solid tumors as a monotherapy but also in combination with chemotherapeutic agents, and may be beneficial in various indications with recurrent ARID1A mutations. Significance: The EZH2 inhibitor tulmimetostat achieves comprehensive target inhibition in ARID1A mutant solid tumor models and cancer patients that can be assessed with a pharmacodynamic gene signature in peripheral blood.


Conflict of interest statement

P.J. Keller reports a patent for 63/445,024 pending to Constellation Pharmaceuticals and was an employee of Constellation Pharmaceuticals, Inc., during time of work on publication. E.J. Adams reports a patent for WO2024015566(A1) pending; and E.J. Adams was an employee of Constellation Pharmaceuticals and MorphoSys US during time of work on publication. Third party funding of Constellation Pharmacueticals and MorphoSys AG can be found in their respective SEC filings. R. Meyer reports other support from Constellation Pharmaceuticals and MorphoSys during the conduct of the study. J.A. Mertz reports other support from Flare Therapeutics outside the submitted work. V. Gehling reports personal fees and other support from Odyssey Therapeutics and personal fees from Kura Oncology outside the submitted work; in addition, V. Gehling has a patent for WO/2019/204490 issued. J. Cui reports other support from Constellation Pharmaceuticals outside the submitted work and is an employee of Constellation Pharmaceuticals. J.I. Stuckey reports a patent for WO2019204490—Modulators of Methyl Modifying Enzymes, Compositions and Uses Thereof issued. A. Khanna reports a patent 20240116905 issued. Z. Yu reports a patent for EZH2 inhibition therapies for the treatment of AT-rich interactive domain-containing protein 1A (ARID1A) mutated cancers pending. N.J. Lakhani reports nonfinancial support and other support from MorphoSys/Constellation Pharma during the conduct of the study; other support from Arcus Biosciences, Artios, GSK, Celgene/BMS, Gilead, Ikena, InhibRx, Janssen, Jounce, KSQ/Roche, LOXO/Lilly, Macrogenics, Merck, Alkermes/Mural Oncology, Regeneron, Revolution Medicines, Repare Theraepeutics, Symphogen/Servier, Seagen/Pfizer, Shattuck Labs, Sapience, Tizona, SK Lifesciences, and Volastra; nonfinancial support and other support from Incyte. D. Rasco reports other support from MorphoSys during the conduct of the study and other support from 23 & Me, Arcus Biosciences, Adcentrx, Aulos, Bolt, BMS, Cullinan, Compugen USA, Inc., Flare, GSK, Eikon, JNJ, Kronos, AMAL, PureTech Health, Molecular Templates, and Takeda outside the submitted work. M. Gutierrez reports personal fees from Guardant Health, COTA Healthcare, Cellularity, Merck, BMS, Sanofi, and Incyte outside the submitted work; and research funding/institutional relationship with no financial interest: Acerta Pharma; Adlai Nortye; Arcus Biosciences; Array BioPharma; Bayer; Bellicum Pharmaceuticals; BMS; Boehringer Ingelheim; Celgene; Checkpoint Therapeutics; Compass Therapeutics; Constellation Pharmaceuticals; Cullinan Oncology; Cyteir; Daiichi Sankyo Company; Eisai; EMD Serono; EMD Serono; Erasca, Inc.; Fate Therapeutics; Georgetown University; GSK; GSB Pharma; Hackensack Meridian Health; Imugene; Incyte; Infinity Pharmaceuticals; ITeos Therapeutics; Janssen; Johnson & Johnson; KSQ Therapeutics; MedImmune; Memorial Sloan-Kettering Cancer Center; Merck; Millennium; Mirati Therapeutics; Moderna Therapeutics; NextCure; NextCure; Nimbus Therapeutics; Pfizer; Pharmacyclics; Rapa Therapeutics; Regeneron; Roche/Genentech; Sanofi; Seagen; Silenseed; Synlogic; Tesaro; Turning Point Therapeutics; Vedanta Biosciences; VelosBio; Verastem; and Vincerx Pharma. L. Duska reports grants from MorphoSys during the conduct of the study and personal fees from Aadi Bioscience and Regeneron outside the submitted work. J. Wang reports other support from Constellation Pharmaceutical outside the submitted work. K. Sun reports a patent for 63/455,024 pending. P. Trojer reports personal fees from Constellation Pharmaceuticals, Inc., and MorphoSys during the conduct of the study and personal fees from MorphoSys, Inc. and Fulcrum Therapeutics outside the submitted work; in addition, P. Trojer has a patent for WO2024015566(A1) pending. No disclosures were reported by the other authors.

Figures

Figure 1.
Figure 1.
Identification and characterization of tulmimetostat, a highly potent, long residence time EZH2 inhibitor. A, Chemical structure of tulmimetostat. B, Determination of tulmimetostat and tazemetostat-binding kinetics for the PRC2 protein complex. Representative data for association (left) and dissociation (right) rate determinations by TR-FRET are shown for both compounds and reported from two or more independent determinations ± SD. For association, tulmimetostat kon = 8.7 (±2) × 105 (mol/L)−1·second−1, tazemetostat kon = 5.6 (±1) × 105 (mol/L)−1·second−1. The residence times (t) are reported for koff [τ = (1/koff); for tulmimetostat, τ ∼ 96 (±10) days; for tazemetostat, τ ∼ 0.32 (±0.2) days]. C, HeLa cells were treated with increasing concentrations of tulmimetostat or tazemetostat for 72 hours, and global H3K27me3 levels were measured and normalized to total histone H3 levels to determine half-maximal inhibitory concentration (IC50) values calculated from the mean of duplicate experiments ± SEM. D, HT1376 cells were treated with tulmimetostat (25 nmol/L), valemetostat (25 nmol/L), PF-06821497 (100 nmol/L), MAK863 (EEDi; 100 nmol/L), CPI-1205 (1 µmol/L), and tazemetostat (1 µmol/L) for 4 days and then split for Western blot analysis (left) for replating and culturing in the presence of compounds (Treated) and for replating and culturing in the absence of compounds (Washout). Culturing was continued for indicated time points (24, 48, 72, and 96 hours), cells were harvested, and cell extracts subjected to Western blotting. Antibodies for Western blot analysis are indicated on the right and bottom of top and middle and right panels, respectively. E, HT1376 cells were cultured in the presence of tulmimetostat (25 nmol/L), valemetostat (25 nmol/L), and tazemetostat (1 µmol/L) for 4, 5, 6, 7, and 8 days, cells were harvested, total RNA extracted and analyzed by qPCR for the magnitude of ZNF467 transcript level change. Gene expression changes are represented as the fold change over control from the mean of internal quadruplicates ± SD. F, HT1376 cells were cultured as in E for 4 days, compounds were removed by media change, and cell culturing continued for various time periods (1, 2, 3, and 4 days). Cells were harvested, total RNA extracted and analyzed by qPCR for the magnitude of ZNF467 transcript level change. Gene expression changes are represented as the fold change over control from the mean of quadruplicates ± SD. G, Viability in response to tulmimetostat treatment at 6, 12, and 18 days in HT1376 cells. Data are represented as the mean of triplicate wells ± SD from one of three independent experiments. H,In vivo efficacy experiment in a HT1376 subcutaneous xenograft model was carried out to assess the impact of tulmimetostat on tumor growth. Tulmimetostat was dosed at 75 mg/kg orally (PO), QD for 13 or 27 days. Data are represented as the mean relative tumor volume per cohort and time point ± SEM, and n = 9 for vehicle and tulmimetostat QD13* arms, n = 6 for QD arm. TGI noted for day 27 and 34 relative to day 27 vehicle arm. P values calculated using two-way ANOVA up to day 27, ***, P < 0.0001. I, Tumor growth in individual animals of the cohort treated with tulmimetostat for 13 days from the experiment described in H is shown. Tumors (n = 3 for all time points except day 34, which n = 6) at various time points were analyzed for global H3K27me3 levels relative to total histone H3 levels. Vertical lines indicate tumor growth lag period post last tulmimetostat dose.
Figure 2.
Figure 2.
Tulmimetostat-mediated phenotypic responses are enriched in the context of ARID1A LOF mutations. A, Eighteen-day viability assay GI50 values for tulmimetostat in a panel of bladder cancer cell lines. Black bar indicates cell line carrying at least one ARID1A stop-gain (denoted by an *) or frameshift (fs) allele (from here on out denoted as ARID1A LOF mutant), as detailed below the chart. Green bar indicates line carrying a single missense mutation, whereas gray bars indicate those lines with no mutations in the coding region of ARID1A. Data represented as an average of duplicate wells ± SD and are representative of duplicate independent experiments. B, Summary of the mutation status of the major components of the BAF complex as well as KDM6A in the bladder cancer panel. Those noted in bold are the most frequently mutated in cancer (40). Red box, presence of a mutation; gray, wildtype for a given gene. C, Normalized global H3K27me levels in HT1197 (left) and T24 (right) cell lines following 72 hours of treatment across a dose range of tulmimetostat. Data represented as average of triplicate wells ± SD and are representative of quadruplicate independent experiments. D, Cell viability dose response curves in HT1197 (left) and T24 (right) cell lines over 18 days of treatment. Data represented as an average of duplicate wells ± SD and are representative of duplicate independent experiments. E, Cell cycle stage distribution in HT1197 (left) and T24 (right) cell lines treated with tulmimetostat for 12 days. Data are represented as average of duplicate wells ± SD and are representative of duplicate independent experiments. F, TGI after treatment with 10, 25, 75, and 150 mg/kg tulmimetostat orally, QD or vehicle in HT1376 bladder cancer xenografts. Data represented as mean tumor volume ± SEM, with n = 5 mice per group for all groups except 150 mg/kg, which had n = 3. P values calculated using two-way ANOVA up to day 30, ns, nonsignificant, P > 0.05; *, P < 0.05. G, TGI in an ARID1A mutant PDX model of bladder cancer (BL9209) treated with tulmimetostat at 75 mg/kg orally, QD. Data represented as mean tumor volume ± SEM, with n = 3 mice per group. TGI calculated using tumor volumes at day 28, *, P < 0.05 using two-way ANOVA through day 28, when vehicle reached endpoint. H, TGI in an ARID1A mutant PDX model of endometrial cancer (UT5319) treated with tulmimetostat. Mice were initially treated with 75 mg/kg orally, QD; dose was reduced to 50 mg/kg orally, QD after day 23. Data represented as mean tumor volume ± SEM, with n = 3 mice per group. TGI calculated using tumor volumes at day 21, ***, P < 0.0001 using two-way ANOVA through day 21, when vehicle reached endpoint. I, TGI in an ARID1A mutant PDX model of endometrial cancer (UT5326) treated with tulmimetostat at 75 mg/kg orally, QD. Data represented as mean tumor volume ± SEM, with n = 5 mice per group. TGI calculated using tumor volumes at day 49, *, P < 0.05 using two-way ANOVA through day 49, when study reached endpoint.
Figure 3.
Figure 3.
Tulmimetostat treatment increases the expression of PRC2 occupied and repressed genes in ARID1A mutant bladder cancer cells. A, Quantification of genome-wide H3K27me3 ChIP-seq enrichment on transcription start site (TSS) regions in HT1376 cells treated with 250 nmol/L tulmimetostat for 8 days. B, Integrative Genomics Viewer snapshots of H3K27me3, EZH2, and H3K27ac chromatin binding detected by ChIP-seq around four representative PRC2 target genes (CDKN1C, SLFN11, ZNF467, and FXYD6) following DMSO or tulmimetostat treatment. C, Volcano plot showing gene expression changes in HT1376 cells treated with DMSO or 250 nmol/L tulmimetostat for 4 days. Colored dots indicate absolute log2-fold change ≥ 1 and FDR ≤ 0.05. D, Heatmaps of H3K27me3 and EZH2 ChIP-seq data in HT1376 cells showing baseline (DMSO treated) occupancy of TSS regions for genes that are upregulated following tulmimetostat treatment in HT1376 cells. Right, RNA-seq heatmap of log2-fold changes of these same genes (in the same order) after treatment. E, GSEA of tulmimetostat upregulated genes showing the top 10 enriched gene signatures. Red bars, gene sets related to H3K27me3/PRC2.
Figure 4.
Figure 4.
Tulmimetostat treatment results in greater upregulation of PRC2 target gene expression in phenotypically sensitive ARID1A LOF cell lines. A, PCA of eight bladder cancer cell line samples treated with DMSO (baseline), colored based on their 18-day GI50 (as described in Fig. 2A), with the heatmap shown below. Top 100 genes contributing negatively to PC1 are referred to as “PC1-negative” and top 100 genes contributing positively to PC1 are referred to as “PC1-positive” here and throughout. B, GSEA showing enrichment of expression of the PC1-positive genes in A in resistant cell lines compared with sensitive cell lines in larger 21 cell line panel. C, Top gene sets significantly enriched (FDR < 0.01) from the C2 curated gene set list from MSigDB in the PC1-positive genes and PC1-negative genes. Red bars, PRC2-related gene sets. D, Scatter plot of gene expression changes of PC1-positive genes in response to tulmimetostat treatment in sensitive and resistant cell lines. Those genes that were induced (log2-fold change > 0) in sensitive cells but unchanged or down in resistant cells (log2-fold change ≤ 0) are highlighted in green. E, Heatmap of H3K27me3 ChIP-seq enrichment on gene body and flanking regions of the PC1-positive genes (blue; top) or the PC1-negative genes (green; bottom) in HT1376 cells treated with 250 nmol/L tulmimetostat for 4 days. Quantification of peaks within gene sets represented by histogram across the top. F, Scatter plot of gene expression changes in response to tulmimetostat treatment in sensitive and resistant cell lines. Those genes that were induced (log2-fold change > 0) in sensitive cells but unchanged or down in resistant cells (log2-fold change ≤ 0; 132 “sensitive-up” genes) are highlighted in green. G, GSEA showing enrichment of expression of “sensitive-up” gene set at baseline (DMSO treated) in resistant cell lines compared with sensitive cell lines. H, Heatmap of H3K27me3 ChIP-seq enrichment on gene body and flanking regions of “sensitive-up” gene set at baseline in HT1376 cells (DMSO treated). Quantification of peaks represented by histogram across the top.
Figure 5.
Figure 5.
Tulmimetostat improves cisplatin responsiveness in chemotherapy-resistant bladder cancer cells. A, TGI of tulmimetostat monotherapy, cisplatin monotherapy, or the combination in HT1376 bladder cancer xenografts. Data represented as mean ± SEM. n = 9 mice for vehicle; n = 6 mice each for tulmimetostat, cisplatin, and the combination arms. TGI values noted were calculated for all arms using day 27 tumor volumes, relative to vehicle. *, P < 0.05; **, P < 0.01; ***, P < 0.0001 using two-way ANOVA up to day 27 (for TGIs) or through day 41 (for P values on the graph). B, Cisplatin GI50 shifts in HT1376 cells following pretreatment (7 days) and combination (5 days) with various nmol/L concentrations of tulmimetostat in 12-day assay. Dashed line shows the tulmimetostat GI50 at 12 days when assay was repeated (see Supplementary Fig. S5D), indicating that all shifts were occurring at sub-GI50 doses of tulmimetostat.
Figure 6.
Figure 6.
Tulmimetostat demonstrates superior level of tumor PRC2 target gene induction correlating with efficacy in the HT1376 bladder cancer CDX model. A, Cell viability dose response curve for various EZH2 and EED inhibitors in HT1376 bladder cancer cells on day 18. GI50s noted. Data are represented as mean ± SD. B, HT1376 xenograft efficacy study of various EZH2 and EED inhibitors. Data represented as mean ± SEM, with n = 6 mice per group for all arms except tulmimetostat, which had n = 12. TGI values noted were calculated for all arms using day 27 tumor volumes, relative to vehicle. P values calculated using two-way ANOVA, *, P < 0.05; **, P < 0.01; ***, P < 0.0001 using two-way ANOVA up to day 27 (for TGIs) or through day 55 (for P values on the graph). C, H3K27me3 levels from tumor samples collected at day 15 from study depicted in B. Data represented as mean ± SD, n = 3 tumors per group. P values calculated using unpaired Student t test, **, P < 0.01; ***, P < 0.0001. D, Scatter plot showing relationship between relative H3K27me3 levels and tumor size. The relative H3K27me3/H3 ratio from tumor samples collected at day 15 of each group was normalized to that of vehicle group. The tumor volume of each group was measured at day 27. P value was calculated by Pearson correlation coefficient. E, Bar plot of expression changes of EZH2 target genes (defined in Supplementary Fig. S3G) at day 15 relative to vehicle for the tumors from B. Data represented as mean log2-fold change ± 95% confidence interval.
Figure 7.
Figure 7.
In patients with cancer, tulmimetostat plasma exposure levels correlate with magnitude of PRC2 target gene expression changes in peripheral blood. A, Plasma concentration profiles of tulmimetostat in patients in CPI-0209-01 clinical trial at C1D1. Plasma concentration shown as the mean after oral administration of indicated dose of tulmimetostat. B, Plasma concentration profiles of tulmimetostat in patients in CPI-0209-01 clinical trial at C2D1. Plasma concentration shown as the mean after oral administration of indicated dose of tulmimetostat. C, Change of H3K27me3/total H3 ratio in monocytes at C1D8 compared with baseline (C1D1). Points whose values were <−100% were plotted as “−100%” to indicate maximal signal reduction. D, Heatmap of log2-fold changes of the gene expression associated with tulmimetostat exposure in whole blood from patients treated with tulmimetostat. Each column represents an individual patient ordered by increasing tulmimetostat plasma exposures at C1D1 (from left to right). E, GSEA of tulmimetostat-induced genes. Top gene sets significantly enriched from C2 curated gene set list (FDR ≤ 0.01) from MSigDB in the 1,551 genes induced by tulmimetostat treatment in patient whole blood samples. Red bars, PRC2-related gene sets. F, Scatter plot showing relationship between tulmimetostat-induced gene expression changes in the whole blood transcriptome of preclinical mouse models and patients enrolled in the CPI-0209-01 clinical trial. The average expression changes of 379 genes induced in clinical samples within each patient’s whole blood between C1D1 and C1D22 are plotted against the tulmimetostat exposure of that patient at C1D1. Dose levels of tulmimetostat are indicated in mg. The horizontal red dotted line indicates the average expression changes of these genes in whole blood of mice treated with 35 mg/kg tulmimetostat compared with vehicle.

References

    1. Gonzalez-Perez A, Jene-Sanz A, Lopez-Bigas N. The mutational landscape of chromatin regulatory factors across 4,623 tumor samples. Genome Biol 2013;14:r106. - PMC - PubMed
    1. Kandoth C, McLellan MD, Vandin F, Ye K, Niu B, Lu C, et al. . Mutational landscape and significance across 12 major cancer types. Nature 2013;502:333–9. - PMC - PubMed
    1. Robertson AG, Kim J, Al-Ahmadie H, Bellmunt J, Guo G, Cherniack AD, et al. . Comprehensive molecular characterization of muscle-invasive bladder cancer. Cell 2017;171:540–56.e25. - PMC - PubMed
    1. Conery AR, Rocnik JL, Trojer P. Small molecule targeting of chromatin writers in cancer. Nat Chem Biol 2022;18:124–33. - PubMed
    1. Helming KC, Wang X, Wilson BG, Vazquez F, Haswell JR, Manchester HE, et al. . ARID1B is a specific vulnerability in ARID1A-mutant cancers. Nat Med 2014;20:251–4. - PMC - PubMed

Publication types

MeSH terms