

Exploring the relationship between hemodynamics and the immune microenvironment in carotid atherosclerosis: Insights from CFD and CyTOF technologies
- PMID: 38833561
- PMCID: PMC11494853
- DOI: 10.1177/0271678X241251976
Exploring the relationship between hemodynamics and the immune microenvironment in carotid atherosclerosis: Insights from CFD and CyTOF technologies
Abstract
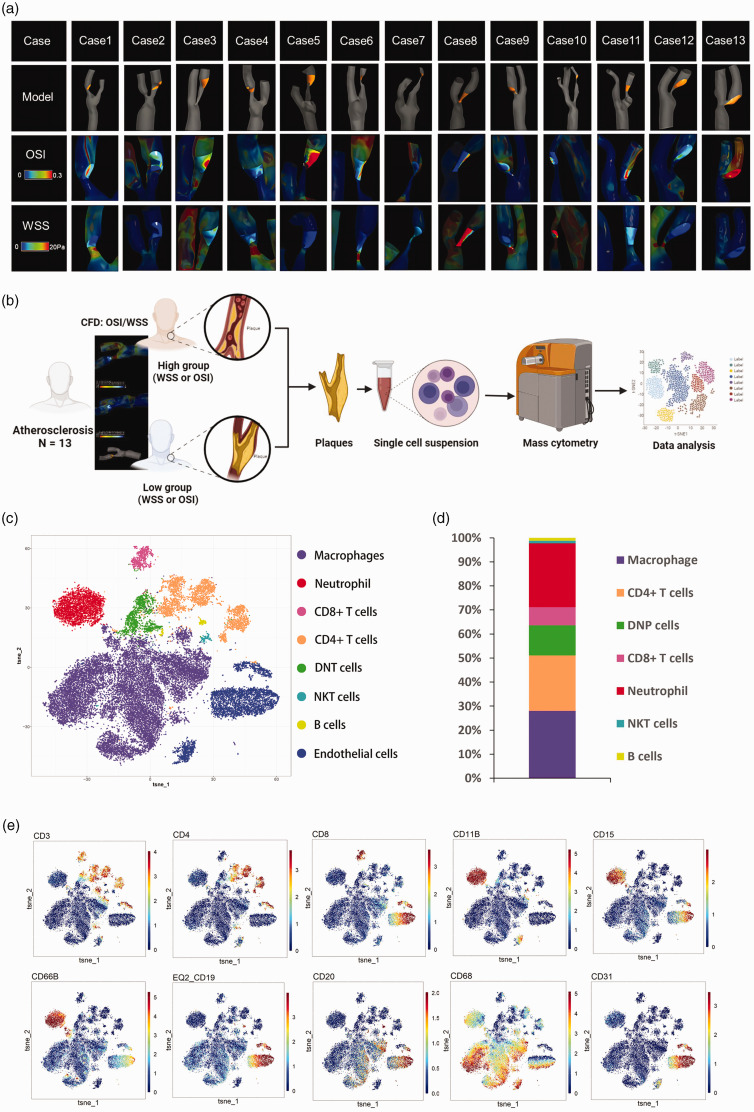
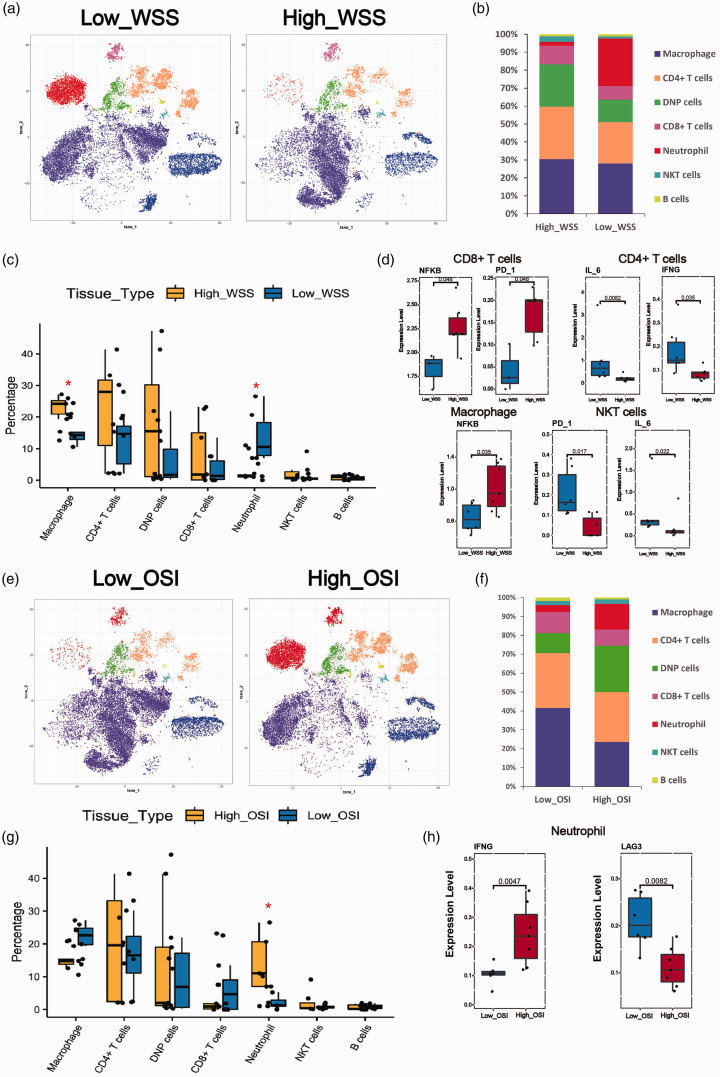
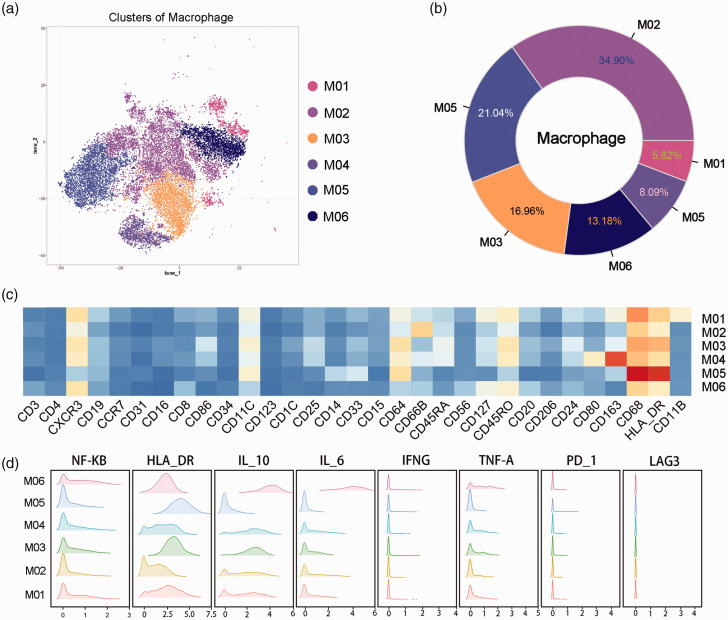
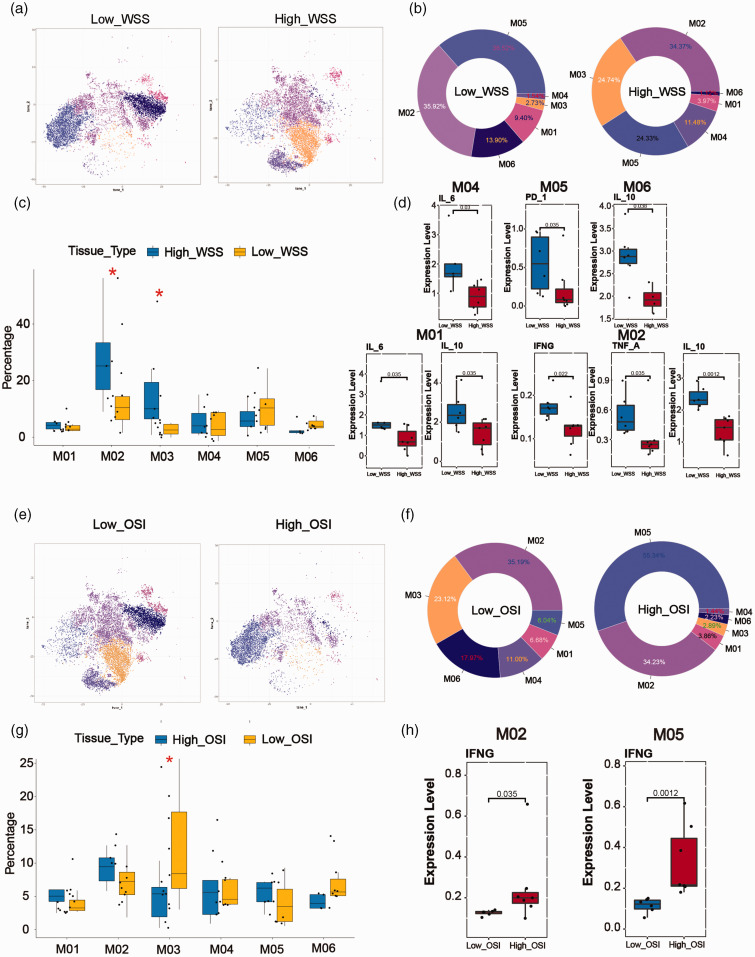
Carotid atherosclerosis is a major cause of stroke. Hemodynamic forces, such as shear stress and oscillatory shear, play an important role in the initiation and progression of atherosclerosis. The alteration of the immune microenvironment is the fundamental pathological mechanism by which diverse external environmental factors impact the formation and progression of plaques. However, Current research on the relationship between hemodynamics and immunity in atherosclerosis still lack of comprehensive understanding. In this study, we combined computational fluid dynamics (CFD) and Mass cytometry (CyTOF) technologies to explore the changes in the immune microenvironment within plaques under different hemodynamic conditions. Our results indicated that neutrophils were enriched in adverse flow environments. M2-like CD163+CD86+ macrophages were predominantly enriched in high WSS and low OSI environments, while CD163-CD14+ macrophages were enriched in low WSS and high OSI environments. Functional analysis further revealed T cell pro-inflammatory activation and dysregulation in modulation, along with an imbalance in M1-like/M2-like macrophages, suggesting their potential involvement in the progression of atherosclerotic lesions mediated by adverse flow patterns. Our study elucidated the potential mechanisms by which hemodynamics regulated the immune microenvironment within plaques, providing intervention targets for future precision therapies.
Keywords: CFD; Carotid atherosclerosis; CyTOF; hemodynamic; immune environment.
Conflict of interest statement
Declaration of conflicting interestsThe author(s) declared no potential conflicts of interest with respect to the research, authorship, and/or publication of this article.
Figures
Similar articles
-
Wall Shear Stress (WSS) Analysis in Atherosclerosis in Partial Ligated Apolipoprotein E Knockout Mouse Model through Computational Fluid Dynamics (CFD).Int J Mol Sci. 2024 Sep 12;25(18):9877. doi: 10.3390/ijms25189877. Int J Mol Sci. 2024. PMID: 39337364 Free PMC article.
-
Hemodynamic Factors Affecting Carotid Sinus Atherosclerotic Stenosis.World Neurosurg. 2019 Jan;121:e262-e276. doi: 10.1016/j.wneu.2018.09.091. Epub 2018 Sep 24. World Neurosurg. 2019. PMID: 30261386
-
The influence of anesthesia and fluid-structure interaction on simulated shear stress patterns in the carotid bifurcation of mice.J Biomech. 2016 Sep 6;49(13):2741-2747. doi: 10.1016/j.jbiomech.2016.06.010. Epub 2016 Jun 15. J Biomech. 2016. PMID: 27342001
-
Mechanisms and treatment of atherosclerosis: focus on macrophages.Front Immunol. 2024 Nov 6;15:1490387. doi: 10.3389/fimmu.2024.1490387. eCollection 2024. Front Immunol. 2024. PMID: 39569201 Free PMC article. Review.
-
A comparison of 4D flow MRI-derived wall shear stress with computational fluid dynamics methods for intracranial aneurysms and carotid bifurcations - A review.Magn Reson Imaging. 2018 May;48:62-69. doi: 10.1016/j.mri.2017.12.005. Epub 2017 Dec 6. Magn Reson Imaging. 2018. PMID: 29223732 Review.
Cited by
-
Endovascular structures of the basilar artery as forms of the basilar nonfusion spectrum.Sci Rep. 2025 Aug 1;15(1):28192. doi: 10.1038/s41598-025-14558-z. Sci Rep. 2025. PMID: 40750985 Free PMC article.
-
Expert Consensus on the Diagnosis and Management of Carotid Atherosclerotic Plaque: Pathophysiology, Clinical Management, and Preventive Approaches.Int J Med Sci. 2025 May 30;22(11):2738-2756. doi: 10.7150/ijms.107479. eCollection 2025. Int J Med Sci. 2025. PMID: 40520900 Free PMC article. Review.
References
-
- Feigin VL, Norrving B, Mensah GA. Global burden of stroke. Circ Res 2017; 120: 439–448. - PubMed
-
- Mozaffarian D, Benjamin EJ, Go AS, et al.. Heart disease and stroke statistics – 2016 update: a report from the American Heart Association. Circulation 2016; 133: e38-360–360. - PubMed
-
- Gupta A, Baradaran H, Schweitzer AD, et al.. Carotid plaque MRI and stroke risk: a systematic review and meta-analysis. Stroke 2013; 44: 3071–3077. - PubMed
-
- Lorenz MW, Markus HS, Bots ML, et al.. Prediction of clinical cardiovascular events with carotid intima-media thickness: a systematic review and meta-analysis. Circulation 2007; 115: 459–467. - PubMed
MeSH terms
LinkOut - more resources
Full Text Sources
Medical
Research Materials
Miscellaneous
