. 2024 Sep 2;196(1):77-94.
doi: 10.1093/plphys/kiae316.

Development of a rapamycin-inducible protein-knockdown system in the unicellular red alga Cyanidioschyzon merolae

Affiliations

Development of a rapamycin-inducible protein-knockdown system in the unicellular red alga Cyanidioschyzon merolae

Takayuki Fujiwara et al. Plant Physiol. .

Abstract

An inducible protein-knockdown system is highly effective for investigating the functions of proteins and mechanisms essential for the survival and growth of organisms. However, this technique is not available in photosynthetic eukaryotes. The unicellular red alga Cyanidioschyzon merolae possesses a very simple cellular and genomic architecture and is genetically tractable but lacks RNA interference machinery. In this study, we developed a protein-knockdown system in this alga. The constitutive system utilizes the destabilizing activity of the FK506-binding protein 12 (FKBP12)-rapamycin-binding (FRB) domain of human target of rapamycin kinase or its derivatives to knock down target proteins. In the inducible system, rapamycin treatment induces the heterodimerization of the human FRB domain fused to the target proteins with the human FKBP fused to S-phase kinase-associated protein 1 or Cullin 1, subunits of the SCF E3 ubiquitin ligase. This results in the rapid degradation of the target proteins through the ubiquitin-proteasome pathway. With this system, we successfully degraded endogenous essential proteins such as the chloroplast division protein dynamin-related protein 5B and E2 transcription factor, a regulator of the G1/S transition, within 2 to 3 h after rapamycin administration, enabling the assessment of resulting phenotypes. This rapamycin-inducible protein-knockdown system contributes to the functional analysis of genes whose disruption leads to lethality.


Conflict of interest statement

Conflict of interest statement. None declared.

Figures
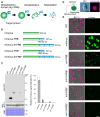
Figure 1.
Figure 1.
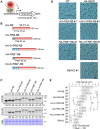
A constitutive protein knockdown utilizing the human FRB domain and its derivative in C. merolae. A) A schematic illustration of the degradation process of an FRB-conjugated target protein. The presence of FRB leads to the destabilization of the target protein, ultimately resulting in the degradation of both the FRB and the target protein. B) The structures of mVenus (the target protein here) and the 4 types of human FRB-fused mVenus expressed in C. merolae. FRB, 3×FRB, FRB*, and 3×FRB* tags were attached to the carboxy-terminus of mVenus. FRB* contains 3 mutations (K72P, T75L, and W78F), denoted with + in the illustration, which has been reported to exhibit a higher destabilizing effect than the WT FRB (Stankunas et al. 2003). Although not indicated in the illustration, there is a 6×G peptide linker between mVenus and any FRB tag. C) Immunoblotting comparing the efficiency of the 4 different types of FRB tags in reducing mVenus level in the cells. The left panel shows the immunoblot using the anti-GFP antibody, which reacts with mVenus, to compare the levels of mVenus in the cells expressing mVenus alone or mVenus conjugated with the 4 types of FRB tags. The WT cell was used as a negative control. The immunoblot using the eukaryotic translation elongation factor 2 (eEF-2) antibody and the Coomassie brilliant blue (CBB)-stained PVDF membrane are also shown as loading controls. The predicted molecular weights based on the amino acid sequence of mVenus, mVenus-FRB, mVenus-3×FRB, mVenus-FRB*, and mVenus-3×FRB* are 26, 37, 58, 37, and 58 kDa, respectively. The right panel shows a bar graph quantifying the protein levels. The signal intensity of mVenus alone was set as 100%. The values represent the mean of technical triplicate of the immunoblotting results, and the bars indicate the Sd. Note that both 3×FRB-fused and 3×FRB*-fused mVenus proteins were undetectable in the immunoblotting. D) An illustration, as well as the differential interference contrast (DIC) and fluorescent micrographs of the C. merolae cell in the G1 phase. The cell possesses a single chloroplast and mitochondrion. The chloroplast emits red fluorescence. The scale bar represents 2 µm in all images in D). E) Fluorescent microscopic images of the cells expressing mVenus or that conjugated with the 4 different kinds of FRB tag. WT served as a negative control. The images in the left and right column represent autofluorescence from chloroplasts (Chl) and mVenus fluorescence, respectively. For the images of Chl, those of the bright field (BF) were merged. The scale bar represents 5 µm in all images in E).
Figure 2.
Figure 2.
Application of an FRB-tag-mediated knockdown for RB protein. A) A schematic illustration of the function of RB as a negative regulator of G1/S transition. RB directly binds E2F and inhibits E2F-DP heterodimer to transcribe S-phase genes. The arrow line indicates positive regulation of the transcription of S-phase genes by E2F, whereas the T-shaped line indicates negative regulation by RB. CDK-cyclin accumulates in accordance with cellular growth during the G1 phase, phosphorylating RB, which results in RB inactivation and allows E2F-DP to transcribe S-phase genes. B) The structures of HA-RB and the 4 types of FRB-inserted HA-RB variants expressed in C. merolae. FRB, 3×FRB, FRB*, and 3×FRB* were inserted between HA and the amino terminus of RB. FRB* contains 3 mutations (K72P, T75L, and W78F), denoted with a + in the illustration. Although not indicated in the illustration, a GGGGS peptide linker was inserted between 3× HA and RB in the HA-RB protein. Additionally, a 6×G peptide linker was inserted between each FRB tag and RB. C) Immunoblotting comparing the efficiency of the 4 different types of FRB tags in reducing RB level in the cells. RB and HA-RB were detected using the anti-RB and an anti-HA antibody, respectively. For each strain other than WT, the results of 2 independent transformants (#1 and #2) are shown. The predicted molecular weights based on the amino acid sequence of RB, HA-RB, HA-FRB-RB, HA-3×FRB-RB, HA-FRB*-RB, and HA-3×FRB*-RB are 101, 105, 115, 136, 115, and 136 kDa, respectively. The values below the bands indicate the relative signal intensities of RB, HA-RB, and HA-FRB-RB proteins. The average signal intensity of 2 independent clones (#1 and #2) of HA-RB was set to 100%. The CBB-stained PVDF membrane is also shown as a loading control. D) DIC images of WT, HA-RB, and the 3 kinds of HA-FRB-RB strains. The results for Clone #1 are presented for each strain. Images of Clone #1 and Clone #2 for each strain are provided in Supplementary Fig. S1. The scale bar represents 5 µm in all images in D). E) A box plot comparing the cell volume of WT, HA-RB, the 3 types of HA-FRB-RB, and RB-KO strains. The results for 2 independent clones (#1 and #2) are shown for each transformant. The box extends from the first to the third quartile, with the vertical line representing the median, the cross indicating the mean, and the error bar indicating the Sd. NS, not significant; *P < 0.01 (Student’s t-test; pairwise comparisons between the 2 clones). The histograms representing the distribution of cell volume in respective strains are shown in Supplementary Fig. S1.
Figure 3.
Figure 3.
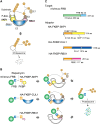
Diagram of a rapamycin-inducible protein-knockdown system. A) The flow of ubiquitination of a substrate protein through the SCF E3 ligase complex, which results in degradation of the substrate protein in proteasome. An E1 ubiquitin-activating enzyme initiates ubiquitination by activating and transferring a ubiquitin to an E2 ubiquitin-conjugating enzyme. The E2 enzyme then ubiquitinates a substrate protein captured by the SCF complex. The SCF complex consists of a F-box protein, SKP1, CUL1, and RBX1. The F-box proteins determine the substrate specificity for the SCF complex. SKP1 mediates the interaction between F-box proteins and CUL1, which serves as a primary scaffold protein. RBX1 connects CUL1 to the E2 ubiquitin-conjugating enzyme. B) The experimental design of the rapamycin-inducible protein-knockdown system. The SCF E3-ligase complex was employed for ubiquitination of a target protein. The rapamycin-mediated heterodimerization of FRB domain (of TOR kinase) and FKBP protein was utilized to facilitate the incorporation of the target protein (mVenus, in this case) into the SCF complex. By fusing the human FRB domain to a target protein and expressing an SCF complex component fused with the human FKBP, followed by the addition of rapamycin, the target protein is expected to be captured by the SCF complex and degraded via the ubiquitin-proteasome pathway. In this study, we evaluated the efficiency of fusing FKBP to SKP1, CUL1, or RBX1 as SCF components for the degradation of mVenus-FRB upon the addition of rapamycin. C) The structures of mVenus-FRB, HA-FKBP-SKP1, HA-FKBP-CUL1, and HA-FKBP-RBX1 expressed in C. merolae.
Figure 4.
Figure 4.
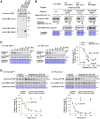
Evaluation of the rapamycin-inducible protein-knockdown system in C. merolae. A) Immunoblotting using the anti-HA antibody confirmed the expression of HA-FKBP-SKP1, HA-FKBP-CUL1, and HA-FKBP-RBX1 in the mVRD-SKP1, mVRD-CUL1, and mVRD-RBX1 strains, respectively, where mVenus-FRB is also expressed. The predicted molecular weights based on the amino acid sequence of mVenus-FRB, HA-FKBP-SKP1, HA-FKBP-CUL1, and HA-FKBP-RBX1 are 37, 37, 127, and 29 kDa, respectively. WT and mV-FRB strains were used as negative controls. B) Immunoblotting comparing the efficiency of rapamycin-induced degradation of mVenus-FRB in the mVRD-SKP1, mVRD-CUL1, and mVRD-RBX1 strains. For each culture, 500 nm rapamycin or DMSO (a control) was added and the cells were harvested 2 h after the addition. The mV-FRB was used as a negative control. mVenus-FRB protein was detected with the anti-GFP antibody. The CBB-stained PVDF membrane is also shown as a loading control. The values below the bands indicate the relative signal intensities of the mVenus-FRB protein. The average and Sd of immunoblotting of 3 independent transgenic clones are indicated for each strain. The signal intensity in each strain in the absence of rapamycin was set to 100%. C) Degradation efficiency of mVenus-FRB at different concentrations of rapamycin. Immunoblotting showing the relative level of mVenus-FRB protein in the mVRD-SKP1 and mVRD-CUL1 culture 2 h after the addition of 0, 10, 50, 100, 500, 1,000, and 2,500 nm rapamycin. The accompanying graph shows the change in mVenus-FRB protein level obtained from biological triplicates. The signal intensity in each strain in the absence of rapamycin was set to 100%. The degradation concentrations (DC50) in mVRD-SKP1 and mVRD-CUL1, as shown in the graph, were calculated using the quartic approximation equations in Microsoft Excel. D) Degradation kinetics of mVenus-FRB protein. Immunoblotting showing the time course of the changes in the relative level of mVenus-FRB protein in mVRD-SKP1 and mVRD-CUL1 culture after the addition of 500 nm rapamycin. The accompanying graph illustrates the changes in mVenus-FRB protein levels, quantified from biological triplicate immunoblotting. The signal intensity just before the rapamycin addition in each strain was set to 100%. The half-lives (t1/2) of mVenus-FRB in the mVRD-SKP1 and mVRD-CUL1 strains, as shown in the graph, were calculated using the quartic approximation equations in Microsoft Excel.
Figure 5.
Figure 5.
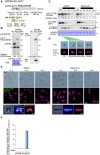
Application of the rapamycin-inducible knockdown system for the chloroplast division protein DRP5B. A) The structures of mVenus-FL-FRB-DRP5B and HA-FKBP-SKP1 expressed in the DRP5BRD-SKP1. mVenus, 4×FLAG (FL), and FRB were fused to the amino-terminus of DRP5B for visualizing protein localization, immunological protein detection, and rapamycin-inducible interaction with HA-FKBP-SKP1, respectively. A GSGSG peptide linker was inserted between mVenus and FL. Additionally, a 6×G peptide linker was inserted between FRB and DRP5B. The structure of the HA-FKBP-SKP1 is shown in Fig. 3. B) Immunoblotting confirmed expression of mVenus-FL-FRB-DRP5B and HA-FKBP-SKP1 in the DRP5BRD-SKP1 knock-in strain. An anti-DRP5B antibody detected DRP5B protein in WT, while in DRP5BRD-SKP1 strain, only mVenus-FL-FRB-DRP5B protein was detected indicating that mVenus-FL-FRB-DRP5B was successfully integrated into the chromosomal DRP5B locus. The arrow indicates a nonspecific band. Anti-FLAG and anti-HA antibodies detected mVenus-FL-FRB-DRP5B and HA-FKBP-SKP1, respectively, in the DRP5BRD-SKP1 strain. The CBB-stained PVDF membrane is also shown as a loading control. The predicted molecular weights based on the amino acid sequence of DRP5B, mVenus-FL-FRB-DRP5B, and HA-FKBP-SKP1 are 106, 146, and 37 kDa, respectively. The values below the bands indicate the relative signal intensities of the DRP5B (DRP5B or mV-FL-FRB-DRP5B) protein. The signal intensity of DRP5B in WT was set to 100%. C) Rapamycin-induced degradation of mVenus-FL-FRB-DRP5B protein in the DRP5BRD-SKP1 strain. Cell cycle progression and accompanying chloroplast division were synchronized under the LD cycle. The white and black bars above the immunoblot represent light and dark periods, respectively. Immunoblotting using the anti-FLAG antibody shows the change in the level of mVenus-FL-FRB-DRP5B protein during the LD cycle. DMSO, as a negative control, or 500 nm rapamycin was added at Hour 9 (indicated by the red arrowhead), which corresponds to 3 h prior to the peak of mVenus-FL-FRB-DRP5B protein level in the culture without rapamycin. The change in α-tubulin (detected by the anti-α-tubulin antibody; expressed specifically during S and M phases in C. merolae; Fujiwara, Tanaka, et al. 2013) is also shown. The CBB-stained PVDF membrane is shown as a loading control. The values below the bands indicate the relative signal intensities of the mV-FL-FRB-DRP5B protein. The signal intensity at Hour 12 in the absence of rapamycin was set to 100%. D) DIC and fluorescent microscopy of the DRP5BRD-SKP1 cells. The images were aligned in the order of cell cycle progression (note that the images are not from an identical cell). The top panels represent the cell before, during, and after chloroplast division. The lower panels are merged images of the mVenus fluorescence of mVenus-FL-FRB-DRP5B and the autofluorescence from chloroplasts (Chl). As observed in WT cells (Miyagishima et al. 2003), mVenus-FL-FRB-DRP5B proteins localize at the chloroplast division site. As in WT cells, in DRP5BRD-SKP1 cells, the chloroplast division synchronously occurs between Hours 12 and 15 under the LD. The green structures within the cell are chloroplasts. The scale bar represents 2 µm in all images in D). E) The chloroplast division defect caused by the degradation of mVenus-FL-FRB-DRP5B. DIC and fluorescent images of DMSO- or rapamycin-treated DRP5BRD-SKP1 cells at Hours 12, 18, and 24 under LD are shown. In the DMSO-treated culture, cells with dividing chloroplast and the mVenus-FL-FRB-DRP5B signal at the division site accumulated at Hour 12, while most of the cells had completed chloroplast division at Hour 18. In contrast, in the rapamycin-treated culture, mVenus-FL-FRB-DRP5B was faintly detectable, and constriction of the chloroplast division site was not observed in any cells at Hour 12. At Hours 18 and 24, irregularly shaped cells with a single chloroplast accumulated. The scale bar represents 5 µm in the upper and middle images in E). The bottom panels show the phase-contrast (PC), DAPI-staining, and immunofluorescent images of the DRP5BRD-SKP1 cells. The bottom-left image represents a typical telophase cell in which chloroplast division and following mitochondrial division and chromosome segregation have been completed. The bottom-right image represents an irregularly shaped cell in which chloroplast division has been blocked, while mitochondrial division and chromosome segregation have been completed. n, nuclear DNA; mn, mitochondrial nucleoid DNA; cn, chloroplast nucleoid DNA. The scale bars represent 2 µm in the bottom images in E). F) A bar graph comparing the percentage of cells with an irregular shape, possessing a single chloroplast and 2 nuclei between the DMSO-treated and the rapamycin-treated cultures at Hour 18. DAPI-stained cells were counted (n > 300). The averages and Sd were calculated from biological triplicates.
Figure 6.
Figure 6.
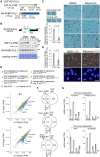
Investigation of the E2F-dependent transcriptome using rapamycin-induced degradation of E2F. A) The structures of E2F-FL-FRB and HA-FKBP-CUL1 expressed in the E2FRD-CUL1 knock-in strain. 4×FLAG (FL) and FRB were fused to the carboxy-terminus of E2F for immunological protein detection and rapamycin-inducible interaction with HA-FKBP-CUL1, respectively. The 6×G peptide linker was inserted between FL and FRB. B) Immunoblotting with the anti-FLAG antibody confirmed rapamycin-induced degradation of E2F-FL-FRB protein in the E2FRD-CUL1 strain. DMSO as a negative control, or 500 nm rapamycin was added at Hour 4 under LD. The white and black bar indicates light and dark periods, respectively. “G1” and “S/M” below the bar indicate the G1 phase and the S and M phases of the cell cycle, respectively. The light blue line below the bar represents the period from the S to M phases. The immunoblotting of HA-FKBP-CUL1 with an anti-HA antibody is also shown. The CBB-stained PVDF membrane is also shown as a loading control. The predicted molecular weight based on the amino acid sequence of E2F-FL-FRB and HA-FKBP-CUL1 is 111 and 127 kDa, respectively. C) Comparison of the cell cycle progression between the DMSO and rapamycin-treated E2FRD-CUL1 synchronous cultures. The cell cycle stage was divided into I (vertically elongated cells; early G1), II (enlarged cells; late G1), III (cells with a dividing chloroplast; M, prophase), IV (cells with 2 divided chloroplasts; M, metaphase), and V (cells during cytokinesis) according to Fujiwara, Tanaka, et al. (2013), and the percentage of the sum of cells in Stages III, IV, and V is compared at Hour 12. The values represent the mean of 3 independent cultures, and the bars indicate the Sd (n > 200). P < 0.01 (Student’s t-test). The scale bar represents 2 µm in the 5 typical cell images showing the cell cycle phases, which are above the bar graph, and 5 µm in the 6 images that are to the right of the bar graph. The arrowheads indicate dividing cells. D) Immunofluorescence microscopy comparing the frequency of the cells expressing PCNA (S phase) at Hour 12 between the DMSO and rapamycin-treated E2FRD-CUL1 synchronous cultures. PCNA protein was detected with the anti-PCNA antibody and DNA was stained with DAPI. The values represent the mean of 3 independent cultures, and the bars indicate the Sd (n > 200). P < 0.01 (Student's t-test). n, nuclear DNA; mn, mitochondrial nucleoid DNA; cn, chloroplast nucleoid DNA. The scale bar represents 5 µm in all images in D). E) Scatter plots comparing the transcriptome (RNA-seq results) between the DMSO and rapamycin-treated E2FRD-CUL1 cultures. Transcripts per kilobase million (TPM) values were averaged from 4 biological replicates. Genes downregulated or upregulated (FDR of <0.01 and a log2 fold-change of >+1 or <−1) in the presence of rapamycin are represented by blue or yellow circles, respectively. Above the graphs, there is an explanation of what each symbol represents. In brief, the blue and yellow circles without crosses indicate genes that were downregulated and upregulated by the degradation of E2F. F) Venn diagrams classifying the genes downregulated by the rapamycin-induced degradation of E2F as either CCD or cell cycle–independent ones. Four hundred forty-five CCD genes in C. merolae were identified in a previous study (Fujiwara et al. 2020). G) Bar graphs showing mRNA levels of PCNA, RNRβ1, phosphate/PPT, and mitochondrial 60-kDa chaperonin (mtCPN60), which were downregulated by the rapamycin-induced degradation of E2F. Of these, PCNA and RNRβ1 are CCD, while PPT and mtCPN60 are not. These genes were also indicated in C by the red or pink symbols. The values represent the mean of 4 independent RNA sequencing, and the bars indicate the Sd.

Similar articles

Cited by

References

    1. Abram M, Białek R, Szewczyk S, Karolczak J, Gibasiewicz K, Kargul J. Remodeling of excitation energy transfer in extremophilic red algal PSI-LHCI complex during light adaptation. Biochim Biophys Acta Bioenerg. 2020:1861(1):148093. 10.1016/j.bbabio.2019.148093 - DOI - PubMed
    1. Ambrus AM, Islam ABMMK, Holmes KB, Moon NS, Lopez-Bigas N, Benevolenskaya EV, Frolov MV. Loss of dE2F compromises mitochondrial function. Dev Cell. 2013:27(4):438–451. 10.1016/j.devcel.2013.10.002 - DOI - PMC - PubMed
    1. An C-I, Sawada A, Fukusaki E, Kobayashi A. A transient RNA interference assay system using Arabidopsis protoplasts. Biosci Biotechnol Biochem. 2003:67(12):2674–2677. 10.1271/bbb.67.2674 - DOI - PubMed
    1. Andrieu A, Breitler JC, Siré C, Meynard D, Gantet P, Guiderdoni E. An in planta, Agrobacterium-mediated transient gene expression method for inducing gene silencing in rice (Oryza sativa L.) leaves. Rice (N Y). 2012:5(1):23. 10.1186/1939-8433-5-23 - DOI - PMC - PubMed
    1. Bayle JH, Grimley JS, Stankunas K, Gestwicki JE, Wandless TJ, Crabtree GR. Rapamycin analogs with differential binding specificity permit orthogonal control of protein activity. Chem Biol. 2006:13(1):99–107. 10.1016/j.chembiol.2005.10.017 - DOI - PubMed

MeSH terms