

Sex inequalities in cardiovascular risk prediction
- PMID: 38833617
- PMCID: PMC11416056
- DOI: 10.1093/cvr/cvae123
Sex inequalities in cardiovascular risk prediction
Abstract
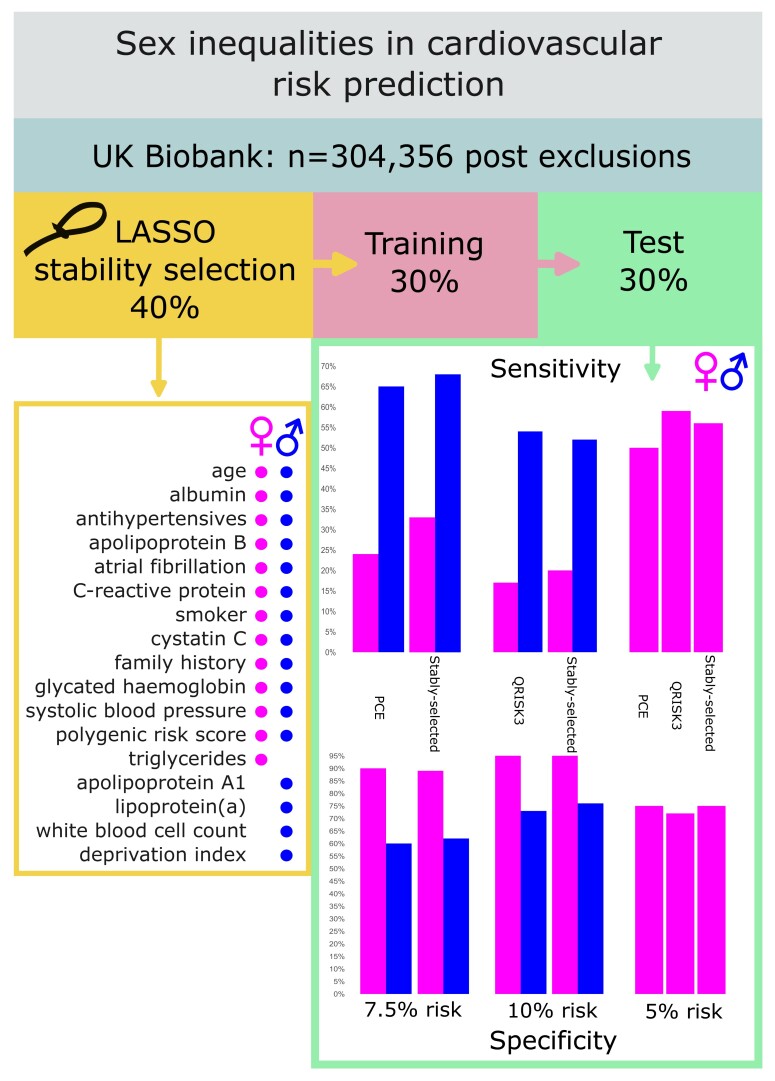
Aims: Evaluate sex differences in cardiovascular disease (CVD) risk prediction, including use of (i) optimal sex-specific risk predictors and (ii) sex-specific risk thresholds.
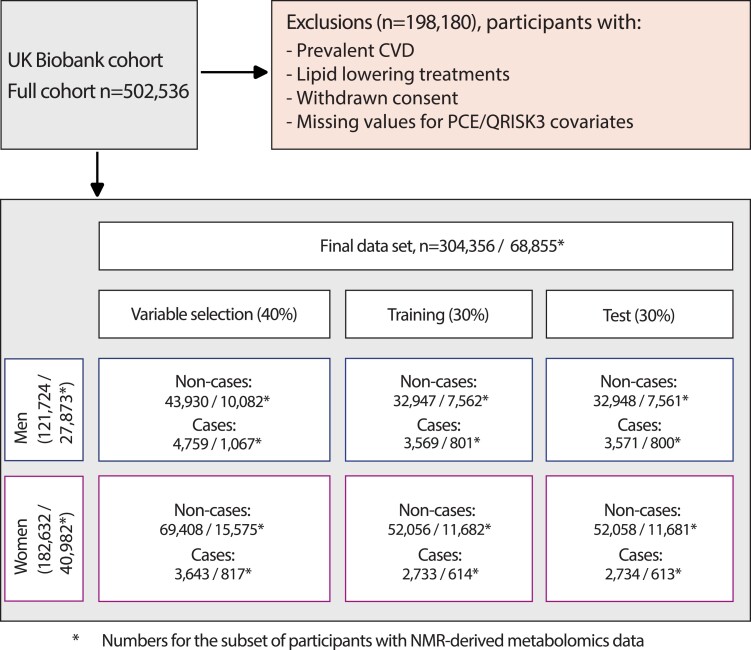
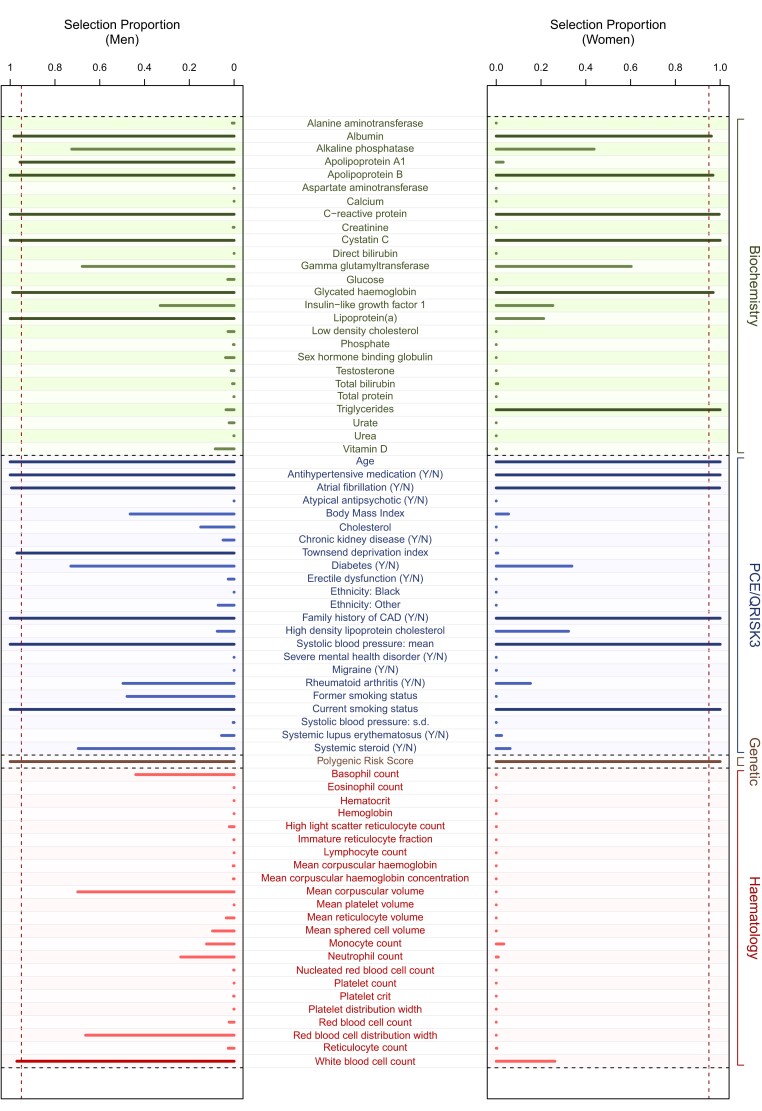
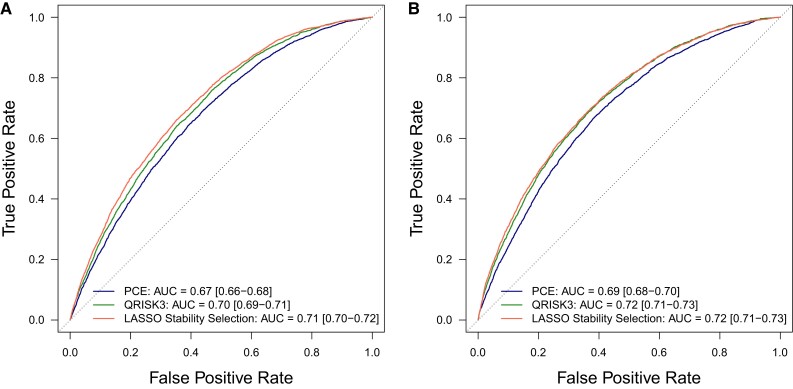
Methods and results: Prospective cohort study using UK Biobank, including 121 724 and 182 632 healthy men and women, respectively, aged 38-73 years at baseline. There were 11 899 (men) and 9110 (women) incident CVD cases (hospitalization or mortality) with a median of 12.1 years of follow-up. We used recalibrated pooled cohort equations (PCEs; 7.5% 10-year risk threshold as per US guidelines), QRISK3 (10% 10-year risk threshold as per UK guidelines), and Cox survival models using sparse sex-specific variable sets (via LASSO stability selection) to predict CVD risk separately in men and women. LASSO stability selection included 12 variables in common between men and women, with 3 additional variables selected for men and 1 for women. C-statistics were slightly lower for PCE than QRISK3 and models using stably selected variables, but were similar between men and women: 0.67 (0.66-0.68), 0.70 (0.69-0.71), and 0.71 (0.70-0.72) in men and 0.69 (0.68-0.70), 0.72 (0.71-0.73), and 0.72 (0.71-0.73) in women for PCE, QRISK3, and models using stably selected variables, respectively. At current clinically implemented risk thresholds, test sensitivity was markedly lower in women than men for all models: at 7.5% 10-year risk, sensitivity was 65.1 and 68.2% in men and 24.0 and 33.4% in women for PCE and models using stably selected variables, respectively; at 10% 10-year risk, sensitivity was 53.7 and 52.3% in men and 16.8 and 20.2% in women for QRISK3 and models using stably selected variables, respectively. Specificity was correspondingly higher in women than men. However, the sensitivity in women at 5% 10-year risk threshold increased to 50.1, 58.5, and 55.7% for PCE, QRISK3, and models using stably selected variables, respectively.
Conclusion: Use of sparse sex-specific variables improved CVD risk prediction compared with PCE but not QRISK3. At current risk thresholds, PCE and QRISK3 work less well for women than men, but sensitivity was improved in women using a 5% 10-year risk threshold. Use of sex-specific risk thresholds should be considered in any re-evaluation of CVD risk calculators.
Keywords: Biomarkers; CVD risk prediction; Pooled cohort equations; QRISK3; Sparse variable selection.
© The Author(s) 2024. Published by Oxford University Press on behalf of the European Society of Cardiology.
Conflict of interest statement
Conflict of interest: M.C.-H. holds shares in the O-SMOSE company. Consulting activities conducted by the company are independent of the present work, and M.C.-H. has no conflict of interest to declare. All other authors have no competing interests to declare.
Figures
Comment in
-
How far are we from accurate sex-specific risk prediction of cardiovascular disease? One size may not fit all.Cardiovasc Res. 2024 Sep 21;120(11):1237-1238. doi: 10.1093/cvr/cvae135. Cardiovasc Res. 2024. PMID: 38862399 No abstract available.
Similar articles
-
Independent external validation of the QRISK3 cardiovascular disease risk prediction model using UK Biobank.Heart. 2023 Oct 26;109(22):1690-1697. doi: 10.1136/heartjnl-2022-321231. Heart. 2023. PMID: 37423742 Free PMC article.
-
Effect of competing mortality risks on predictive performance of the QRISK3 cardiovascular risk prediction tool in older people and those with comorbidity: external validation population cohort study.Lancet Healthy Longev. 2021 Jun;2(6):e352-e361. doi: 10.1016/S2666-7568(21)00088-X. Lancet Healthy Longev. 2021. PMID: 34100008 Free PMC article.
-
Development and validation of QRISK3 risk prediction algorithms to estimate future risk of cardiovascular disease: prospective cohort study.BMJ. 2017 May 23;357:j2099. doi: 10.1136/bmj.j2099. BMJ. 2017. PMID: 28536104 Free PMC article.
-
Sex differences in cardiovascular risk factors and disease prevention.Atherosclerosis. 2015 Jul;241(1):211-8. doi: 10.1016/j.atherosclerosis.2015.01.027. Epub 2015 Jan 28. Atherosclerosis. 2015. PMID: 25670232 Review.
-
Performance of the Framingham risk models and pooled cohort equations for predicting 10-year risk of cardiovascular disease: a systematic review and meta-analysis.BMC Med. 2019 Jun 13;17(1):109. doi: 10.1186/s12916-019-1340-7. BMC Med. 2019. PMID: 31189462 Free PMC article.
References
-
- WHO . Global status report on noncommunicable diseases 2014. http://www.who.int/nmh/publications/ncd-status-report-2014/en/. 2014.
-
- Damen JA, Hooft L, Schuit E, Debray TP, Collins GS, Tzoulaki I, Lassale CM, Siontis GC, Chiocchia V, Roberts C, Schlüssel MM, Gerry S, Black JA, Heus P, van der Schouw YT, Peelen LM, Moons KG. Prediction models for cardiovascular disease risk in the general population: systematic review. BMJ 2016;353:i2416. - PMC - PubMed
-
- Stone NJ, Robinson JG, Lichtenstein AH, Bairey Merz CN, Blum CB, Eckel RH, Goldberg AC, Gordon D, Levy D, Lloyd-Jones DM, McBride P, Schwartz JS, Shero ST, Smith SC Jr, Watson K, Wilson PW, Eddleman KM, Jarrett NM, LaBresh K, Nevo L, Wnek J, Anderson JL, Halperin JL, Albert NM, Bozkurt B, Brindis RG, Curtis LH, DeMets D, Hochman JS, Kovacs RJ, Ohman EM, Pressler SJ, Sellke FW, Shen WK, Smith SC Jr, Tomaselli GF; American College of Cardiology/American Heart Association Task Force on Practice Guidelines . 2013 ACC/AHA guideline on the treatment of blood cholesterol to reduce atherosclerotic cardiovascular risk in adults: a report of the American College of Cardiology/American Heart Association Task Force on Practice Guidelines. Circulation 2014;129:S1–S45. - PubMed
-
- Goff DC Jr, Lloyd-Jones DM, Bennett G, Coady S, D'Agostino RB, Gibbons R, Greenland P, Lackland DT, Levy D, O'Donnell CJ, Robinson JG, Schwartz JS, Shero ST, Smith SC Jr, Sorlie P, Stone NJ, Wilson PW, Jordan HS, Nevo L, Wnek J, Anderson JL, Halperin JL, Albert NM, Bozkurt B, Brindis RG, Curtis LH, DeMets D, Hochman JS, Kovacs RJ, Ohman EM, Pressler SJ, Sellke FW, Shen WK, Smith SC Jr, Tomaselli GF; American College of Cardiology/American Heart Association Task Force on Practice Guidelines . 2013 ACC/AHA guideline on the assessment of cardiovascular risk: a report of the American College of Cardiology/American Heart Association Task Force on Practice Guidelines. Circulation 2014;129:S49–S73. - PubMed
Publication types
MeSH terms
Grants and funding
LinkOut - more resources
Full Text Sources
