. 2024 Oct 1;116(10):1598-1611.
doi: 10.1093/jnci/djae120.

BATF-dependent Th17 cells act through the IL-23R pathway to promote prostate adenocarcinoma initiation and progression

Affiliations

BATF-dependent Th17 cells act through the IL-23R pathway to promote prostate adenocarcinoma initiation and progression

Sen Liu et al. J Natl Cancer Inst. .

Abstract

Background: The role of Th17 cells in prostate cancer is not fully understood. The transcription factor BATF controls the differentiation of Th17 cells. Mice deficient in Batf do not produce Th17 cells.

Methods: In this study, we aimed to characterize the role of Batf-dependent Th17 cells in prostate cancer by crossbreeding Batf knockout mice with mice conditionally mutant for Pten.

Results: We found that Batf knockout mice had changes in the morphology of prostate epithelial cells compared with normal mice, and Batf knockout mice deficient in Pten (called Batf-) had smaller prostate size and developed fewer invasive prostate adenocarcinomas than Pten-deficient mice with Batf expression (called Batf+). The prostate tumors in Batf- mice showed reduced proliferation, increased apoptosis, decreased angiogenesis and inflammatory cell infiltration, and activation of nuclear factor-κB signaling. Moreover, Batf- mice showed significantly reduced interleukin 23 (IL-23)-IL-23R signaling. In the prostate stroma of Batf- mice, IL-23R-positive cells were decreased considerably compared with Batf+ mice. Splenocytes and prostate tissues from Batf- mice cultured under Th17 differentiation conditions expressed reduced IL-23/IL-23R than cultured cells from Batf+ mice. Anti-IL-23p19 antibody treatment of Pten-deficient mice reduced prostate tumors and angiogenesis compared with control immunoglobulin G-treated mice. In human prostate tumors, BATF messenger RNA level was positively correlated with IL-23A and IL-23R but not RORC.

Conclusion: Our novel findings underscore the crucial role of IL-23-IL-23R signaling in mediating the function of Batf-dependent Th17 cells, thereby promoting prostate cancer initiation and progression. This finding highlights the BATF-IL-23R axis as a promising target for the development of innovative strategies for prostate cancer prevention and treatment.


Conflict of interest statement

The authors declare no potential conflicts of interest.

Figures

Figure 1.
Figure 1.
The confirmation of animal models. A) Strategy of animal breeding. B) Gel images showing representative polymerase chain reaction genotyping. C) Representative immunohistochemistry of Pten and P-S6 in the dorsal prostate lobes of mice at 4, 6, 9, and 12 weeks of age. Ci and Cii show immunohistochemical staining for Pten and P-S6 in consecutive sections of prostate tissue from 6-week-old Batf+ mice, indicating Pten loss and activation of P-S6. Ciii shows immunohistochemistry for P-S6 in prostate tissue from a 9 week-old Batf+ mouse, indicating activation of P-S6. Civ shows immunohistochemistry for P-S6 in the prostate tissue of a 12-week-old Batf knockout mouse with Pten wild type (named Batf -/-), indicating that Pten wild-type prostate tissue has no activation of P-S6. Cv-Cviii show immunohistochemistry for P-S6 in 4- and 12-week-old Pten-deficient mice with or without Batf expression. Original magnification, ×100 (scale bar, 200 µm); inserts ×400 (scale bar, 50 µm). D) Quantitative polymerase chain reaction results for Batf in the prostate tissues of 30-week-old mice. E) Representative immunohistochemistry for Batf in the immune cells of Batf+ and Batf- mice stroma. Original magnification, ×100 (scale bar, 200 µm); inserts, ×400 (scale bar, 50 µm). F) Number of Batf-positive immune cells per high-power field. Data are mean (95% confidence interval); n = 3 mice/group. *P <.05, **P <.01.
Figure 2.
Figure 2.
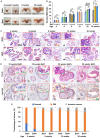
Batf knockout decreased prostate tumor growth and the formation of invasive prostate adenocarcinoma. A) Representative photograph of the genitourinary (GU)-blocs. B) The ratios of GU-bloc weights normalized by body weights (BWs) over the time course. C) Representative Hematoxylin and Eosin (H&E)-stained dorsal prostate lobes at 4, 6, 9, 12, and 30 weeks of age. Original magnification, Ci-Civ, ×200 (scale bar, 200 µm); Cv-Cx, ×100 (scale bar, 400 µm); inserts, ×400 (scale bar, 100 µm). D) Representatives of H&E and laminin staining in consecutive prostate sections of 12- and 30-week-old mice. Arrows in the inserts indicate the fibromuscular stroma or the front edges of invasion where the fibromuscular stroma is absent. Original magnification, ×100 (scale bar, 100 µm); inserts, ×400 (scale bar, 25 µm). E) Percentages of normal, prostatic intraepithelial neoplasia (PIN), and invasive adenocarcinomas. *P <.05, **P <.01.
Figure 3.
Figure 3.
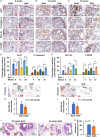
Batf knockout decreased cellular proliferation, increased apoptosis, and reduced angiogenesis in prostate tissues. A-C) Ki-67, C-Caspase-3, BCL-XL, and C-PARP staining in the prostate tissue of mice at 9, 12, and 30 weeks of age; arrows indicate the positive cells. Original magnification, ×400 (scale bar, 50 µm); inserts, ×100 (scale bar, 400 µm). D, E) Percentages of positive cells for Ki-67 and C-Caspase-3. (D) and BCL-XL and C-PARP (E) in dorsal lateral prostate lobes. *P <.05, **P <.01, ***P <.001, ****P <.0001. F, H) Representative CD31 staining for new blood vessels. Original magnification, ×200 (scale bar, 50 µm); inserts, ×400 (scale bar, 25 µm); arrows indicate new blood vessels. G, I) The density of microvessels. J) Representative Hematoxylin and Eosin (H&E)-stained sections in the prostate tissue of 30-week-old mice. Original magnification, Ji and Jiii, ×200 (scale bar, 200 µm); Jii and Jiv, ×400 (scale bar, 100 µm). K) Number of inflammatory cells counted on H&E-stained sections. *P <.05.
Figure 4.
Figure 4.
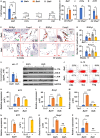
Batf knockout decreased the expression of Th17-related cytokines, transcription factors, and AP-1 family members in the prostate, serum, and splenocytes of Pten-deficient and Pten wild-type mice. A) Quantitative polymerase chain reaction results for Batf, Il17a, Il17f, and Il10 in the prostate tissue of 12 week-old Batf+, Batf-, and Batf-/- (Batf knockout with Pten wild-type) mice. Il17a was significantly reduced in Pten-deficient mice, even lower than in Batf-/- normal mice. B-D) Quantitative polymerase chain reaction results for Batf, Il17a, and Il17f in the prostate tissue of 9 week-old Pten-deficient mice (Ptenko) vs age-matched Pten wild-type (Ctr) mice. Batf was significantly increased, but Il17a and Il17f were reduced. E, F) Representative immunohistochemical staining for RORγt and Foxp3 in the prostate stroma of mice at 6 and 30 weeks of age. Original magnification, ×400 (scale bar, 50 µm); inserts, ×100 (scale bar, 1000 µm). G) Number of positive cells for RORγt (upper panel) and Foxp3 (lower panel). *P <.05; ***P <.001. H) Enzyme-linked immunosorbent assay results for IL-17A protein in mouse serum. I) Immuno blot results in CD4+ T cells isolated from mouse spleen. J) Naive CD4+ T cells were ex vivo cultured under Treg differentiation conditions for 4 days, stimulated by Phorbol-12-myristate-13-acetate (PMA) and ionomycin for 6 hours, and then flow cytometry was performed. Only CD4+ T cells were gated, and interleukin 10 (IL-10)–expressing CD4+ T cells were analyzed. K-M) Quantitative polymerase chain reaction results for Il17, RORγt, and Il10 in splenocytes cultured under Th17 differentiation condition plus IL-23 for 72 hours. Th17‒, Th0 condition, Th17+, Th17 condition. N-P) Quantitative polymerase chain reaction results for Il17, RORγt, and Il10 in prostate tissue cultured under Th17 differentiation condition plus IL-23 for 72 hours. *P <.05, **P <.01, ***P <.001, ****P <.0001; ns = not significant.
Figure 5.
Figure 5.
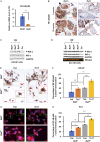
Batf knockout decreased nuclear factor–κB (NF-κB) activation. A) Quantitative polymerase chain reaction results for messenger RNA (mRNA) level of NF-κB–P65 in prostate tissues. Data are represented as mean (95% confidence interval), n = 3 animals per group, **P <.01. B) Representative prostate sections stained for NF-κB–P65 in mouse prostate tissues at 9 and 30 weeks of age. Original magnification, ×100 (scale bar, 200 µm); inserts, ×400 (scale bar, 50 µm); arrows indicate positive cell nuclear translocation. C-D) Representative Immuno blot results for NF-κB signaling in prostate cancer cell lines after exposure to conditioned media (CM) from Batf+/+ or Batf-/- mouse naive CD4+ T cells (Th0) or differentiated Th17 cells for 48 hours. E) Representative immunohistochemistry for NF-κB-p65 in LNCaP (human prostate cancer cell line) cells after exposure to CM from Batf+/+ or Batf -/- mouse naive CD4+ T cells (Th0) or differentiated Th17 cells for 48 hours. Original magnification, ×400 (scale bar, 20 µm); insert, ×800 (scale bar, 10 µm). F) Percentage of NF-κB-P65 nuclear translocation per high-power field. *P <.05, **P <.01, ***P <.001. G) Representative immunofluorescence for NF-κB–P65 in PC3 (human prostate cancer cell line) cells after exposure to CM from Batf+/+ or Batf-/- mouse naive CD4+ T cells (Th0) or differentiated Th17 cells for 48 hours. Original magnification, ×600 (scale bar, 13 µm); insert, ×1200 (scale bar, 6.6 µm). H) Percentage of NF-κB–P65 nuclear translocation per high-power field. *P <.05, **P <.01, ***P <.001.
Figure 6.
Figure 6.
Batf knockout decreased interleukin 23 (IL-23)-IL-23R signaling in Pten-deficient mice, and Batf binds to the motifs of the mouse IL-23R gene promoter region. A) Representative immunohistochemistry for IL-23R–positive immune cells of Batf+ and Batf- mice stroma at different ages. Original magnification, ×100 (scale bar, 200 µm); inert, ×400 (scale bar, 50 µm). B) Numbers of IL-23R–positive cells per high-power field. Data are mean (95% confidence interval), n = 3 mice/group. *P <.05, **P <.01. C) Representative Western blot result for IL-23R in prostate tissue of Batf+ and Batf- mice at 9 and 30 weeks of age. D) Quantitative reverse transcriptase–polymerase chain reaction (PCR) results of Il23r in the prostate tissue of 12-week-old Pten wild-type mice (Ctr) and Pten-null mice. E) Quantitative reverse transcriptase–PCR results of Il23r in the prostate tissue of 12-week-old Batf+ and Batf- (Pen-null), and Batf knockout (Pten wild-type) mice. F) Quantitative reverse transcriptase–PCR results of Il23r in the prostate tissue of 30-week-old Batf+ and Batf- mice. G) Quantitative reverse transcriptase–PCR results of Il23p19 in the prostate tissue of 12-week-old Batf+ and Batf- (Pten-null), and Batf knockout (Pten wild-type) mice. H) Quantitative reverse transcriptase–PCR results of Il23p19 in the prostate tissue of 30-week-old Batf+ and Batf- mice. I) Mouse IL-23R levels in the plasma of Batf+ and Batf- mice. J) Representative Western blot for IL-23R in CD4+ T cell lysates from Batf+ and Batf- mice. K-L) Quantitative reverse transcriptase–PCR results for Il23r messenger RNA in Batf+ and Batf- mouse splenocytes (K) or in ex vivo cultured mouse prostate tissue (L) in Th17 differentiation conditioned media for 72 hours. *P <.05, **P <.01, ***P <.001. M) IL-23R binding sites and chromatin immunoprecipitation (ChIP) quantitative PCR product information. N, O) The results of ChIP assays were measured by quantitative PCR. Enrichment of IL23R binding sites using anti-Batf rabbit polyclonal antibody on sheared chromatin from mouse splenocytes. Normal rabbit immunoglobulin G (IgG) was used as a negative immunoprecipitation (IP) control. The purified DNA was analyzed on the Bio-Rad CFX Opus 96 Real-Time PCR System, with optimized primers for the promoter region of the AP-1 motifs in the IL23R gene. Data are presented as fold enrichment of the antibody signal vs the negative control IgG without the IL-23 treatment group, calculated using the comparative Ct method (also referred to as the 2-△△Ct method). Data are mean (95% confidence interval) (n = 3) of 3 independent experiments. *P <.05, **P <.01, ns = not significant difference compared with the corresponding IgG IP groups.
Figure 7.
Figure 7.
Anti–interleukin 23 (IL-23)p19 antibody treatment decreased prostate adenocarcinoma in Pten-deficient mice. A) Representative photographs of genitourinary (GU)-blocs. B) Body weight (BW). C) GU-bloc weight. D) GU-bloc to BW ratio; the number of animals in each group is shown under the abscissa. *P <.05 compared with control mice. E) Representative sections of dorsal prostatic lobes were stained with Hematoxylin and Eosin (H&E) and subjected to immunohistochemistry for laminin in consecutive sections for both groups. Arrows indicate an invasive site in control mice and a noninvasive site in IL-23p19 antibody–treated mice. Original magnification, ×400 (scale bar, 50 µm); inserts, ×100 (scale bar, 500 µm). F) Percentages of prostatic intraepithelial neoplasia (PIN) and cancer in dorsal prostatic lobes of anti–IL-23p19 and anti–immunoglobulin G (IgG)–treated mice. The number of animals in each group is shown under the abscissa. *P <.05 compared with control mice. G, I) Representative prostate sections stained for Ki-67 and apoptosis (C-caspase-3) in consecutive sections in anti–IL-23p19 antibody and anti-IgG–treated mice. Arrows indicate the positive cells. Original magnification, ×100 (scale bar, 200 µm); inert, ×400 (scale bar, 50 µm). H) Percentages of Ki-67–positive cells in mouse prostates. Data are presented as mean (95% confidence interval) (n = 3 animals per group), **P <.01. J) Percentages of apoptotic cells in anti–IL-23p19 antibody and anti-IgG–treated mouse prostates. Data are represented as mean (95% confidence interval) (n = 3 animals per group), ***P <.001. K) Representative prostate sections stained for CD31 in anti–IL-23p19 antibody and anti-IgG–treated mice. Arrows indicate the positive cells. L) Density of micro–blood vessels per high-power field in anti–IL-23p19 antibody and anti-IgG–treated mouse prostates. Data are represented as mean (95% confidence interval) (n = 3 animals per group), *P <.05.
Figure 8.
Figure 8.
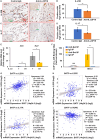
Anti–interleukin 23 (IL-23)p19 antibody treatment decreased IL-23R– and IL-17–positive cells in Pten-deficient mouse prostate stroma, recombinant mouse IL-23–treated Pten wild-type mouse splenocytes increased Il23r and Batf messenger RNA (mRNA) levels, Batf binds to IL-23R in mouse castration-resistant prostate cancer cell lines (MyC-CaP/CR), and IL-23A and IL-23R mRNA levels positively correlate with BATF mRNA levels in human prostate tumors. A, C) Representative immunohistochemical staining for IL-23R– and IL-17–expressing cells in consecutive sections of the prostate stroma of anti–IL-23p19 or control (Ctr) immunoglobulin G (IgG)–treated Pten-null mice. B, D) Number of positive cells per high-power field. *P <.05, **P <.01. E) Quantitative polymerase chain reaction results for Il23r and Batf mRNAs in mouse splenocytes treated with recombinant mouse IL-23 or control medium (without IL-23). F) The result of chromatin immunoprecipitation (ChIP) assays was measured by quantitative polymerase chain reaction. Enrichment of IL23R biding sites using anti-BATF rabbit polyclonal antibody on sheared chromatin from MyC-CaP/CR cells transfected with 4 μg pcDNA3.1-mBATF (Plasmid No. 34575, Addgene) for 48 hours. Normal rabbit IgG was used as a negative IP control. The purified DNA was analyzed on the Bio-Rad CFX Opus 96 Real-Time PCR System, with optimized primers for the promoter region of the AP-1 motifs in the IL23R gene. Data are presented as fold enrichment of the antibody signal vs the negative control IgG group, calculated using the comparative Ct method. Data are mean (95% confidence interval) (n = 3) of 3 independent experiments. **P <.01, ns = not significant difference compared with the corresponding IgG IP groups. G-J) The BATF, IL23A, IL23R, IL17A, and RORC mRNA expression, RSEM (batch normalized from Illumina HiSeq_RNASeqV2) were downloaded from the cBioPortal for genomics—Prostate Adenocarcinoma (The Cancer Genome Atlas Program [TCGA], Pan-Cancer Atlas), including 494 samples. G) Correlation between the mRNA levels of IL23A and BATF. H) Correlation between the mRNA levels of IL23R and BATF. I) Correlation between the mRNA levels of IL17A and BATF. J) Correlation between the mRNA levels of RORC and BATF. Sample size and the statistical analysis results are shown on each panel.

Similar articles

Cited by

References

    1. Giaquinto AN, Sung H, Miller KD, et al.Cancer statistics, 2022. CA Cancer J Clin. 2022;72(6):524-541. - PubMed
    1. Schatteman PH, Hoekx L, Wyndaele JJ, Jeuris W, Van Marck E.. Inflammation in prostate biopsies of men without prostatic malignancy or clinical prostatitis: correlation with total serum PSA and PSA density. Eur Urol. 2000;37(4):404-412. - PubMed
    1. Huang L, LaBonte MJ, Craig SG, Finn SP, Allott EH.. Inflammation and prostate cancer: a multidisciplinary approach to identifying opportunities for treatment and prevention. Cancers (Basel). 2022;14(6):1367. - PMC - PubMed
    1. Radej S, Szewc M, Maciejewski R.. Prostate infiltration by Treg and Th17 cells as an immune response to. Int J Mol Sci. 2022;23(16):8849. - PMC - PubMed
    1. Sfanos KS, Bruno TC, Maris CH, et al.Phenotypic analysis of prostate-infiltrating lymphocytes reveals TH17 and Treg skewing. Clin Cancer Res. 2008;14(11):3254-3261. - PMC - PubMed

MeSH terms