. 2024 Jun 3;40(6):btae356.
doi: 10.1093/bioinformatics/btae356.

GammaGateR: semi-automated marker gating for single-cell multiplexed imaging

Affiliations

GammaGateR: semi-automated marker gating for single-cell multiplexed imaging

Jiangmei Xiong et al. Bioinformatics. .

Abstract

Motivation: Multiplexed immunofluorescence (mIF) is an emerging assay for multichannel protein imaging that can decipher cell-level spatial features in tissues. However, existing automated cell phenotyping methods, such as clustering, face challenges in achieving consistency across experiments and often require subjective evaluation. As a result, mIF analyses often revert to marker gating based on manual thresholding of raw imaging data.

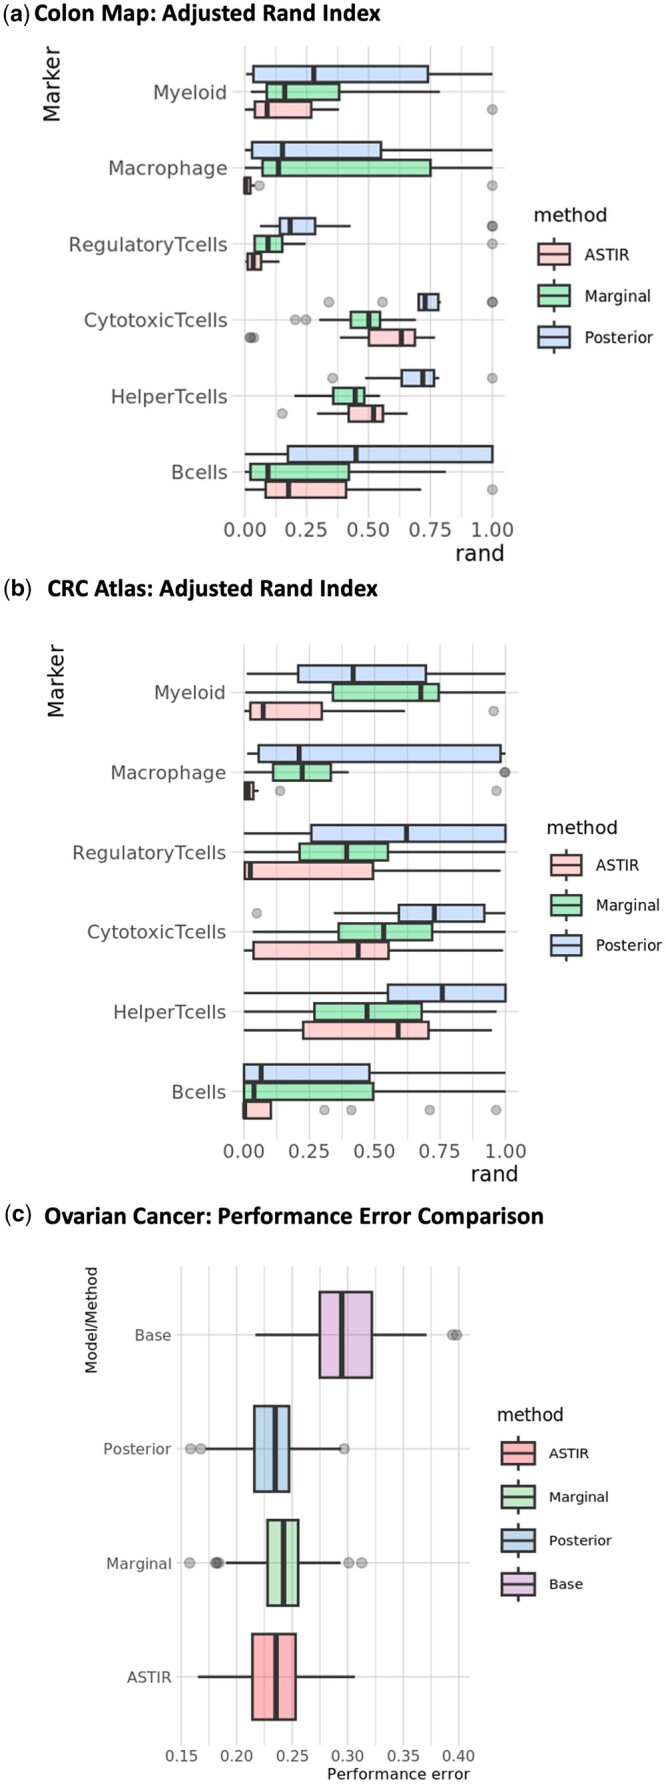
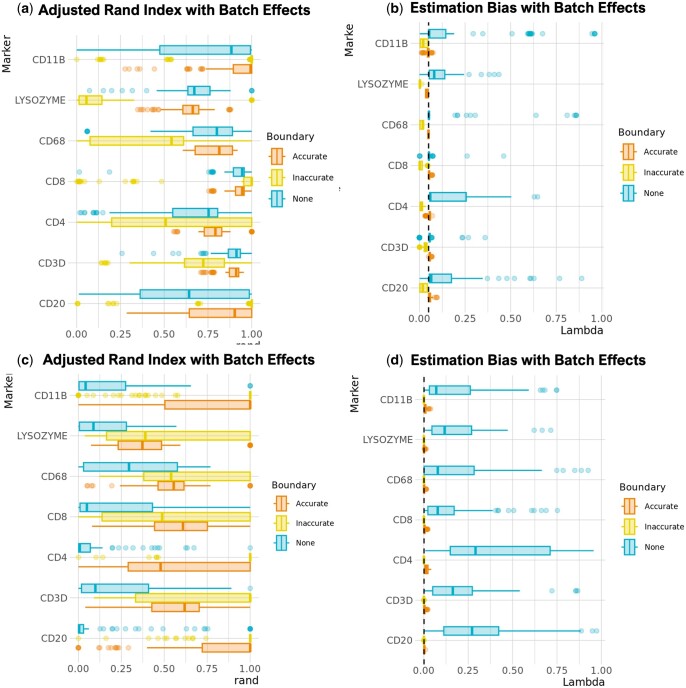
Results: To address the need for an evaluable semi-automated algorithm, we developed GammaGateR, an R package for interactive marker gating designed specifically for segmented cell-level data from mIF images. Based on a novel closed-form gamma mixture model, GammaGateR provides estimates of marker-positive cell proportions and soft clustering of marker-positive cells. The model incorporates user-specified constraints that provide a consistent but slide-specific model fit. We compared GammaGateR against the newest unsupervised approach for annotating mIF data, employing two colon datasets and one ovarian cancer dataset for the evaluation. We showed that GammaGateR produces highly similar results to a silver standard established through manual annotation. Furthermore, we demonstrated its effectiveness in identifying biological signals, achieved by mapping known spatial interactions between CD68 and MUC5AC cells in the colon and by accurately predicting survival in ovarian cancer patients using the phenotype probabilities as input for machine learning methods. GammaGateR is a highly efficient tool that can improve the replicability of marker gating results, while reducing the time of manual segmentation.

Availability and implementation: The R package is available at https://github.com/JiangmeiRubyXiong/GammaGateR.


Conflict of interest statement

None declared.

Figures

Figure 1.
Figure 1.
Overview of GammaGateR analysis pipeline for the CD4 marker channel. (1) GammaGateR takes segmented cell-level data as input. (2) Density polygons are used to visualize all slide level histograms and select constraints for model fit (3). (4) After model estimation (5.a), diagnostic plots are used to evaluate the model fit. (5.b) New constraints can be selected and the refitted model can be compared to a previous model. (6) Expression probabilities can be extracted for downstream analysis from the model objects
Figure 2.
Figure 2.
Performance evaluation for GammaGateR on the three datasets. “Posterior” and “marginal” refer to the posterior and marginal probabilities from GammaGateR, respectively. Cell phenotyping performance comparing GammaGateR to ASTIR in the (a) Colon MAP and (b) CRC Spatial atlas. (c) Survival prediction performance error in the ovarian cancer dataset, measured by 1-C-index. “Base” indicates the survival model including only age and cancer stage variable
Figure 3.
Figure 3.
Simulation results with known ground truth and realistic batch effects generated from the Colon MAP dataset across 100 simulated slides. (a) Adjusted Rand index (ARI) and (b) bias for simulated data with a known expressed cell proportion of 0.05. (c) ARI and (d) bias for simulated data with a known expressed cell proportion of 0.001. ARI compares cell phenotypes identified thresholding GammaGateR posterior probabilities to the ground truth generated from the simulation. The dashed lines (b and d) indicate the true expressed cell proportion, which is the same across markers, boundary types, and slides
Figure 4.
Figure 4.
Spatial analysis results using GammaGateR in the Colon MAP data. “AD” and “SSL” represent adenoma and sessile serrated lesions, respectively. (a) Comparison of CD3+ and MUC5AC+ cell proportions between tumor types in epithelial regions of the tumor mask. Each point is the mean marker-positive probabilities for one slide. The horizontal lines are means and vertical lines are robust 95% confidence intervals. (b) Ripley’s H curves for spatial interaction between MUC5AC+ and CD68+ cells for each slide. (c) Examples of MUC5AC+ and CD68+ cells identified with GammaGateR in the two tumor types, with corresponding raw image intensities in the multiplex images (MUC5AC, CD68, and NAKATPASE)

Update of

References

    1. Aghaeepour N, Finak G, Hoos H. et al.; DREAM Consortium. Critical assessment of automated flow cytometry data analysis techniques. Nat Methods 2013;10:228–38. - PMC - PubMed
    1. Ahmadian M, Rickert C, Minic A. et al. A platform-independent framework for phenotyping of multiplex tissue imaging data. PLoS Comput Biol 2023;19:e1011432. - PMC - PubMed
    1. Amitay Y, Bussi Y, Feinstein B. et al. CellSighter: a neural network to classify cells in highly multiplexed images. Nat Commun 2023;14:4302. - PMC - PubMed
    1. Chen B, Scurrah CR, McKinley ET. et al. Differential pre-malignant programs and microenvironment chart distinct paths to malignancy in human colorectal polyps. Cell 2021;184:6262–80.e26. - PMC - PubMed
    1. Chervoneva I, Peck AR, Yi M. et al. Quantification of spatial tumor heterogeneity in immunohistochemistry staining images. Bioinformatics 2021;37:1452–60. - PMC - PubMed